This series highlights two of our passions: our unique company culture and music. Born organically out of a hobby Slack channel, The Sound of InterWorks reveals the music that powers our work and how we share that with others.
What a year. A year with so much potential for puns (think: hindsight is 2020, 2020 vision … if only) turned out to be quite different. Rather than sounding like a good joke, many people will forever react to hearing “2020” the same way characters in Monty Python and the Holy Grail react to the “The Knights Who Say ‘Ni!’”.
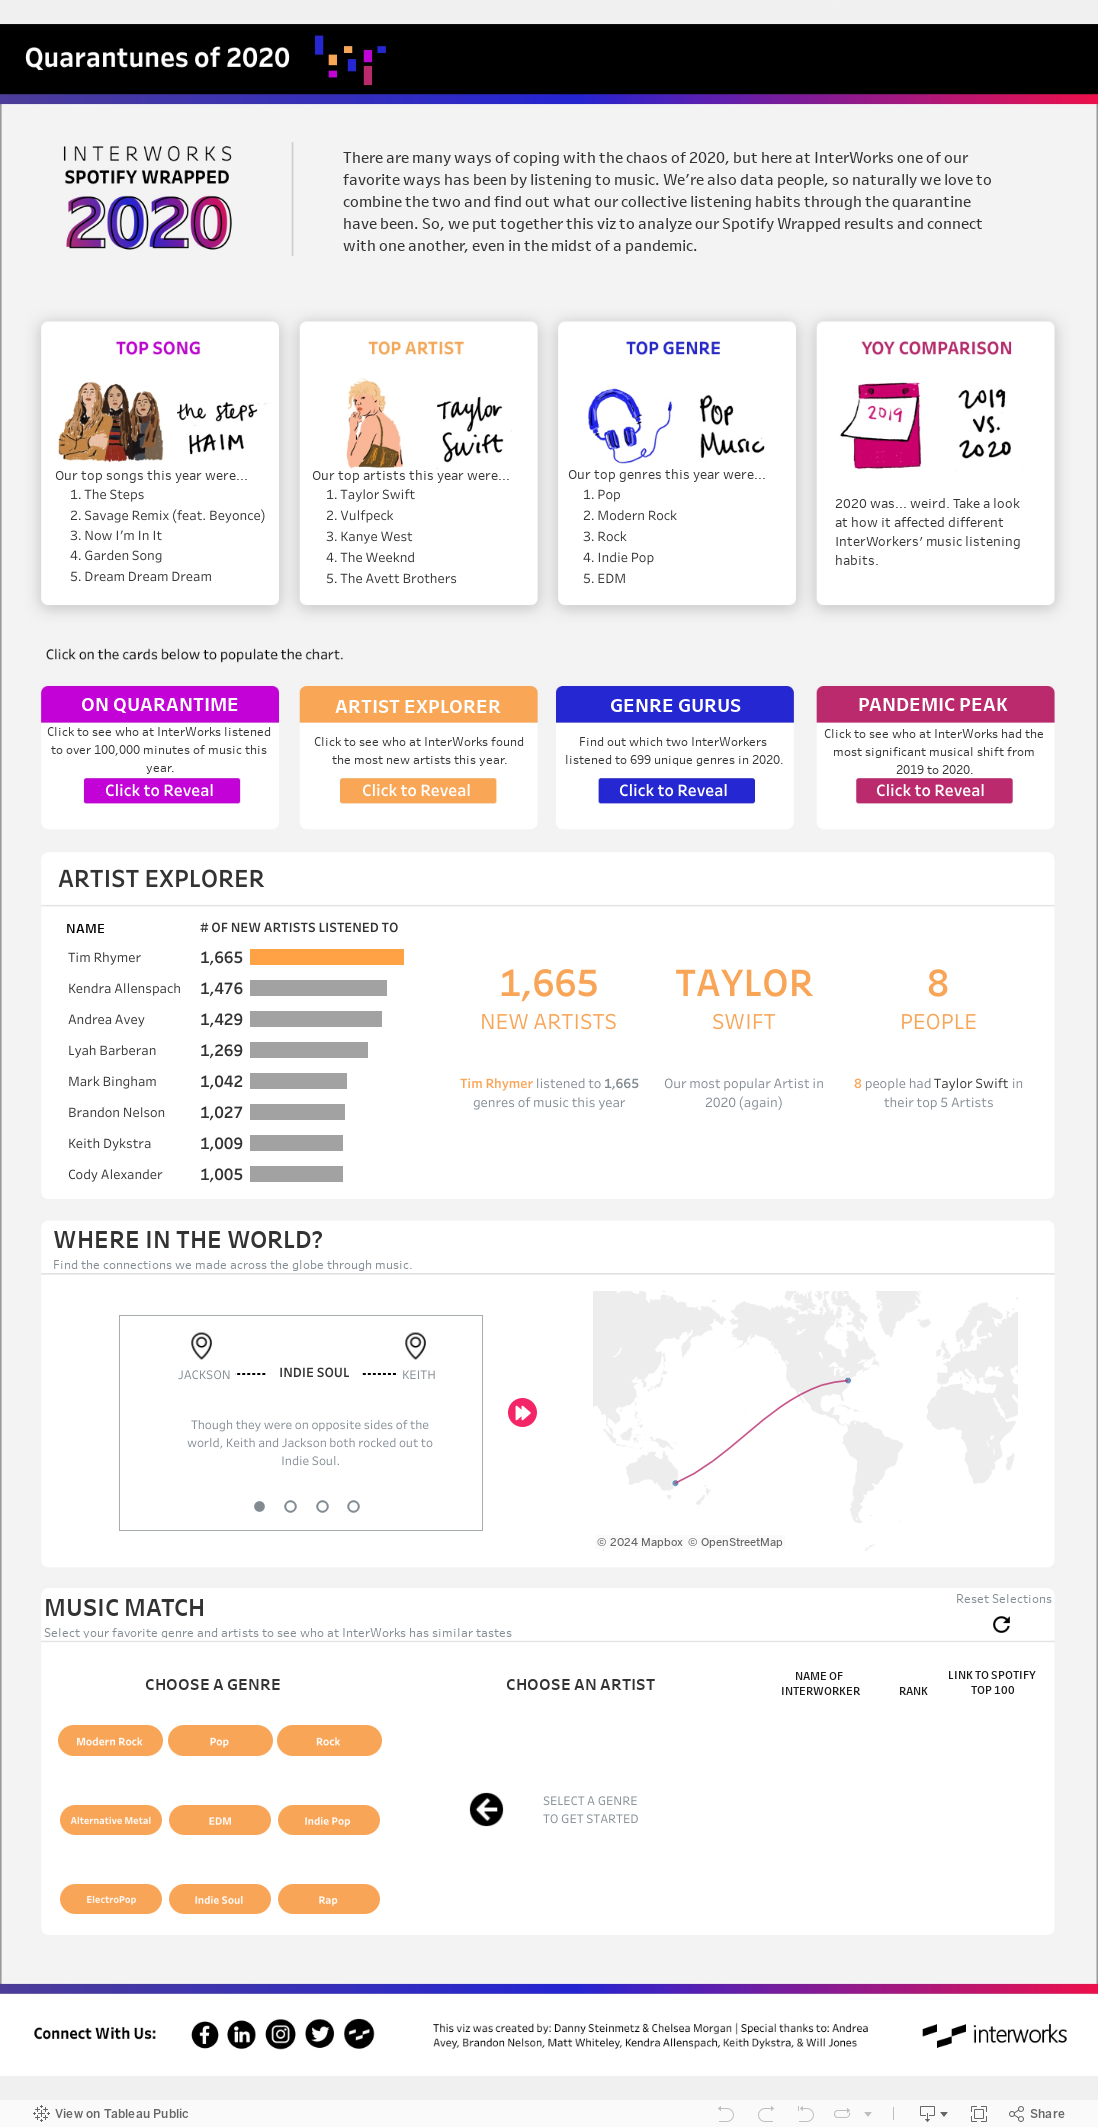
Using Data Visualization to Connect During the Pandemic
So, I’ll try to avoid mentioning 2020, Ni or quests for shrubberies. Instead, I want to focus on what so many of us have been craving recently: connection. Every year, InterWorks puts out an analysis of our collective Spotify Wrapped data. I was eager to get involved in this project ever since seeing the first one over two years ago. As a musician and a data analyst, there are few opportunities more fitting than this to work on.
And let me tell you, it has been a blast! But not for the reason I expected. Yes, the data was interesting. Yes, getting to think about music more than I already do was awesome. But the best part was certainly the connections I made during such isolating times. So, while there are plenty of tricks and tips I could share about the creation of this visualization, what I really want to share are the tips and tricks for connecting with real people through the data visualization process. So here they are—a few tips from me (a real living, breathing person) to you (another real living, breathing person):
- Choose a topic you are interested in and find other people who share your interest!
Make it fun! This can get tricky in a work environment, but see if you can do a blog or viz to highlight the culture of your company. There are thousands of articles on the internet, in business journals and in textbooks that stress the importance and benefits of having a good work culture (here’s one from Forbes just to prove I’m not lying). Get excited and get your coworkers excited with you!
- Form a team. Meet regularly. Turn your camera on!
Zoom fatigue is real; I get it. But it’s nice to remember there are real people out there, and they’re excited and invested in what you’re working on.
- Split up tasks. Depend on each other.
I could not have made this viz without the help of Chelsea Morgan, Keith Dykstra, Brandon Nelson, Kendra Allenspach and Matt Whiteley. Chelsea worked design magic, while Matt and Brandon helped with the concepts and data cleansing. Keith and Kendra gave incredible guidance and advice from their experience working on this project last year. It was especially nice to have a low-pressure reason to reach out to your teammates. I would often try to include something interesting I was finding in the data: “Hey Matt, how’s the Prep workflow going? Also, I had no idea you were also a big Arctic Monkeys fan!”
- Find something that intrigues or excites you? Add it to the viz!
I had a blast learning my coworkers’ music tastes. Finding people who had the same obscure artists in their top 5 (or other people that were also into psychedelic doom metal) made me feel much closer to all those coworkers I haven’t seen in months. I wanted to give other InterWorkers the opportunity to make the same connections with their own music preferences. So, we added an interactive section to the bottom to try to make it easier for others to find their “Music Matches.”
- Share your findings!
Don’t just keep it to yourself! Put it on Tableau Public, but don’t stop there! I reached out to Brandon to geek out on Vulfpeck with him and got lost in conversations about trainings, the Midwest, performing music and more! We showed each other new music, and I now feel more comfortable reaching out to him for help. Plus, I get more excited when I see him on a call with me. Your visualizations should always be connected to the real world as much as possible, so make sure you act on the information you gain from them.
Build Your Community
Who knows when (or even if) things will get back to normal, but one thing is constant: humans need community. So, start building yours. Do it any way you know how. Build a viz with a team. Reach out about unique hobbies. Share music. Connect! And have fun exploring the viz below: