While relying on each other is extra crucial in these strange times, sometimes it can still be tricky to figure out what that really looks like. Especially in the workplace. This blog is the second part of the story of how my colleague Keith and I climbed out of the pit of despair in a recent Tableau project. From unwavering enthusiasm to deep doubt and uncertainty, this collaborative project had taken us from the highest highs to the lowest lows. How did we get out? Here’s when things finally turned the corner.
The Turning Point, a.k.a. Escaping Death Valley
Kendra’s Perspective
Rather than giving up and letting Keith run with the rest of the project, I summoned the courage to be honest about how I was feeling. I admitted that I wasn’t having fun anymore and that I wasn’t sure where we were heading or how our ideas were going to come together. It wasn’t an easy conversation to initiate, but it led to a really productive discussion that helped us both see the way forward.
Keith’s Perspective
I was so glad Kendra initiated this conversation, though I felt a little defeated at first—another failed attempt at collaboration under my belt. Contrary to the voices in her head, Kendra had already contributed great ideas to the project (and some of her best ones were yet to come!). But by voicing her concerns, she helped me see that if I was having fun and she wasn’t, I wasn’t collaborating well. As it turns out, I was only a few steps behind her on my way to the valley of project hatred, and it was this honest conversation that ultimately helped us find our way out.
We reset some expectations about how we would work together, and our renewed sense of clarity rescued the project from the brink of death. When we finally published the dashboard, it was definitely a relief to be done. I spent a few days thinking I should never do a project like this again. But then Kendra and I did a post-mortem Zoom session (there may have been wine involved). We vented about the frustrating parts. We celebrated the things we were really proud of. And, ultimately, we realized we had learned some things through the ups and downs of the process.
Collaboration Lessons Learned
Lesson 1: Err on the Side of Over-Communication
Co-developing a dashboard can be challenging because Tableau doesn’t have version control and doesn’t alert you if someone else already has a version of a workbook open. A simple Slack message to check if the other person is actively working on the project can save you from the headache of reconciling multiple versions.
But on a more macro level, communicating honestly with your collaborators about your experience in the process is vital. Are you actually collaborating? Or are you just compromising? Are everyone’s ideas being equally considered? Do you have a shared vision of where you are heading? Your answers might change throughout the project, so check in frequently, and have the confidence to say something if you sense you’re not on the same page.
Lesson 2: Ask for Feedback Early and Often
As we mentioned, we started out in one direction and then made a pretty big turn after our first round of feedback. We’re glad we asked early, while we were still on the upward excitement incline! When we were about 90% done with the project, we asked a few friends who don’t use Tableau to click through our dashboard. They got stuck at one point and weren’t sure what to do next, so we knew we had more work to do.
It’s easy to lose sight of what makes sense to a user when you’re gradually building and changing things. So ask people with a fresh perspective to give you feedback throughout the development process. It will help you confirm that the direction you’re headed makes sense to someone other than yourself.
Lesson 3: Don’t Be Afraid to Try New Things
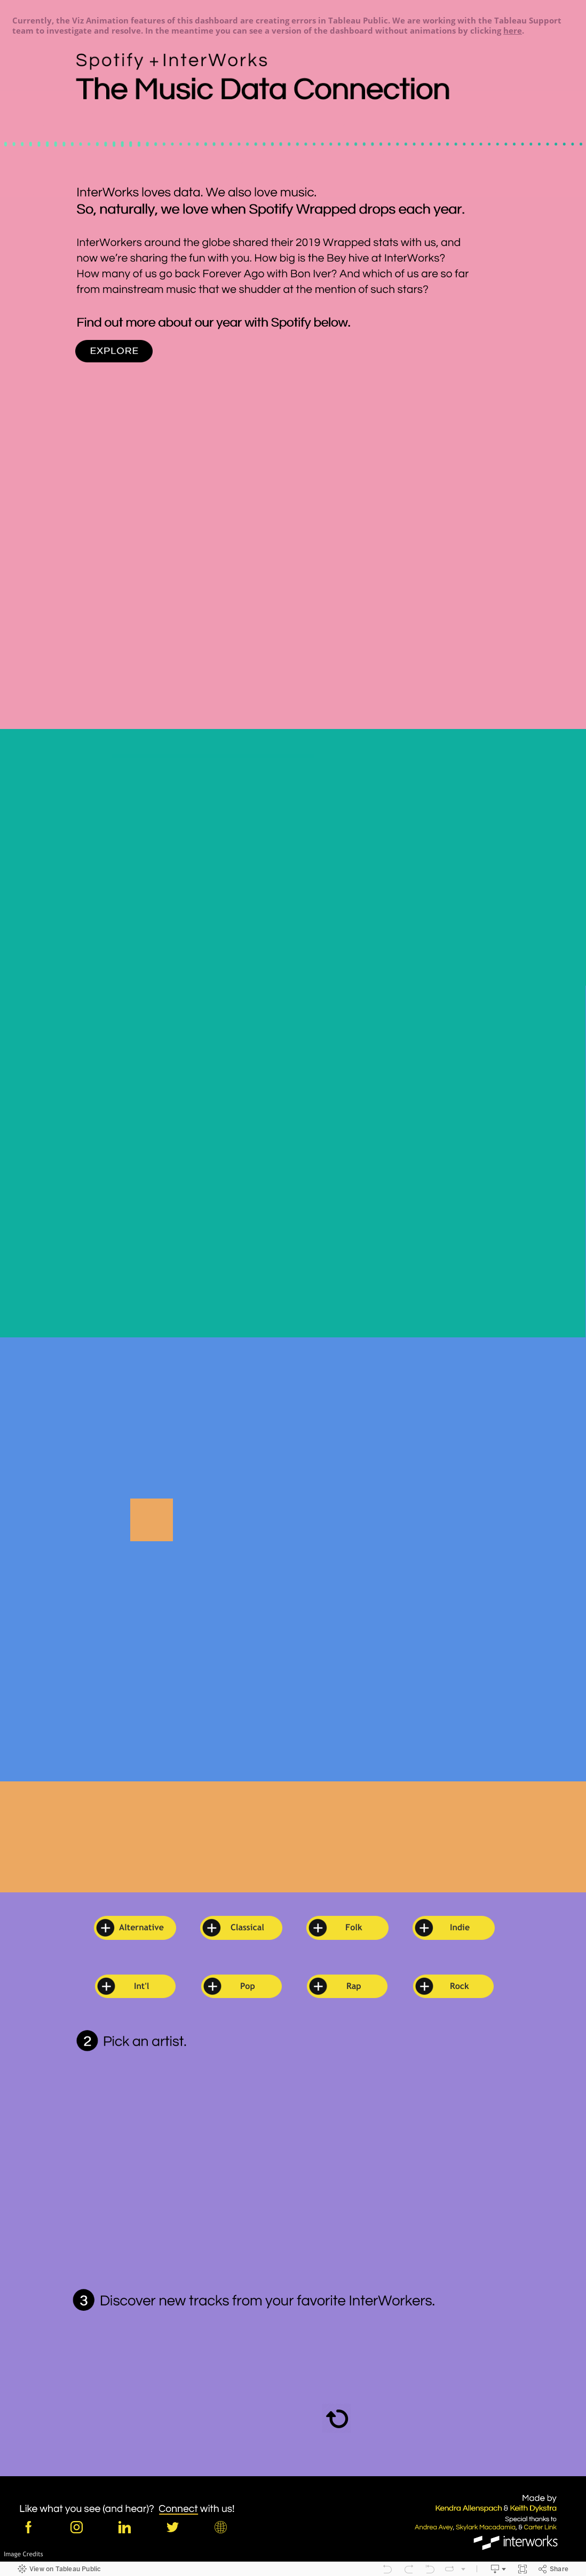
Many people will probably look at this project and say it has very little application to the Tableau work they do in traditional analytical settings. Will we ever create a dashboard with animated transitions and pictures of Taylor Swift in a business context? Probably not. But do we each have a much deeper understanding of parameter actions and how they can be useful in other settings because of this project? Absolutely! By working with unusual datasets outside the constraints of traditional dashboard requirements, we gave ourselves space to explore techniques we hadn’t tried before. Some of those things will be useful later. Others won’t. But we would never find the useful ones if we didn’t allow ourselves to try.
Want to see the final product? It was quite a journey to get there, but we’re pretty pleased with where we ended up. And hopefully, you’ve been able to learn a thing or two from our trial-and-error process as well!