
Robert updates user-submitted Tableau dashboards with visual best practices in this series, resulting in practical before-and-after insights.
With This Old Viz, I ask the online Tableau community to put forward visualizations that they’d like a little expert assistance on. My background over the last six years is a heavy Tableau user and certified Tableau trainer. Before that, I was in the website world wielding a combination skillset of design, development, online marketing and conversion optimization. The whole genesis of this series came about when I heard some of my students and clients saying that Tableau has a “look.” I took that as a challenge to make beautiful dashboards that stretched the traditional Tableau look while hopefully proving that any type of data can be beautiful.
Version 1 of the Viz
This time, my bat signal was answered by Nat Rchr in Barcelona. She shared with me her Tableau Public profile, and I picked the following viz—the Trees of London:
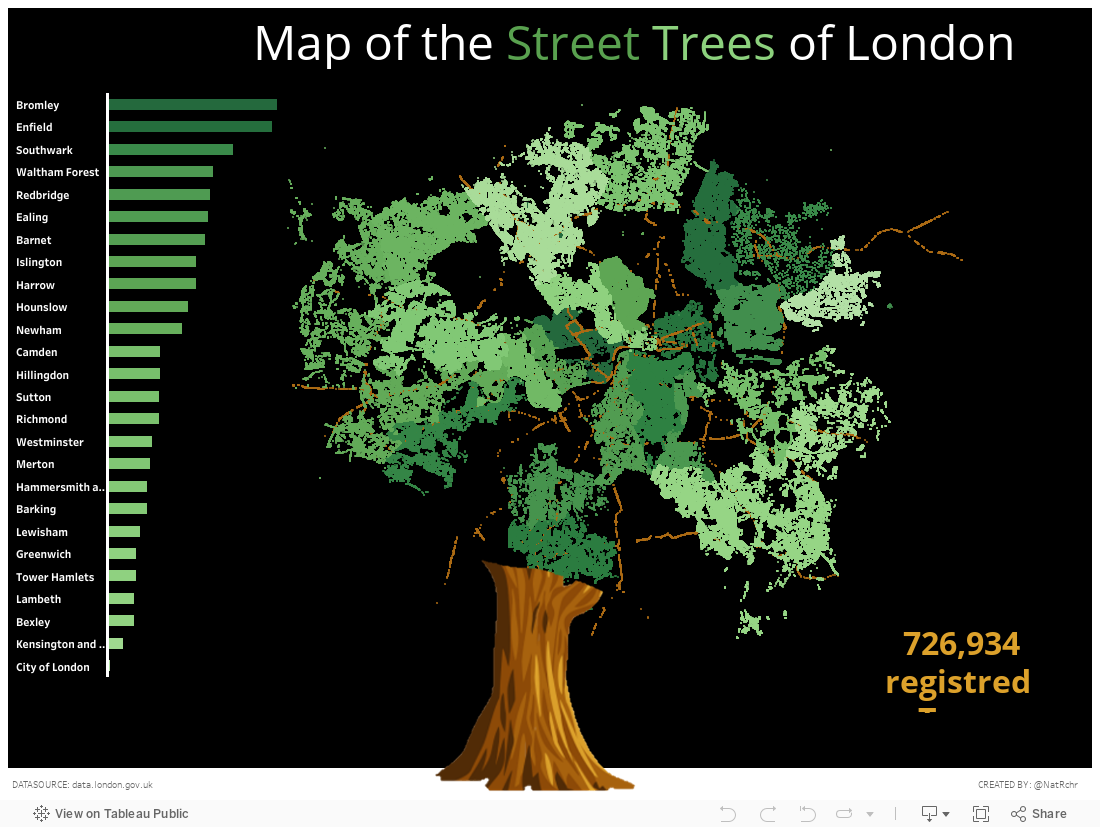
I’ve seen this concept before. The gist of it is that the trees plotted onto a map of London create a representation of a tree itself. It was too interesting to pass up!
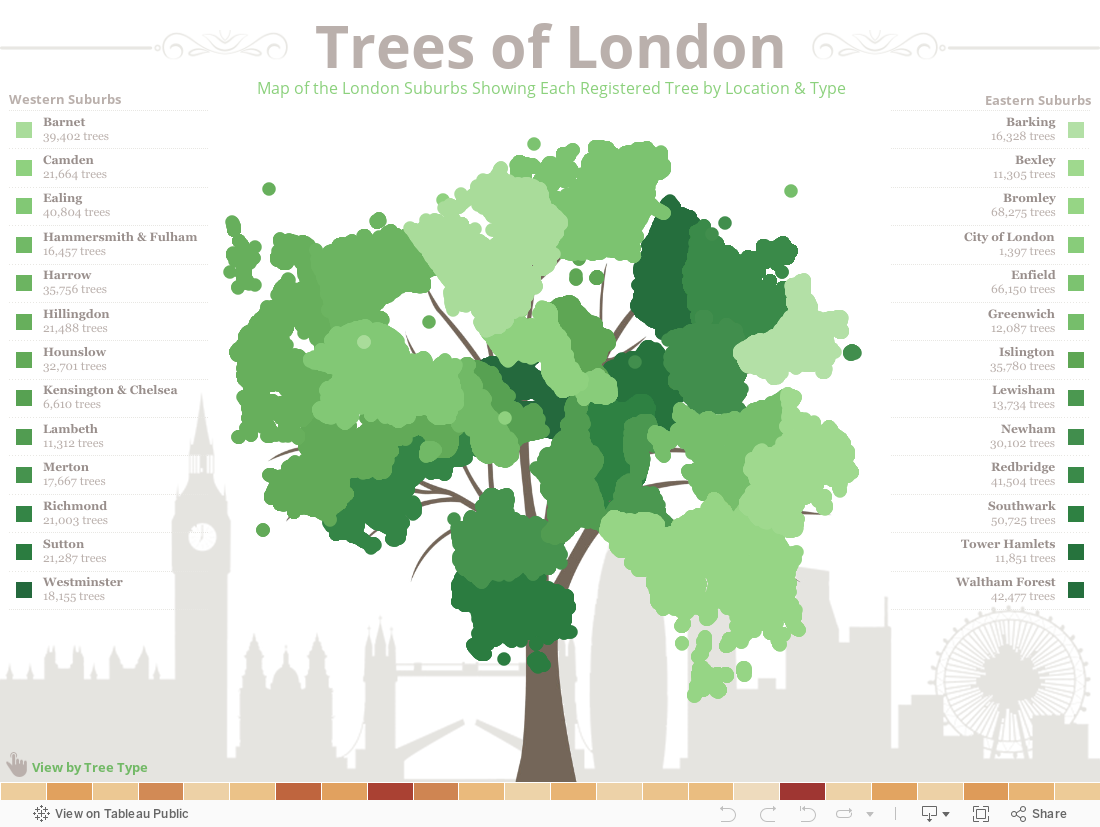
Renovated Version 2
As with every viz, let’s start with the data. The original viz was using latitude and longitude to plot the individual trees, categorized by suburb. That’s all in the original viz. I found that there were other dimensions that might be interesting as well, including a common name for the many different types of trees. I thought it’d be cool to use those different types of trees to complete the image of the leafy scatterplot by making it appear to be the ground from which our tree of London springs forth.
For the tree itself, I felt like we needed more foliage. There are over 700,000 marks in that scatterplot, but as dots, it wasn’t giving me as much of the illusion of a tree that I wanted. So, I made the mark types bigger to give the tree more coverage, as well as a softer shape. With the different types of trees, I made that into a dashboard action, and when you select a particular variety, our tree takes on a different shape. I was quite happy with the effect on the visual.
Finally, I added some design elements around the viz to bring forward the London/British feel with some balance around the scatterplot by dividing the suburbs into lists of East and West. Finally, black backgrounds are very strong. I felt a lighter palette with a white background would have far more impact on communicating a story of green and growing.
Here’s the final result:
A massive thanks to Nat for sharing her work. It was a blast to work on this concept!
Interested in a Viz Renovation?
If you have some visualizations that you would like to expose to a makeover, please let me know in the comments below. I’m aiming to do one of these every month. The only requirement is that your workbook is publicly available (i.e. data is not sensitive), so I can share the before and after on the InterWorks blog and Tableau Public.
And for any Tableau or data needs, remember InterWorks is ready to help! Reach out if you’d like to see our expertise and support applied throughout your organization as a whole rather than just one dashboard at a time.