
A common question we’ve been getting lately is whether Sigma supports multi-layer maps. More specifically, people want to know if it’s possible to display polygons, lines and points on the same map; for example, showing a ski resort boundary while also displaying lift lines and lodge locations inside it.
The good news: This is absolutely possible in Sigma. The key is structuring your spatial data so all geometry types live in the same column using GeoJSON.
In this post, we’ll walk through a simple example and show how to build a multi-layer map in Sigma step-by-step.
Example: Mt. Bachelor Ski Resort
To illustrate the idea, let’s use Mt. Bachelor in Bend, Oregon. In this example, we want to visualize:
- The resort boundary (polygon)
- Ski lift lines across the mountain (lines)
- Lodge locations at the base and mid-mountain (points)
Instead of building separate maps for each layer, we can combine all three geometry types into a single dataset. Each row represents one geometry, either a boundary, a lift line or a lodge location, stored in a single GeoJSON column.
Structuring the Data
The core idea is simple: Every geometry becomes a row in the table.
| Name | Feature Type | Geometry Type | GeoJSON |
| Mt. Bachelor | Boundary | Polygon | {“type”:”Polygon”,”coordinates”:[[[-121.7226,44.0020],[-121.6709,43.9585],…,[-121.7226,44.0020]]]} |
| West Village Lodge | Lodge | Point | {“type”:”Point”,”coordinates”:[-121.6887,43.9790]} |
| Sunrise Lodge | Lodge | Point | {“type”:”Point”,”coordinates”:[-121.6590,43.9915]} |
| Pine Marten Lodge | Lodge | Point | {“type”:”Point”,”coordinates”:[-121.6860,43.9904]} |
| Skyliner Express (chair_lift) | Lift | LineString | {“type”:”LineString”,”coordinates”:[[-121.6673,44.0003],[-121.6803,43.9881]]} |
| Summit Express (chair_lift) | Lift | LineString | {“type”:”LineString”,”coordinates”:[[-121.6729,43.9857],[-121.6859,43.9776]]} |
Each row contains a valid GeoJSON geometry describing a polygon, point or line. Because GeoJSON supports multiple geometry types, different spatial features can live in the same column and still render correctly on a map.
Building the Map in Sigma
Once your data is structured this way, creating the map is straightforward.
Step 1: Convert the GeoJSON Column
Convert the GeoJSON column into Sigma’s geography type using the Geography() function:
Geography([GeoJSON])
Step 2: Create a Geography Map
Insert a Geography element and assign the converted Geography column to the Geography field. Sigma will automatically render polygons as filled regions, lines as path overlays, and points as markers, all on the same map.
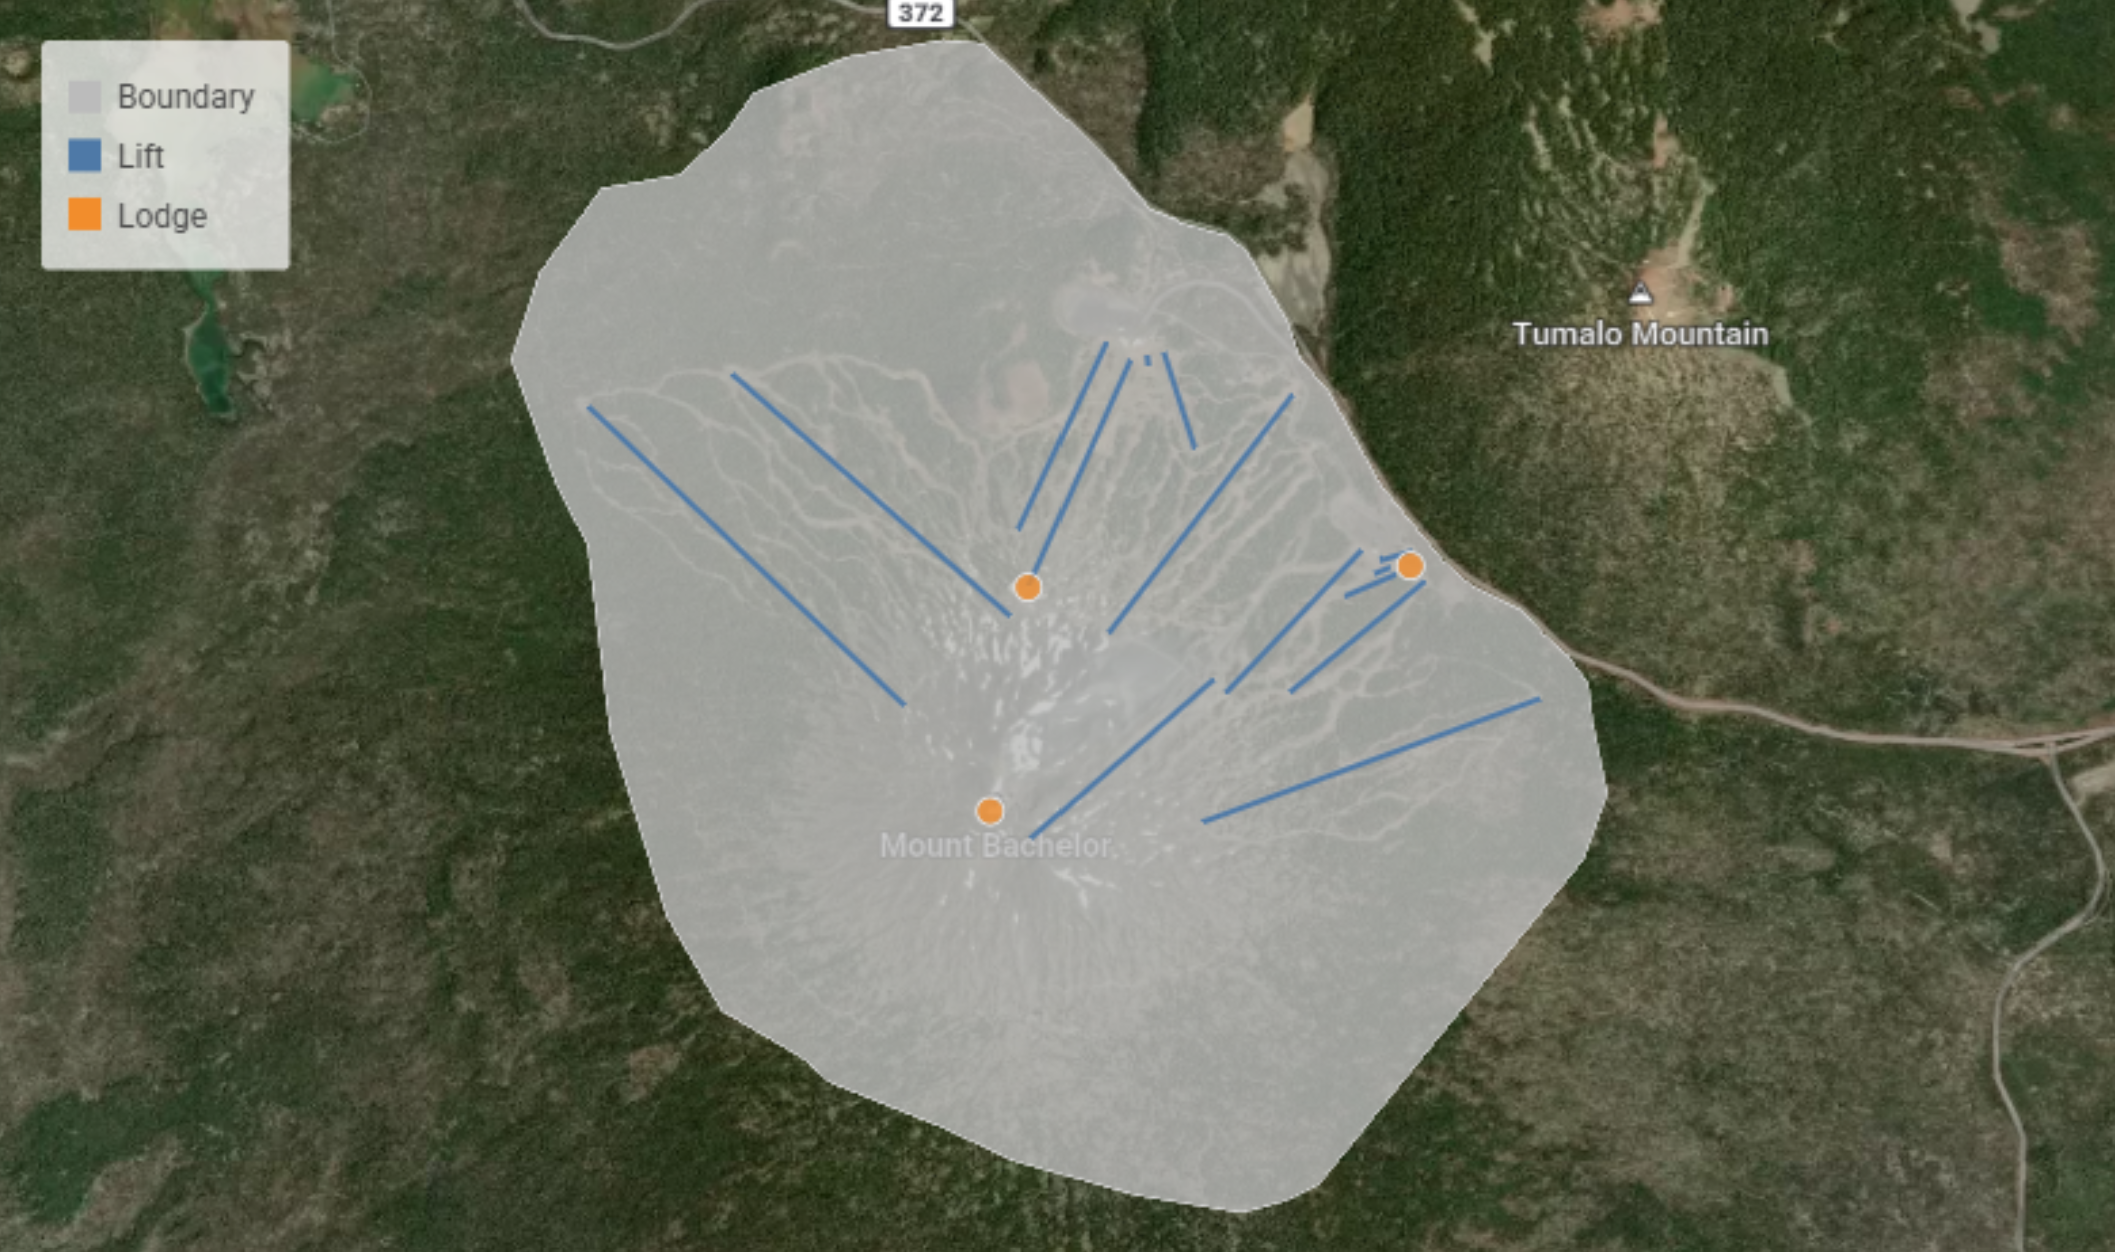
Step 3: Add Styling and Tooltips
From here you can style each geometry type however you like, for example a light grey for the boundary polygon and blue for the lift LineStrings. At this point, your map should look something like this:
Want to try this yourself? Download the sample dataset used in this example.
Why This Works
Sigma doesn’t currently have a dedicated map layer feature. However, by structuring your spatial data so multiple geometries are stored in a single GeoJSON column, you can render polygons, lines, and points together in the same Geography map. See GeoJSON documentation here.
Any time you need to display areas, paths and locations together, this approach keeps the data model simple and flexible.