Going the Distance in Tableau: Dynamically Comparing Different Distribution Centers
In this next scenario, we are going to look at which distribution center is closest to a selected city. This is highly similar to the previous scenario with a change to the setup for the crosstab’s filtering. We need to have a two-level sort similar to the one before, while taking into consideration 1) whether […]
Quantified 106: Communicating Data

It’s episode six, and Will Jones joins the show to share how we communicate data with others. We talk about the importance of understanding your audience, streamlining your message and presenting data in ways that are easy to consume.
Perth Brewalytics Event Debrief
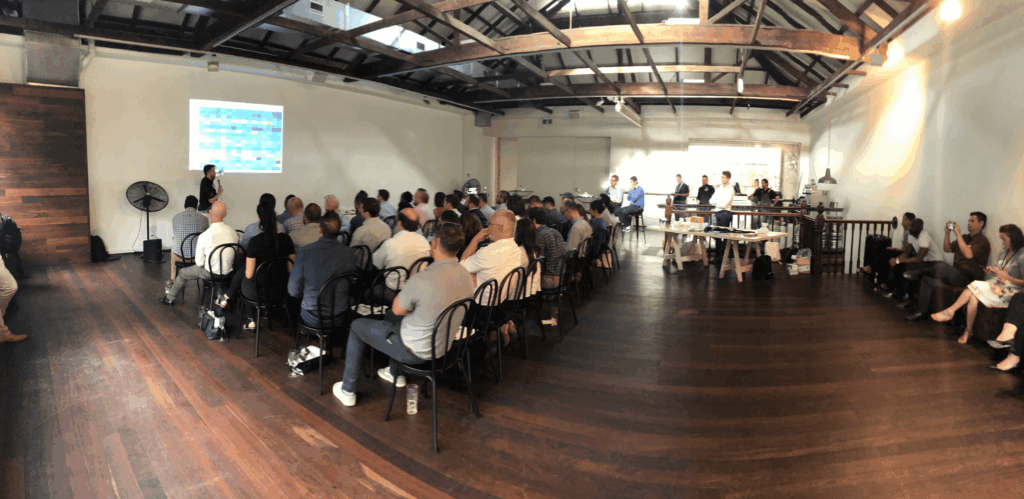
The InterWorks ANZ Team kicked off this year’s first big event with Brewalytics in Perth, Western Australia. This event was run in partnership with Tableau and Snowflake and was attended by over 50 people from more than 25 organisations around Perth. Brewalytics was a great chance to bring together Perth’s data community over a few drinks and […]
Matillion 101: Completing My First Job in Matillion
If you’ve been following along in this Matillion series, you’ve already set up and logged into Matillion. From here, I’m going to talk through the first part of the first job I created in Matillion, leaning heavily on Holt’s recent post about setting up an API profile. Pulling in Metadata to Matillion For my first […]
Spell-O-L: A Data Viz of Hilarious Misspellings
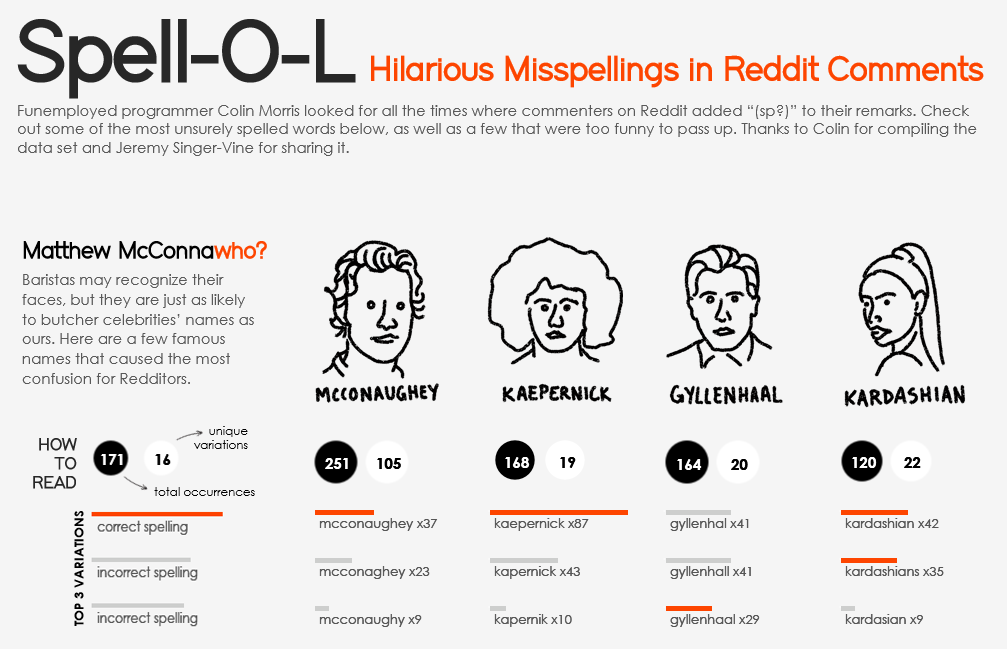
My colleagues and I often joke about how the most interesting visualizations on Tableau Public don’t often have much practical application for the boring world of business dashboards in which we operate. At first glance, my Spell-O-L dashboard is no exception. Telling a Visual Story This visual story about spelling errors in Reddit comments gained […]
A Song of Tableau and Data: Exploring Game of Thrones IMDB Ratings
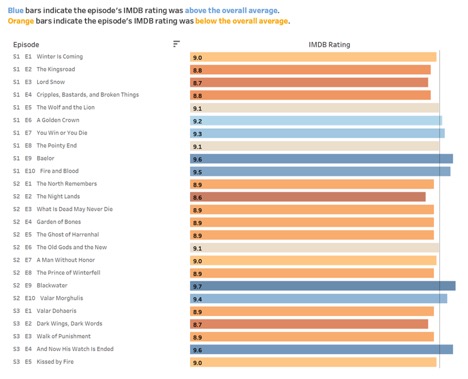
As the masses flock to their couches to re-binge-watch all the episodes of Game of Thrones, salivating for the final season like a pack of ravenous wolves, add this dashboard to your meta nerd repertoire. I Drink and I Know Things When the wine starts flowing and your friends finally take a break from preaching […]
How I Went from Mining Analyst to Analytics Consultant
A Facebook memory popped up today that reminded me that it was exactly one year ago to the day that I joined InterWorks. I don’t know where the time has gone, but what a crazy year it has been: There and Back Again—A Hobbit’s Tale As the post above alludes to, I’d been working on […]
Quantified 105: Data Analysis

In this episode of Quantified, data analysis takes center stage. InterWorks Principal and Analytics Practice Lead Ben Bausili gives us a high-level rundown of what it really means to make sense of your data. We walk through how to use analytics to describe and understand our world and the real-world benefits it offers users when […]
New York State of Mind: Welcome to the Dinner Club

At InterWorks, I am lucky to work with some truly great people. We are accountants, consultants, administrators and more, and we are truly passionate about our work. My colleagues inspire and motivate me every single day. The problem is: I don’t see them all that often! As a remote employee, I do have the greatest […]
PYD80 – Filippos Lymperopoulos on Tableau

Develop. Evolve. Improve. PYD 80 is all about what it looks like to go through the creative process of new-feature generation. Host David Pires welcomes Tableau developer Filippos Lymperopoulos for a discussion on Tableau’s latest and greatest MVP, set actions, and what users can expect in the future.