Travel Made Easy with Tableau Calendar View
Planning a holiday can be quite stressful in its own right. However, when I was planning a recent trip to Asia that involved making multiple stops across many countries, it was even more so! My fiancé’s cousin was getting married in Okinawa, so we decided to make a bit of a trip out of it. […]
InterWorks Named a Forbes Small Giant for 2019

Forbes is a name that’s synonymous with business. Their mission is to recognize the movers and shakers of the world, as well as the practices and trends that keep them moving forward. One intriguing trend being highlighted is the idea that success in business isn’t always rooted in growth. Is bigger truly better, or are […]
Tableau Design Tips: Using Images in Your Dashboards
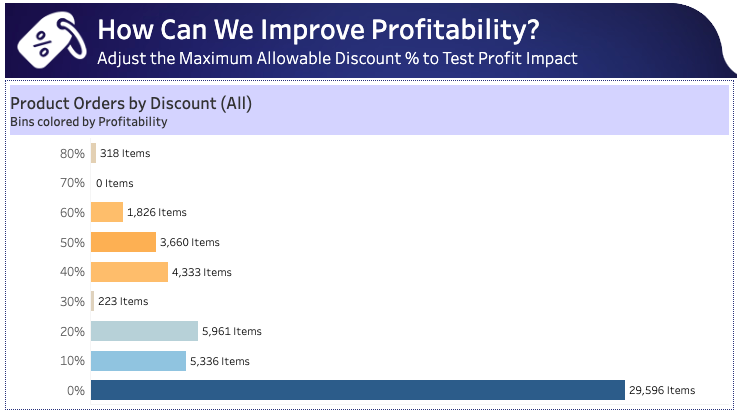
Images on your dashboard, combined with visual best practices, make a huge difference when it comes to the impact of your work. My years of experience as an analytics consultant in Australia have told me that dashboards are judged by stakeholders on four criteria: data, message, performance and look. Surprisingly, look is often what “sells” […]
The Donut Chart in Tableau: A Step-by-Step Guide
Pie charts are one of the most iconic data visualisation styles; in the past, they have been the bedrock of many a PowerPoint presentation. When you start to look a little closer, however, as many data-viz purists have, you begin to notice that they have some downsides. I am not going to go into all of […]
Webinar Replay: Sharing Data Insights with Your Clients – An Embedded Analytics Overview

Your data and the insights you glean from it tell a story. It’s important to make that story as strong and streamlined as possible, but figuring out how to craft that narrative and communicate actionable findings can be a challenge. In this webinar, Analytics Practice Lead Ben Bausili talks about why data matters, how to […]
Webinar Replay: Tableau & Snowflake – A Match Made in Data Heaven
Snowflake and Tableau are tech powerhouses that facilitate the management of ever-increasing volumes of varying data, and we at InterWorks are thrilled to partner with them in creating unique and tailormade data solutions for clients. Want to know how combining these two technologies can help you harness the power of your data? Join Chris Hastie […]
Webinar Replay: Designing Impactful Dashboards

Thoughtful design and intentional timing can make a huge difference when it comes to driving traffic to that dashboard you spent so much time putting together. In this webinar, analytics consultant Brenden Goetz talks through a few of his dashboards that have been recognized as Viz of the Week and Viz of the Day by […]
Advance with Assist: Sheet Swapping with Dummy Headers
Question: I’m trying to use a sheet swap toggle between two chart types, but in the layout container, the sheet is keeping space and not minimizing to the bottom of the screen. Based on the issue and the behavior Tableau was showing, my first assumption was that a fixed height had been selected on the […]
Portals for Tableau New Feature Spotlight: Scheduled Reports
Cue the montage… Report Builder 3: All Grown Up You felt things for the plucky new Report Builder feature when it was first released as just an export tool way back in February 2018: In the sequel just a few short months later, you watched as it got on the bus for its first day […]
Quantified 107: Data Students

Today we wrap up season one with the final episode of Quantified. Our topic? How can we be good students of data and what are the steps we can take to start out our data journey right. Please welcome back InterWorks training lead Katie Wagner to help us navigate our way.