
Tableau 2018.2 brought us a few new features, including the Services Manager, spatial data join and Dashboard Extensions. All of these features are neat and handy for their relative use cases, but today we’re going to focus on Extensions. Dashboard Extensions allow you to add some third-party functionality directly into your dashboard. There’s already a host of Extensions from several parties available for use that can be found in the Extension Gallery. The one we’ll highlight today is Wordsmith by Automated Insights.
Intro to Wordsmith for Tableau
The idea behind Wordsmith is adding insightful narratives to your Tableau visualizations that are constructed with natural language generation. Ideally, this frees up analysts to do more important tasks than writing up assessments and findings from data visualizations. You can set up Wordsmith directly in your Tableau dashboard, design the narratives you would like to be generated, begin selecting marks and watch the magic happen. The ability to customize your templates is a great feature because it allows you to use language relative to your company, compared to some “black-box” software out there that set up the templates for you (not to mention this is the only language generation Tableau Extension currently).
Wordsmith Template customization is broken down by three components: data, synonyms and branches. Data is simply the data from the mark you selected. When you select a mark, Wordsmith can see the whole row of data behind that mark so long as it is within the sheet. A trick I used was including all the data I need in the tooltip. After playing with the tool for some time, it does seem that Wordsmith can only see the row that generates the selected mark. For instance, if you wanted to compare profit from two different months, those two months of data need to be included on the same row. This can certainly be limiting, but some quick table manipulations or calculations can fix the issue.
Another component that allows for dynamic templates is the synonym feature. You can select a word, phrase or block of narrative and provide other options that Wordsmith will randomly select each time language is generated. An easy example would be creating a synonym for “large” that includes “significant” and “sizable.” Each time the narrative is generated, Wordsmith will choose between those three to use. This creates an experience that the narrative is being written by a human in real time. Scale that up by creating synonyms for phrases or blocks of sentences that rearrange words and where data is cited, and the natural language generation really comes to life.
Lastly, there are branches. A branch is a structure that will choose different text to display based on conditional logic. Say you’re analysing the change in profit margin per month. A branch would allow you to generate different statements based on whether the change is positive or negative, or even if the change is large or small. Or, maybe you want annual data to be shown when you select the month at the end of the fiscal year. Branches can help there, too.
Synonyms, branches and data can also be nested. You might have two different phrases that contain several synonyms that can be displayed for each result of a branch. Or, you can change the whole structure of the narrative based on which sheet you are selecting data from, which includes its own set of synonyms within branches within synonyms. Ultimately, the more time you put into building out the template, the more natural-seeming your narratives will become.
Our Use Case for Wordsmith in Tableau
Let’s take a look at my use case test for this Extension to show the process from beginning to end. First, I downloaded the Extension file (.trex file) from the Extension Galley. I put it in my Extensions directory under My Tableau Repository, but it really only needed to be easy to find. Next, in my dashboard I pulled the Extension object from the Objects menu at the bottom-left into the view:
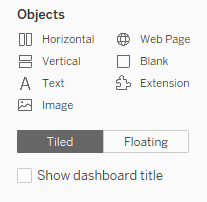
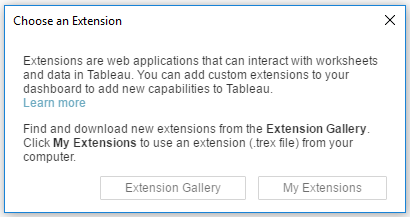
Tableau gave me a quick definition of Extensions and asked if I’d like to download a new one from the gallery or select an already downloaded .trex file:
I navigated to where I saved the “AutomatedInsights_Wordsmith.trex” file and selected it, which plopped it into the dashboard. Next, the Wordsmith setup page appeared where I could either connect my account or choose Get Started that takes you to set up a demo with Automated Insights.
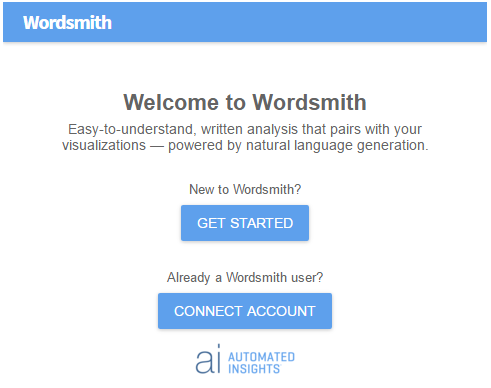
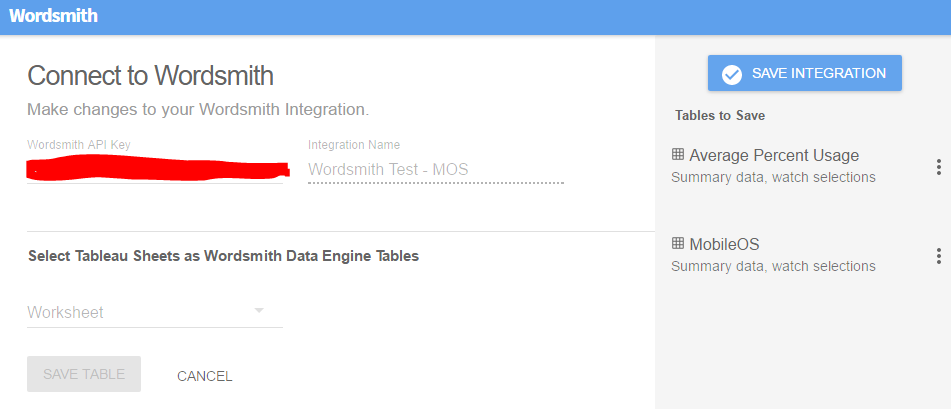
I already had an account, so I chose to connect it. This is where I sat up my Wordsmith integration. I grabbed my API key from my account, named the integration and started choosing worksheets to pull tables from:
After saving the Integration, I chose the Edit Wordsmith Template option from the drop-down menu on the Extension. This is where I began building my narratives to be generated. But before I could generate the narratives, I had to choose my data with Edit Calcs.
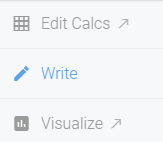
I created one calc per table that simply selected the first row using the First N function:
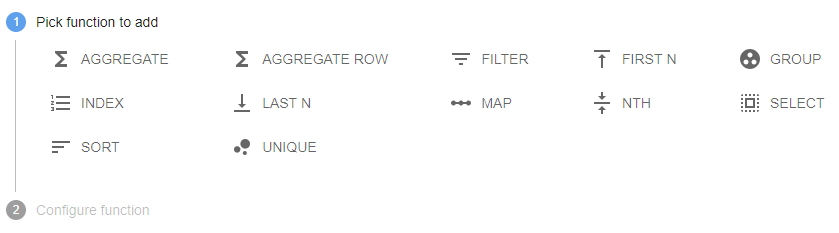
The Wordsmith Extension will use this calc to grab the row of data that is behind the selected mark. This is the most efficient way that I’ve found to get to the data I want. The other functions are useful if you are using Wordsmith with a .csv file or other data source, but the Extension already grabs the data I want so there’s no need to use the other functions.
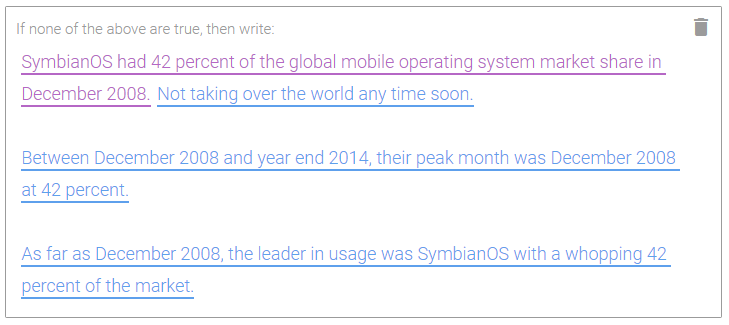
Finally, I returned to the Template and began creating my narratives. I made a few stanzas per selected sheet on the dashboard. I noticed that, by default, Wordsmith will grab the first (left-most, upper-most for a line chart) mark of the sheet not selected, so I made a branch that will change the entire narrative based on that default:
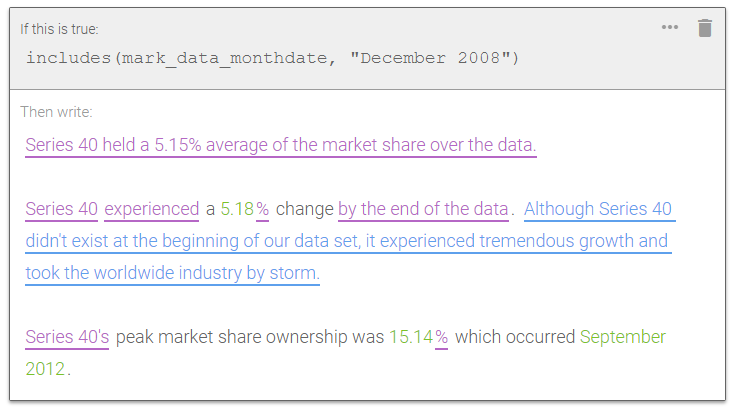
December 2008 in my instance is the earliest date in the data. The purple text in the snapshot is synonyms, the blue is a branch and the green is data. This is just the branch when the conditional statement is true, there is also another branch for if it is false:
If you drill down into any of these branches or synonyms, you can see that I’ve spent time nesting Wordsmith features to make the generated narrative more dynamic.
Now, let’s take a look at the result! This first image is for when I select the iOS mark from the bar chart:
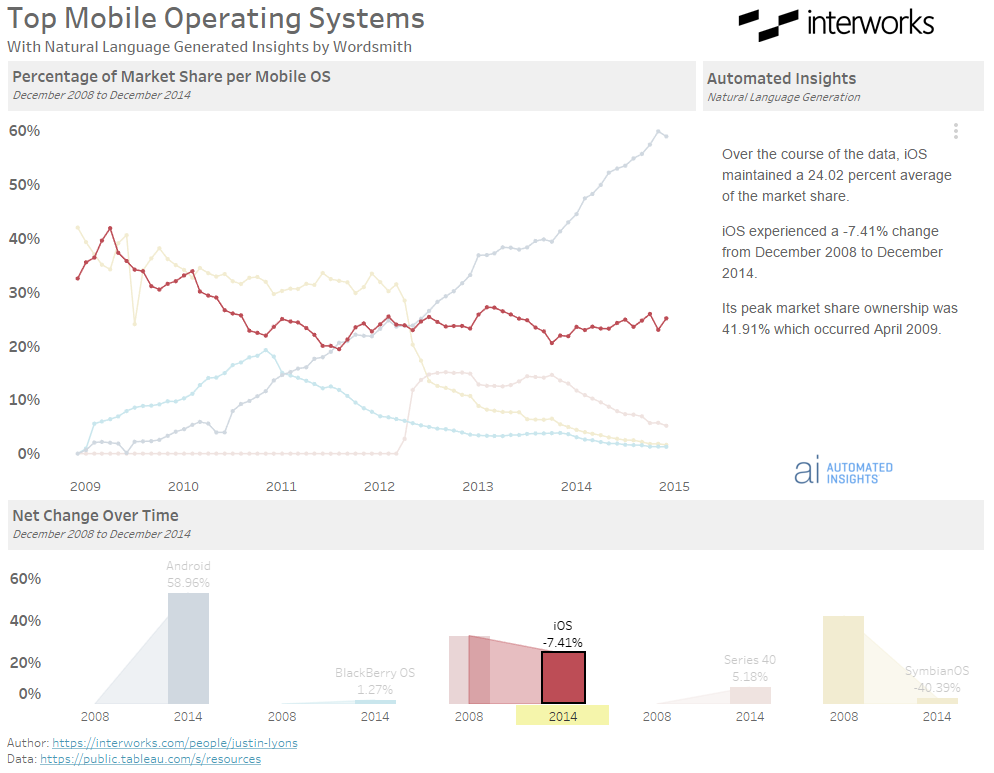
Now to show how dynamic the natural language generation is, I’ll choose Refresh Narrative from the pull-down menu in the Wordsmith pane. Here is the result:

You can see the narrative changes slightly in different places. Some words were switched out for synonyms and some phrases were switched out for other phrases. Next, let’s demonstrate some branches. Below is the dashboard after selecting the BlackBerryOS mark for July 2014 within the line chart:
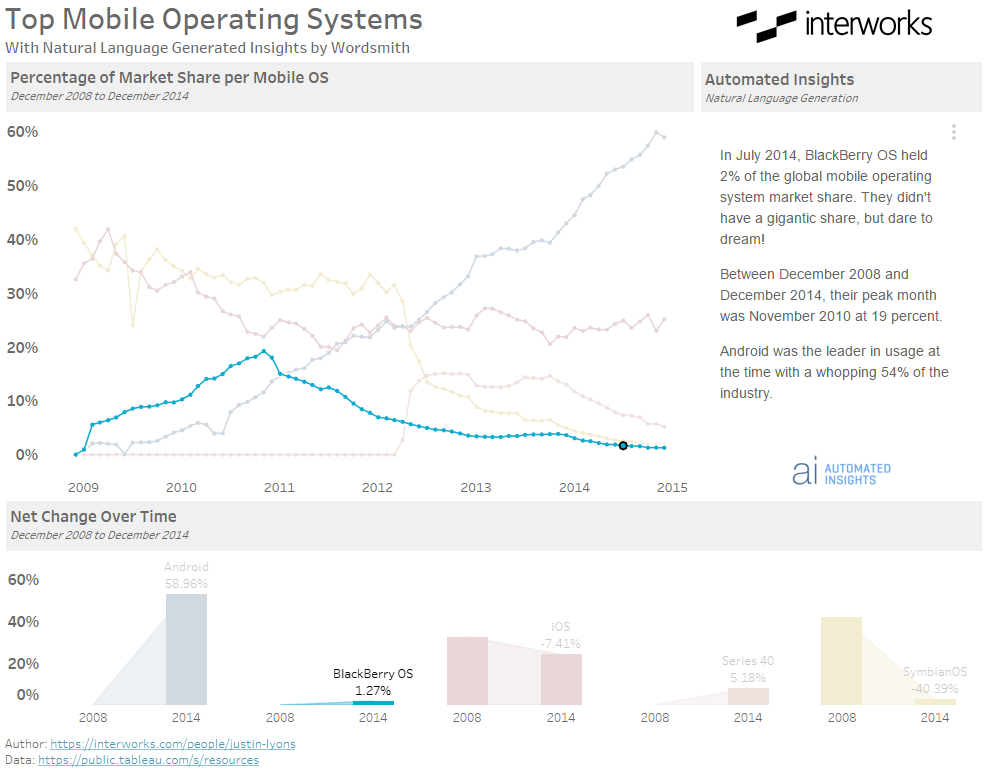
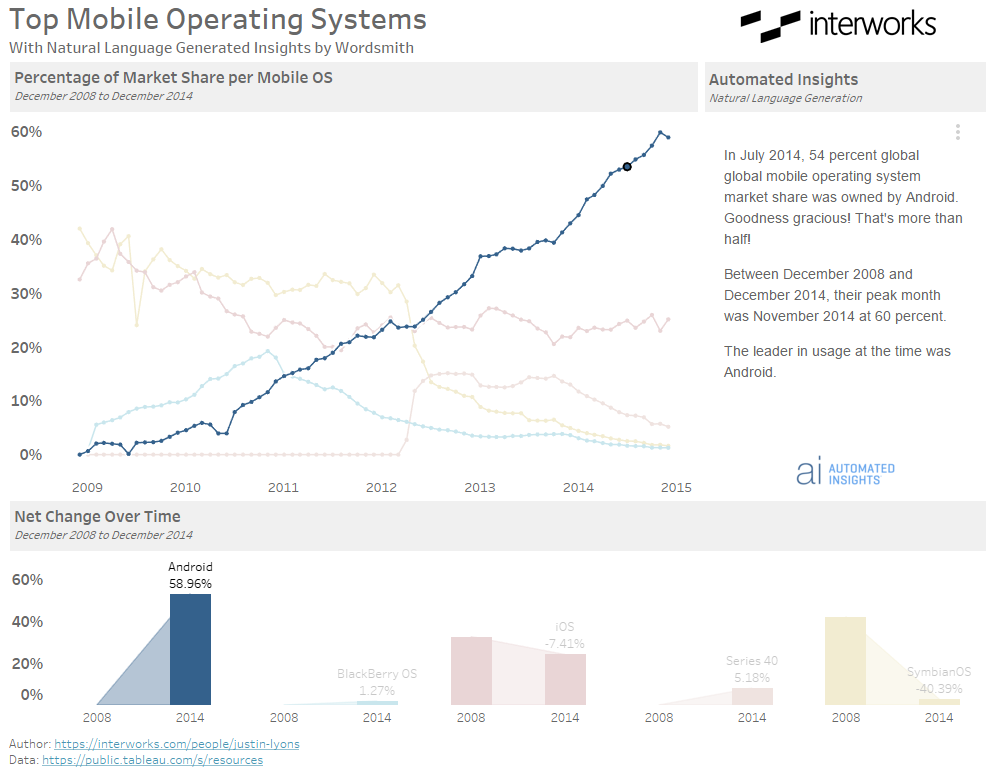
Note that it mentions Android having the highest usage in that month. To include that data in the narrative, I had to add a column that calculated which mobile operating system had the max usage for the given month. Now, look at what happens when I select Android for July 2014:

The commentary in the first stanza was different based on what range the usage falls into. I wrote different commentaries for several ranges of usage. Only when the usage surpasses 50 percent does the phrase “Holy guacamole, Batman” appear! And when I refresh:
And for my last trick, here is what happens when we select the Android mark on the bar chart:
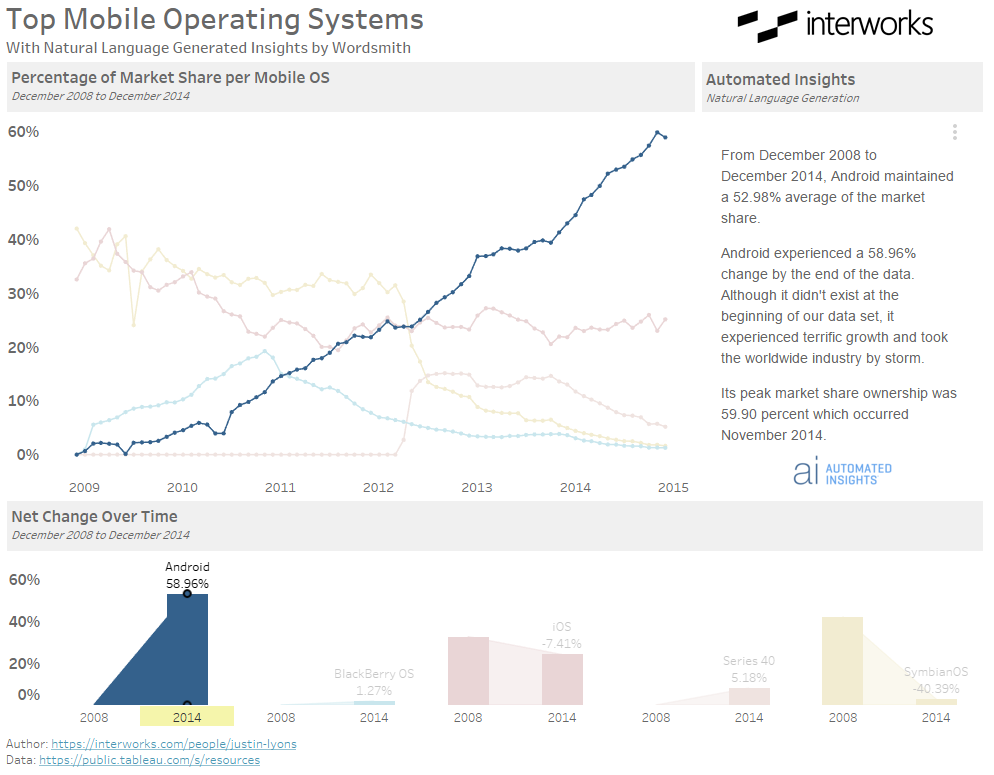
The interesting thing here is that my branch logic allowed the narrative to include that Android did not exist at the beginning of the data set AND that it had a large change in market share. Unfortunately, Tableau Public does not support Extensions at the time this post was written, else I would link you to the dashboard so you could watch in awe as different narratives are produced!
Hit Us Up to Learn More About Wordsmith
We here at InterWorks prefer to make dashboards stylistically in a way that is understandable without needing any narrative to explain it, but there are certainly use cases for this tool. There are many companies (maybe yours) that write summaries of the analysis done on their data to inform business decisions. NVIDIA is a company that had a need for rapid internal reporting and used Wordsmith directly in their Tableau dashboards to produce them without taking any time away from analysts. There are other use cases found on Automated Insight’s website.
If you think Wordsmith is something your company could benefit from reach out to us and we’d love to help!