In 5 Schritten zu Mehrfachauswahl-Parametern
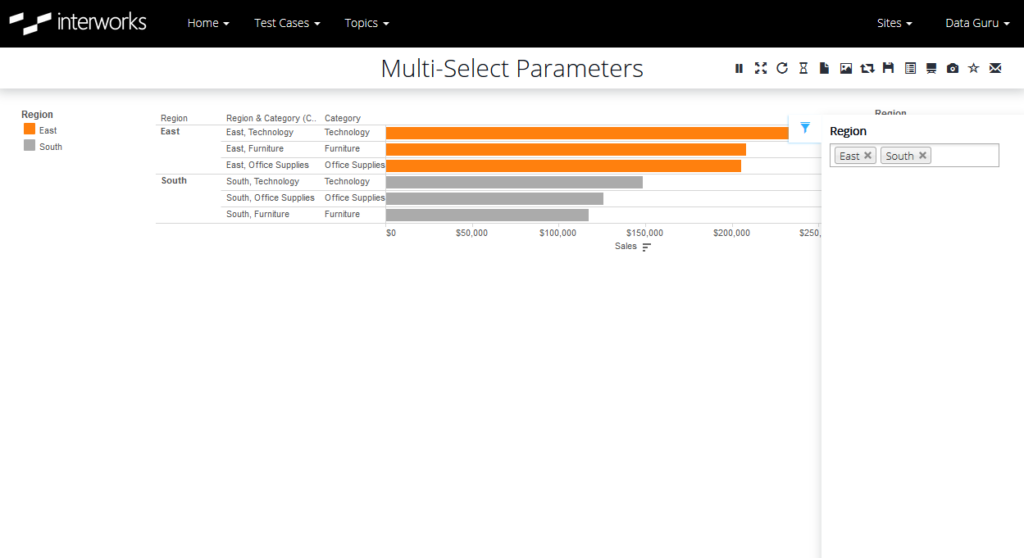
Die Mehrfachauswahl der Parametersteuerung ist ein Feature, das viele Tableau-Enthusiasten liebend gern nutzen würden. Während diese Option in Tableau nicht mitgeliefert wird, haben wir die Mehrfachauswahl der Parametersteuerung in Curator gebaut. Großer Dank und großes Lob an Matthew Orr und das Curator-Team, die das Wirklichkeit werden ließen. Schritt 1: Erstelle einen Parameter Wir erstellen einen Parameter in Tableau […]
Increasing Tableau Server User Adoption: It All Starts with Awareness

Build it and they will come. Well, not always. Unfortunately, people cannot adopt a new tool if they are not even aware of it. So the first question is: how do we make everyone aware of a new tool, and for that matter, what even is “knowing”? Woah, woah woah … Before we get stuck […]
InterWorks Summer Tour 2020: The Great Paper Caper

Last month, we wrapped up our first virtual summit. Think a virtual summit sounds boring? Nothing at InterWorks is ever boring. You can read more about how our incredible team pulled off a virtual summit in record time, providing tons of professional development and increased team unity here. The Value of Paper Planning During the […]
Embedding Tableau in Salesforce with the Lightning Web Component

Since Salesforce purchased Tableau in August last year, the Tableau community has been waiting with bated breath for news about how the two market-leading platforms can exist and advance together. Salesforce has made it clear they want to accelerate Tableau’s mission “To help people see and understand their data.” Tableau and Salesforce have both made […]
The Analytics Revolution: Old Stack, New Stack and Best-of-Breed Solutions
Over the last 40 years, we’ve seen a revolution in data analytics, starting with the invention of SQL and the Relational Database by IBM in the late 1970s, the advent of the personal computer (also IBM), the spreadsheet (Lotus 123), the internet protocol, web browser, NoSQL databases and data lakes. Then things moved onto more […]
Going Deep with Tableau Tooltips: Background Formatting
A common irritation with tooltip formatting in Tableau is that there is no way of changing the background colour of the tooltip. So, if you have changed the background colour of your sheet to something other than white, the tooltip will be jarring against it: Using a viz in tooltip, we can keep formatting consistent […]
Increasing Tableau Server User Adoption: Overview

Wouldn’t it be nice if having a great product was enough to get everyone to use it? And maybe even good enough to have everyone use it in a cohesive, organised manner? So nice. But, alas … you’re here reading this because you live in the real world and need to figure out how to […]
Tableau’s New Data Model: Physical vs. Logical Data Sources
With the recent release of Tableau Desktop 2020.2 came the introduction of a brand-new data model. In versions prior to 2020.2, users would define joins and unions between physical tables in which Tableau would create a singular, flat table for analysis. Beginning with Tableau Desktop 2020.2, Tableau introduces relationships and splits tables into logical and […]
Mapping Wildfires in Tableau with Online Web Map Sources
It is late summer 2020, and I, like many others on the West Coast, am currently surrounded by wildfires and glued to various online web maps showing the various states of the world burning down around us. Here in Portland, I have the Clackamas County Wildfire Evacuation Zones on constant refresh as to view not […]
Going Deep with Tableau Tooltips: Adding Images
Bringing an image into a tooltip can be a great way to show additional information in a visually interesting way without overcrowding a dashboard. It could be used to bring in a picture of a product, branded logos or icons to help your viewer link together different pieces of info in a dashboard. Contextualizing Tableau […]