Calculated fields are a staple of almost every workbook I create. There’s always a need to add a field to the original set of dimensions or measures to either enhance a visualization or to add powerful analysis on the fly without having to re-write the original data set.
Here’s an example often used in the training courses:
Suppose you want to do some fancy “what if” analysis and set up a parameter to show differing percentages of sales increases. Pretend you’re a sales representative, and your boss has just given you three or four percentage increase targets to hit. You know what your current Actual Sales are, but you want to see what number you’ll need to hit if you increase by, say, 10-25%. I don’t know about you, but doing that kind of math in my head gets old really quickly!
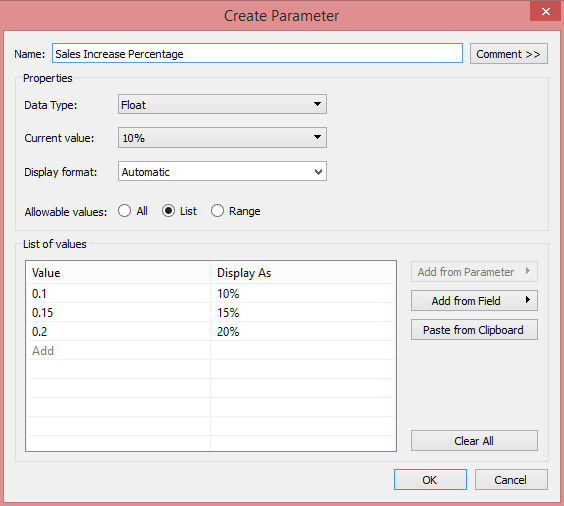
To make it easier on yourself, you create a parameter with the different increase amounts that Mr. Head of Sales has provided for you, and it looks something like this:

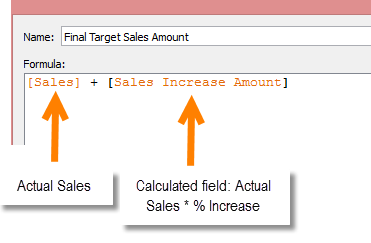
Then, you use that parameter in a calculated field so that you can see the dollar figure associated with it (based on your current Actual Sales):

Awesome! As a final step, you add the newly-created Sales Increase Amount back into your Actual Sales value in order to find out the target number you want to hit.

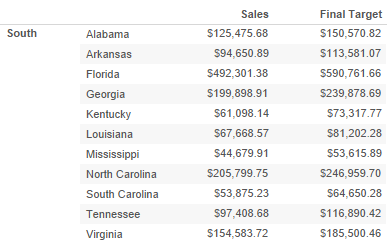
This Final Target Sales Amount is what you’ll be using in your view as it is the number you have to hit in order to get that KPI prize. In Sales, that’s usually a cruise or a trip to Vegas or something super cool that you’re absolutely going to want. Here’s what that final visualization might look like:

It’s not fancy, but it shows me, supposing I’m the Regional Sales Manager for the South, that I need to hit $116,890.42 in Tennessee if I’m going to make my KPI at a 20% increase.
So far, nothing’s happened to make us shout out the title of this post: “I Hate When Tableau Does That!” Well, read on my friends …
Suppose you now decide to do one of the following:
- Refresh your extract, if that’s what you’ve been using
- Replace your data source, which you might do if you’re building a visualization based on a development database before connecting to live data
Here’s what you’re likely to get if you do either of those things. Then, I assure you, you’ll be doing some hollering.

Gaaah! What in the world?
Here’s what happened …
We created two calculated fields. One takes our Sales and multiplies it by our parameter to dynamically generate an increase sales amount (in our example, this is the Sales Increase Amount calculated field). Then, we used that calculated field in another calculated field to get the final result (the Final Target calculated field). The trick of it is, we only used the Final Target field in the view.
When we refreshed our extract or replaced our data source, Tableau is all, “I have no idea what that interim calculated field was, so I’ll just make up some name for it and let you figure it out.”

I hate when Tableau does that.
How do we avoid this Issue? Let me count the ways. There’s only one so it won’t take long.
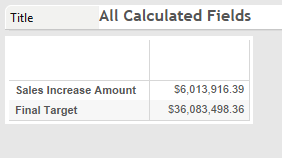
Before you replace a data source, take a minute and create a new worksheet that uses all of your calculated fields in a view. It doesn’t have to be a pretty view, and it doesn’t have to make sense; no one will see it but you. In our example, here’s what it might look like:

This way, Tableau is using both of our calculated fields in at least one view based on the data source.
Now, when we replace or refresh our data source, Tableau will know what in the world we’re talking about. This means that going forward, you won’t have to use the title of the blog post at all!
Just sayin’.

