Next week, Alteryx is kicking off their annual Inspire event. We’re excited to be in Boston to talk to people about the amazing things you can do when combining the power of both Alteryx and Tableau. But, while we’re there, we will definitely be checking out Boston.
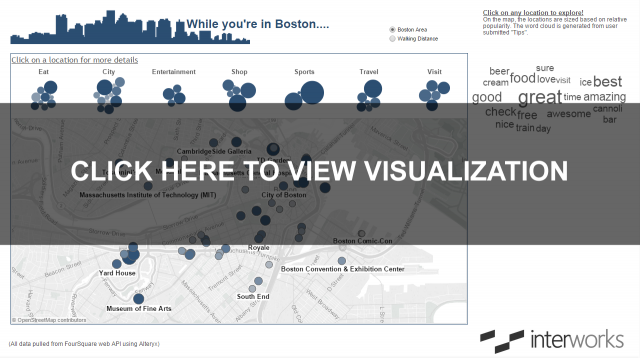
So, why not do both? We’ve created a dashboard in Tableau to help us decide where we should go while at the conference. Check it out below or download the attached workbook at the end of this post. There is a map of locations either in the Boston area or near the Alteryx Inspire location. You can click on a location to see what other people have said about it, and you can even see other locations that people are likely to visit after the location you’ve selected.
Click on the image below to view the visualization:
How I Made It …
My favorite thing about using Alteryx and Tableau together is the way they complement each other so seamlessly. I was able to pull data from a web-based API and form it exactly how I wanted it using Alteryx. Then, I was able to explore the data and make it into a sleek interactive dashboard using Tableau.
Getting the Data
First, I had to get the raw data. In this case, I used the FourSquare API, because they’re a bit more open-minded than other location data platforms. And, it just so happens that Alteryx has a pre-made module to download FourSquare data. All I had to do was request a private key and input it into Alteryx. In this case, I had to tweak the macros to perform multiple types of searches, but all it required was right-clicking on the module and making small changes to the macro.
The Word Cloud
The tips from other users comes in as free-form text. To build the word-cloud in Tableau, we had to do a couple of things:
- Strip out any punctuation
- Make everything lower-case
- Convert multiple words in a row to a new row for every word
- Remove out any common, useless words (the, they, and, etc.)
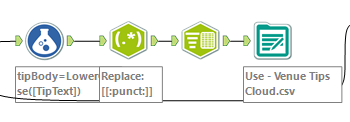
The first three steps were accomplished using Alteryx. I used the Regex tool to remove the punctuation. I used a simple formula to make everything lower-case. I used Alteryx’s Text to Columns tool to accomplish the third step. In this case, I changed the configuration to split to rows instead of columns.

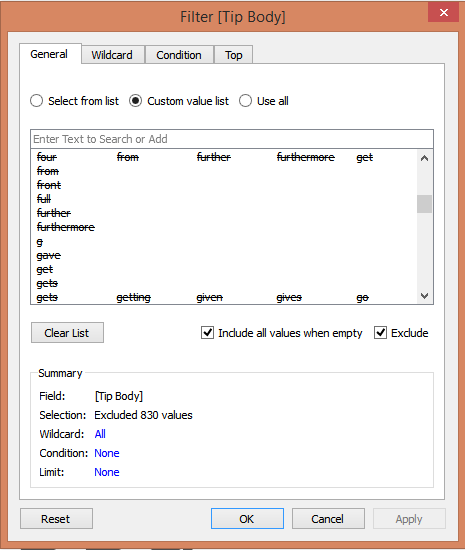
Once I had my data set the way that I wanted it, I still needed to remove out any of the common (but useless to me) words. In this type of activity, those are known as “stop words.” I could have removed those in Alteryx, but there’s also an extremely easy way to remove them in Tableau. I googled around until I found a decent list of stop words. Then, I copied them to my clipboard and pasted them directly into Tableau’s Custom Value List filter. This is an under-used method of filtering, but it’s extremely handy. In this case, I checked the Exclude box in Tableau to exclude any of the stop words.

After that, all I had to do was build the dashboard in Tableau, and we all know how easy that is. I won’t personally be at Alteryx Inspire this year, but InterWorks definitely will be. Come by our booth, check out this module in person and talk to some experts. Have fun!


