It doesn’t matter if you’re a data guru, Tableau newbie, Zen Master or love to spend time with interesting people in the Tableau Community, attending a Tableau User Group is time well spent! Find your nearest one and we hope to see you there!
June TUG Updates
David Pires, winner of the inaugural European Iron Viz contest, demonstrated his winning visualization. As always, it was a great pleasure to see how David can clearly communicate his message in a beautiful manner. This time he answered the very hot question: is the UK getting warmer? You can see his viz here.
When Tableau Chief Product Officer Francois Ajenstat presented new features of Tableau Desktop and Server, I couldn’t hide my excitement. A few highlights from his presentation:
- Smart Analytics: Tableau will recommend data sources
- Enterprise deployment flexibility: The possibility to downgrade and publish to an older server version
- The ability to comment on a viz within Server where it’s been published
Watching Francois on stage demonstrating what’s coming out next in Tableau was hypnotic, to say the least.
Completely different emotions were evoked by Tim Ngwena and his presentation on quantified self. He shared amazing vizzes on what you can track using your phone. Also, he showed what your phone and Google know about you and the results were scary! Don’t be surprised to find out more than you would expect. Check out his blog and videos for inspiration, awareness or in case you need some data to analyse.
July TUG Updates
The July Tableau User Group was hosted by Chief Marketing Officer Elissa Fink and Andy Cotgreave, Tableau’s Technical Evangelism Director, Magician and Co-Author of “The Big Book of Dashboards”. You surely know their names and, of course, you’re jealous if you missed out. However, both presentations can be found here. You’ll also find videos, photos and other materials from previous events.

Elissa Fink shared how to successfully drive technology adoption and changes. Implementing change is never easy and this presentation showed a few insights on how to succeed:
- Product should be remarkable
- Offer flexible education options
- Build community and let people learn from each other
Elissa is a great storyteller and I definitely recommend watching her recorded version.
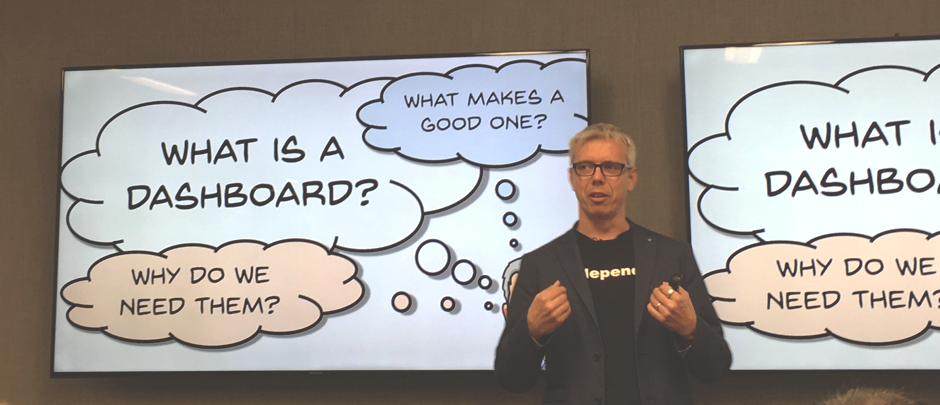
Andy Contgreave started his presentation by creating a 4×4 magic square. Each cell contained a different integer and the sums of each row, column and diagonal were equal to the age of a randomly chosen person from the audience. As an author of “The Big Book of Dashboards,” Andy brought lively discussion about dashboards and shared some interesting and funny details about the creation of the book.

The next London Tableau User Group will be in September. Sign up on the Facebook page so you won’t miss out!
See you there!


