
This blog post is Human-Centered Content: Written by humans for humans.
When I first joined InterWorks, I dove straight into Sigma. My first project was building a revenue forecasting app, and more recently my client work has been centered around Sigma development. However, my role here at InterWorks includes continuing to maintain subject matter expertise in Power BI to support clients in the Microsoft ecosystem, so I find myself hopping between both tools throughout my day. As I learn more about Sigma and am constantly translating functionality back into Power BI terminology in my head, I thought I’d turn that process into blog series.
The idea: Teaching Sigma to a Power BI developer.
Preflight checklist:
✅ You are generally familiar with Power BI terminology
❌ You must be a hyper-technical engineer to follow along
✅ You want to keep tabs on modern tools beyond Power BI
Whether you’re working at an organization fully standardized on Microsoft, evaluating modern BI platforms or simply trying to understand Sigma’s growing momentum, this series is for anyone curious about transitioning from Power BI to Sigma.
Comparing Power BI to Sigma Development from 30,000 Feet
If I had to summarize Sigma for a Power BI developer, I’d start here:
- Imagine you are always connected to sources in DirectQuery, without the cost in performance on large datasets. No need to configure refreshes outside your data warehouse, because you’re live. However, you can still see all your row-level data in your model, and are free to fully transform it.
- Data models are effectively wide, de-normalized tables with facts joined to dimensions. Calculations live within one table at a time, requiring deliberate table modeling (i.e. joins) for multi-fact calculations.
- Visualization sits on a grid where objects cannot overlap. While this introduces some rigidity in the design process, it also provides guardrails that lower the barrier to clean design.
- User interactivity is taken to a whole new level, where write-back is native to the tool and simple to configure. Clicks on elements and buttons can trigger multi-step actions with governed if/then logic, calls to stored procedures, APIs and much more.
- Power BI’s relatively clean distinction in tool components get blurred in Sigma. While development often yields a similar step-by-step process to connect to data sources, transform and model them, and build visualizations on top, all of this can happen on the same canvas in Sigma.
This is where I want to focus the start of this series: to build a foundational understanding of Sigma’s basic build components. To explore this further, let’s start by unpacking high-level differences in tool architecture between Power BI and Sigma.
Platform Architecture Comparison
Like all BI tech these days, Microsoft’s Fabric ecosystem is rapidly developing and changing Power BI’s architecture for customers buying capacity licensing. But for this purpose, I’ll focus on what I’d call the traditional Power BI architecture: Power Query connecting to diverse source systems to transform and import data into Power BI, which gets modeled and visualized.
![]()
The above shows a linear, sequential process. Each step is unable to impact those before it, and is blind to those that follow. When end-users interact with visuals in Power BI, they are never actually impacting the data stored in the Table view, nor how it is transformed in Power Query. For instance, a DAX or M calculated column cannot reference results from a report slicer clicked by a user. These layers are deliberately separated.
Additionally, Cloud Data Warehouses (CDWs) are optional in Power BI. Legacy BI tools like Power BI thrived on their diverse data connectors, allowing developers to access disparate data sources and centralize them within the tool. For organizations not utilizing Fabric capacity for their warehousing, a data warehouse is treated largely like any other data source in Power BI. Connect to it, extract data with Power Query and import that data into Power BI.
Contrast all of the above with Sigma:
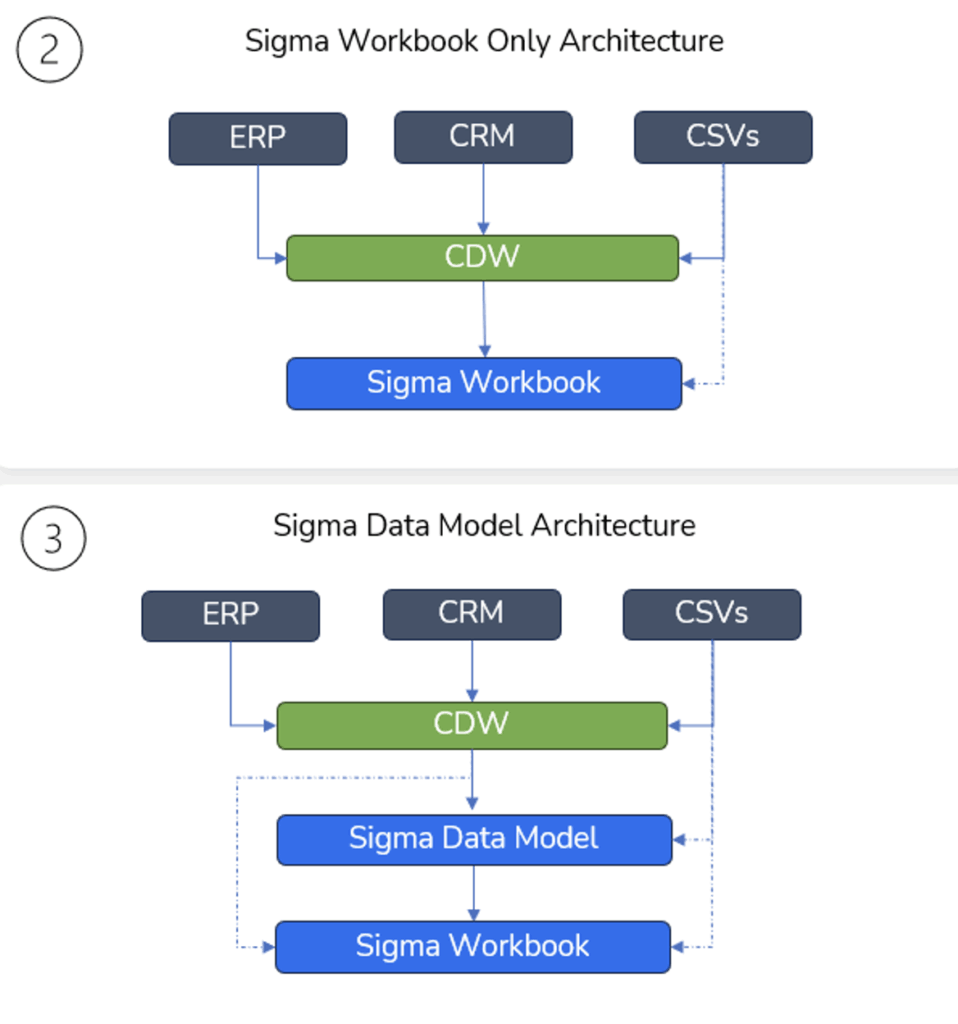
In Sigma, the CDW is foundational to the tool. Not only is it used for storage, but also compute. Data never lives in Sigma — Sigma merely compiles its elements into SQL queries passed back to the warehouse to execute on data stored there.
Additionally, notice the absence of dedicated layers for ETL, modeling and visualization. Sigma compresses legacy BI tool layers into one, where visualization and data transformations are free to coexist. Diagram 2 is the most extreme, where essentially everything happens in one canvas in a Sigma Workbook. Diagram 3 shows the optional addition of a Data Model, which I’ll cover further in another blog.
To make this more visual, see the example Sigma Workbook page below:
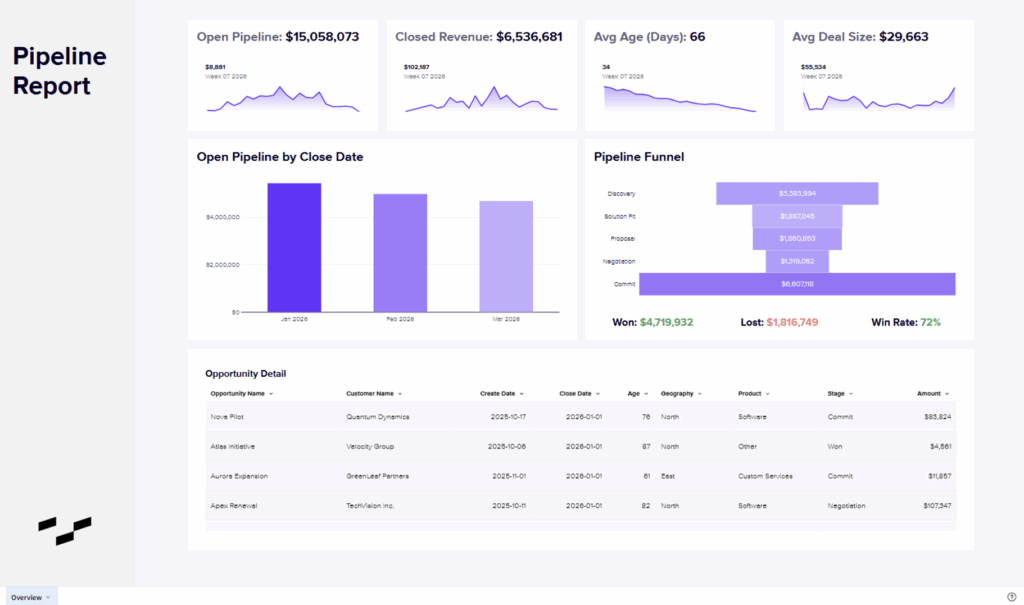
This is a relatively simple example used to illustrate how a single Workbook page can represent what would be multiple layers in Power BI.
The “Opportunity Detail” table at the bottom of the page is connected directly to a table in Snowflake. In this table, I added some Sigma calculations, like “Age,” and hid other columns I don’t want presented to end-users. This is live data, and will update with a fresh query to the data in the warehouse any time someone loads the visual. There is no intermediate staging between the warehouse table and visual table in Sigma.
The comparable framing for Power BI would be to imagine the CDW as the back-end model that supports visualizations in the Report view. But then imagine if Power BI’s visuals in the Report view could support additional transformations as though Power Query’s toolset was available on front-end development. Then imagine all calculations utilized Power BI’s visual calculations approach, and you are close to capturing the essence of Sigma.
However, another major paradigm shift is the lineage of Sigma elements, where tables and charts can be parent elements to downstream objects. See the lineage diagram behind this Workbook below:
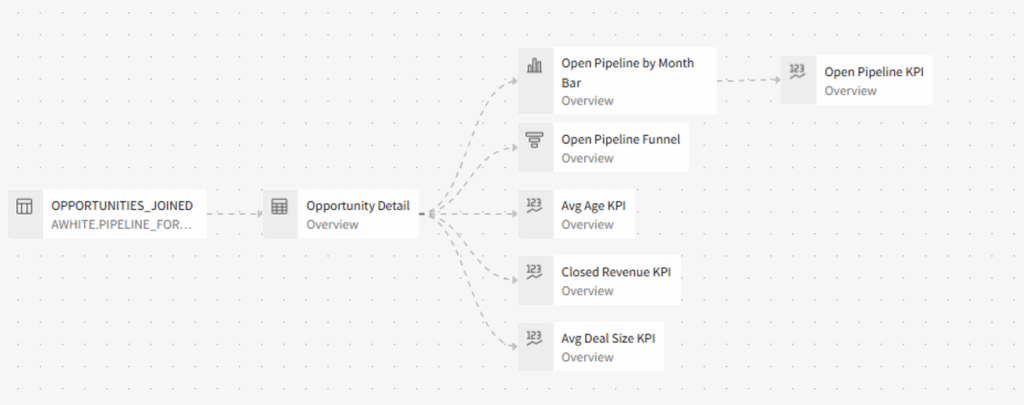
The first object in the lineage is the Snowflake table, which is the source for the “Opportunity Detail” table visual discussed above. The rest of the visuals on the page are sourced from that “Opportunity Detail” table, except for one KPI that I sourced from a bar chart just to show what’s possible. It’s almost like nested DAX calculated tables building on each other, but for front-end visuals. There isn’t truly a fair Power BI comparison here.
Sigma is incredibly flexible, allowing developers to set up Workbooks in countless ways. I could have connected each visual directly to the Snowflake table, or created many more layers of transformational steps between elements. Most of these in-Sigma architectural decisions come down to development efficiency and maintainability, because at the end of the day the SQL generated by Sigma largely looks the same. The visuals at the end of the lineage are still directly querying the Snowflake table, not the “Opportunity Detail” element. However, by nesting them with this parent/child structure, downstream elements can inherit Sigma calculations and transformations to avoid fractured logic.
It is worth noting that creating overly complex lineages can impact Sigma run-time in planning the SQL query it passed to the CDW, slowing down report performance.
Why this Focus on the Compression of the Tool?
So by now you get it, everything everywhere happening all on the same canvas. Why should you care?
This fundamental shift in the tool’s architecture is partially what unlocks next-level user interactivity. Imagine if a user-facing parameter could impact Power Query steps in real time. Virtually everything can be parameterized in Sigma because everything lives together.
For the most part, what ends up happening is not exactly the simple example I shared above where warehouse tables get directly exposed to end-users. It ends up being in some ways a similar process to Power BI development:
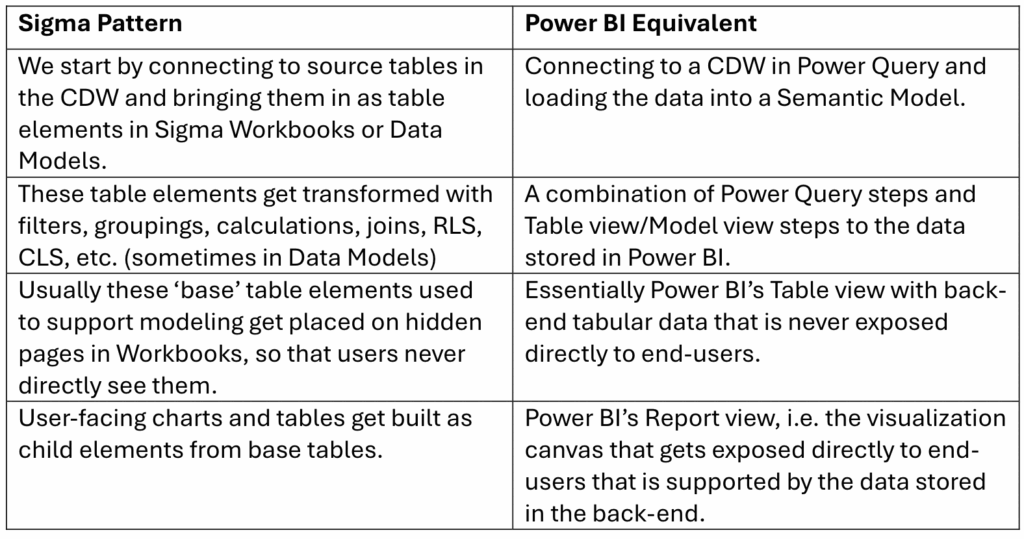
The difference, however, is that none of these steps are actually blind what comes before and after. In fact, Sigma’s architecture is even more cyclical than I showed above.
The Key Differences: Write-Back and Actions
If I update Sigma’s architecture diagrams to reflect the full potential of AI Apps, they would be better represented as a cycle. At the very least, I would add the following:
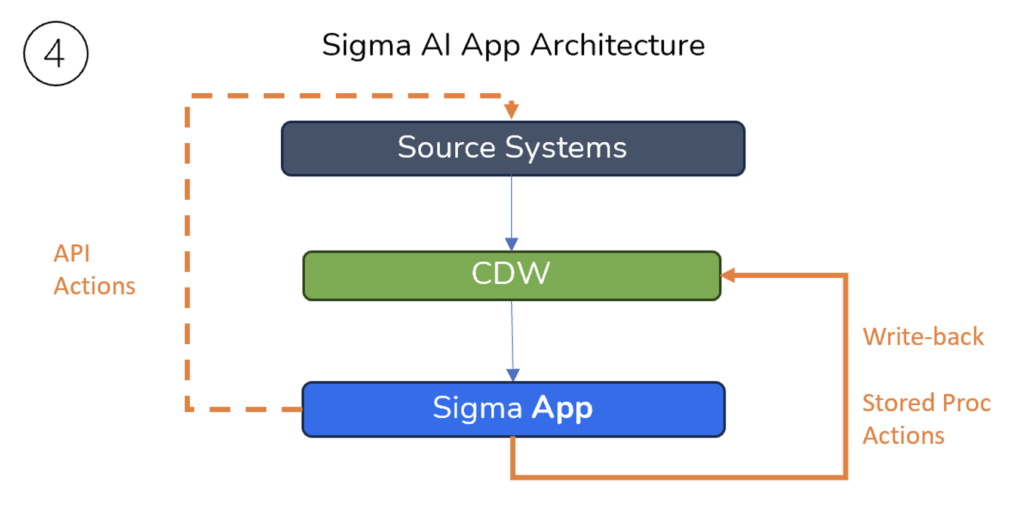
Sigma AI Apps are not fundamentally different objects than Workbooks. Not all Sigma Workbooks need to be an App, but any Sigma Workbook can be considered an App once a certain amount of user interactivity gets introduced.
Write-back creates a cycle to add to data in the CDW before bringing it back into the App. With the addition of API actions, the options to impact source systems further upstream unlocks much more potential. This is why Sigma doesn’t quite fall into the same category as legacy BI tools like Power BI, because functionally it does much more.
But at its core it is still a great BI tool, fully comparable with Power BI.
Conclusion
I will always look fondly on Power BI because it’s what first brought data to life for me. Years ago, as a relatively non-technical analyst, it unlocked a new world of automation, visualization and complex calculations that allowed me to shine in functional roles.
But the more time I spend in Sigma and the more I learn about it, the farther I find myself drifting from my beloved DAX and star schema obsessions. I actually find myself having more fun developing in Sigma. Maybe that’s because it’s new, but I think it’s more because of the creativity it unlocks.
My goal for this series will be to share that excitement, and the insights I find along the way. If you’re already chomping at the bit to get hands on with Sigma yourself, check out Sigma Public where you can get started experimenting for free.