Please note that Portals for Tableau are now officially known as Curator by InterWorks. You can learn more at the official Curator website.
Welcome to our latest Solution Stories blog series, where we delve into real-world client stories that offer valuable insights into navigating and solving everyday business challenges. These stories are often amalgamations of several real clients, merging real-life scenarios with standard, practical solutions.

Meet “Grant,” a diligent data analyst at a prominent organization tasked with delivering comprehensive Human Resource (HR) reports every quarter. His reports were more than just dry statistics – Grant meticulously curated stories about the organization’s staffing trends, headcount and other valuable HR metrics. Grant was a craftsman, dedicating significant time to perfect each report’s styling, formatting and overall aesthetics. His attention to detail did not go unnoticed. The reports were well-received, sparking curiosity and generating requests for more frequent and detailed content.
Initially, Grant designed the reports to be released quarterly, but as they gained popularity, the demand grew. The requests started pouring in: “Could we have this monthly?” “Can we get these twice a month?” “Could you add my content to the deck?” As the rhythm quickened and the content expanded, Grant found himself consumed by collating and presenting the data. His task of compiling information across multiple Tableau workbooks and dashboards became a full-time job, leaving little room for anything else.
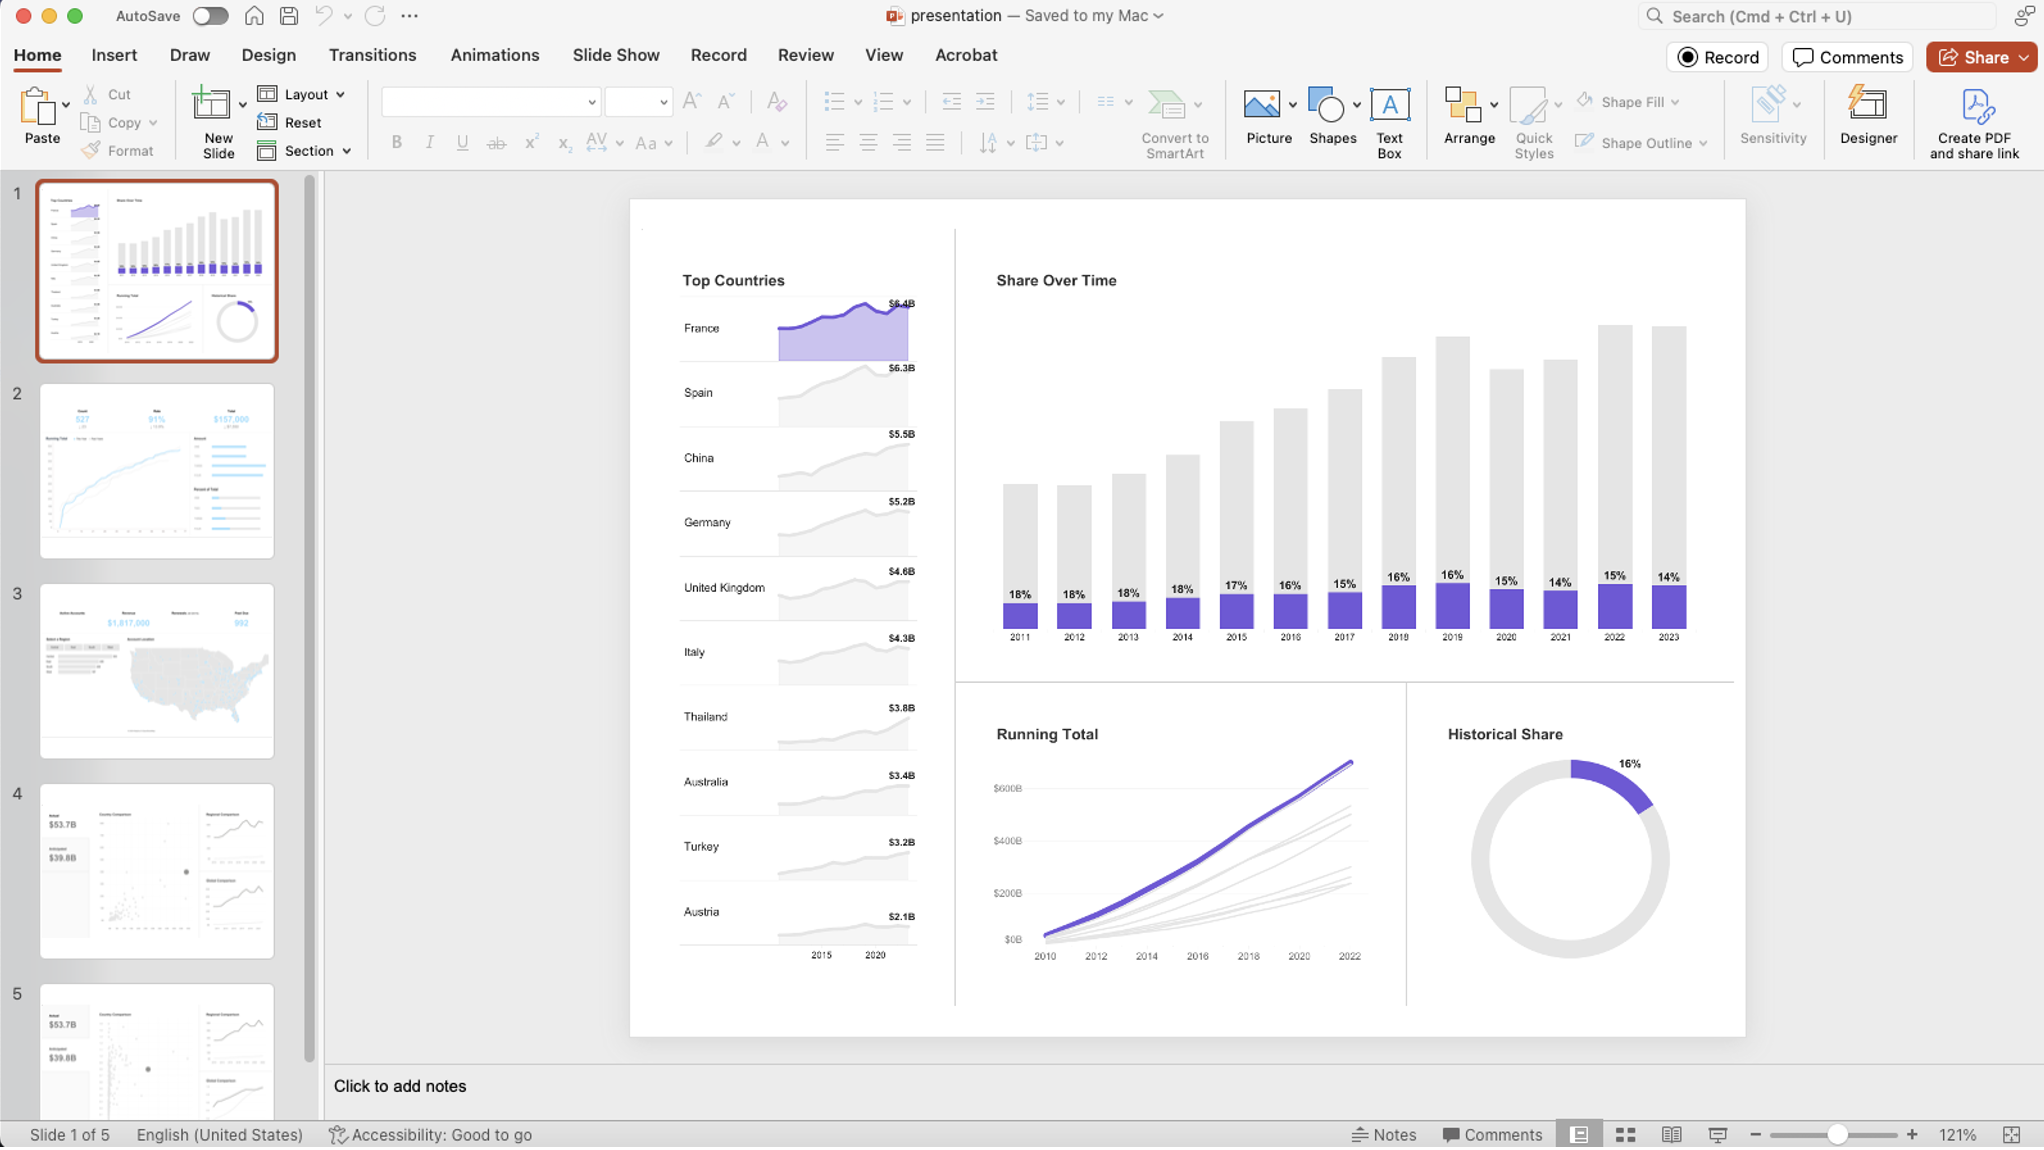
Needing something to change, Grant embarked on a quest for a tool that could meet his needs without compromising the quality of his reports. His search led him to two potential options. The first was Matik, a powerful presentation tool that lets you pull data from multiple analytics platforms to create data-driven presentations. Still, it would require Grant to recreate his reports in PowerPoint, which would require a lot of work, and it would provide a solution to the demand for users to add their own existing reports to the presentation. The other was Curator’s Report Builder, which seemed better suited Grant’s unique situation:

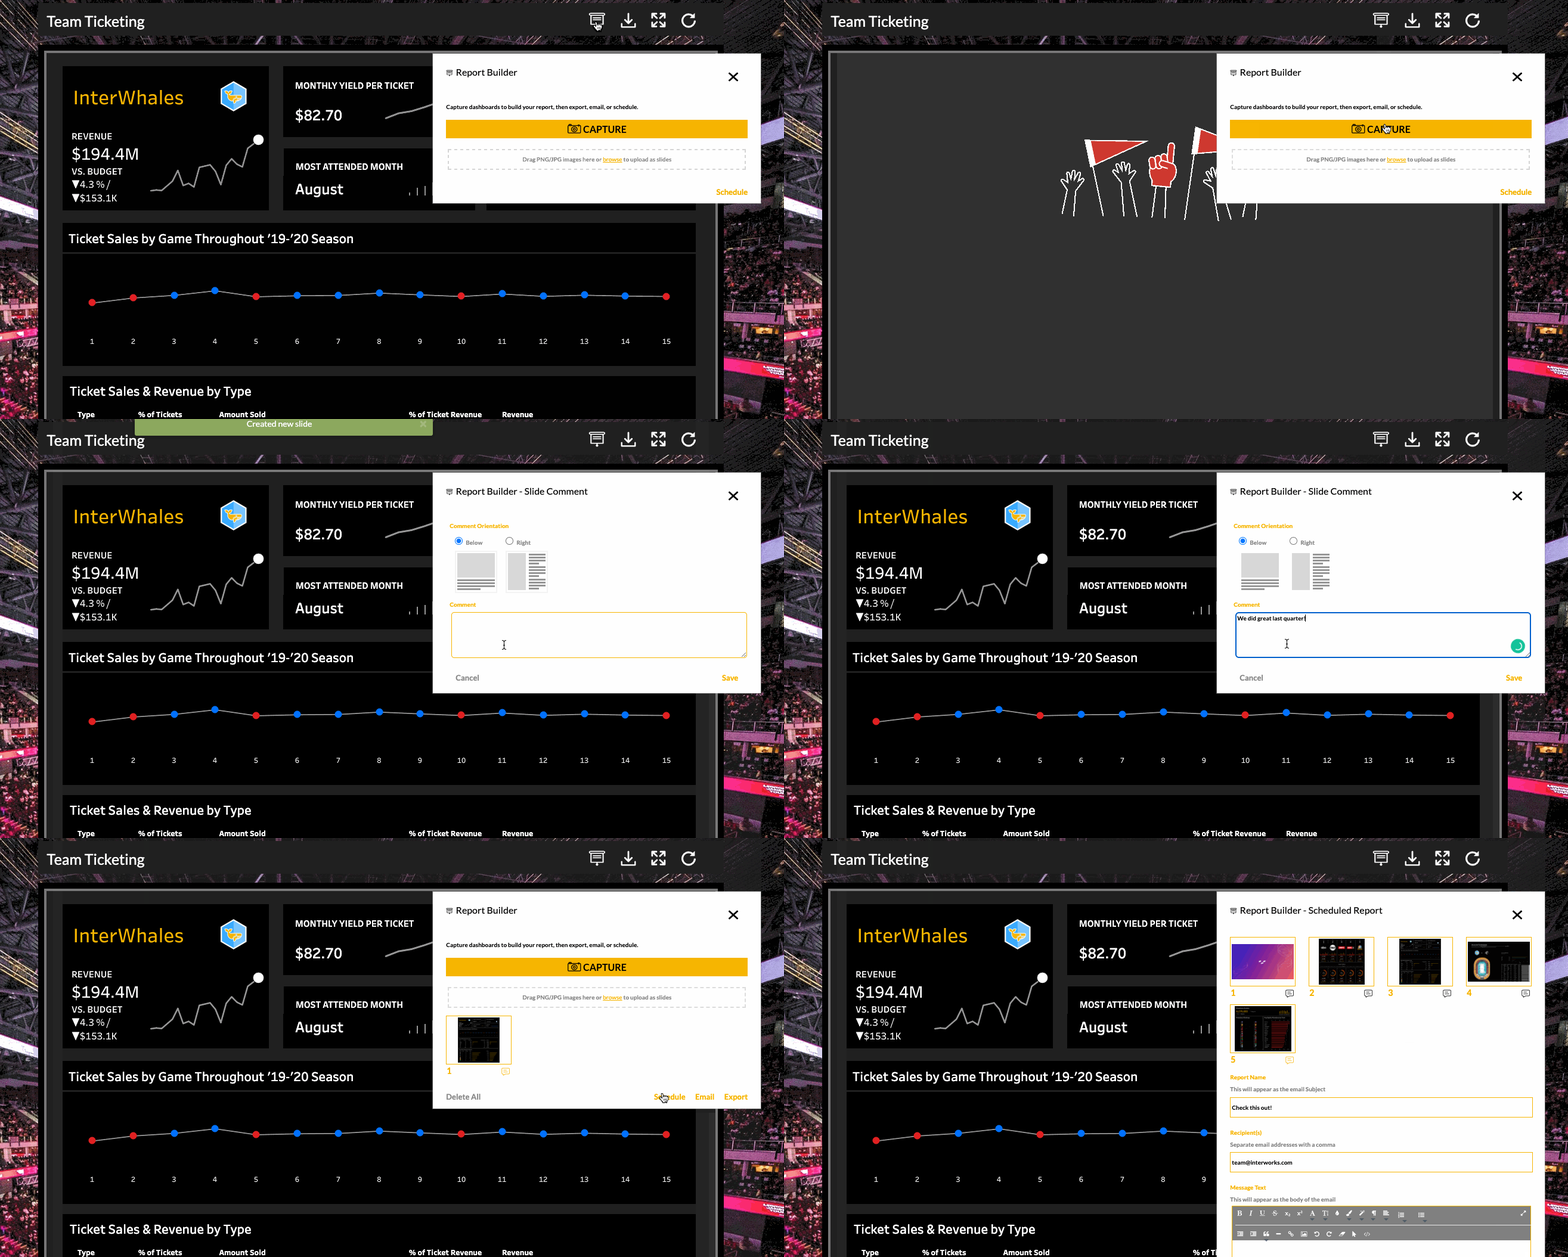
With Curator’s Report Builder, Grant could leverage his existing Tableau reports without switching platforms or starting from scratch. It offered a more straightforward, streamlined approach suited for his single-tool analytics content. Additionally, it featured a self-service capability, allowing others to customize reports for themselves or others, empowering them to access the most relevant metrics they needed from HR or beyond.
One feature of Curator that Grant found particularly useful was the PowerPoint template capability. It allowed him to use a standard company template that included mandatory terms and call-outs requested by his legal team while also letting him implement his company’s branding, adding that final touch of finesse to his reports:

After implementing Curator, Grant embarked on a series of calls to introduce users to the new functionality. The transition was smooth, and the response was positive. In the following months, Grant was free from the perpetual PowerPoint report creation cycle. He successfully reclaimed a significant amount of time, which he now dedicates to creating insightful new analytics for his organization.
Grant’s story is a testament to the power of finding the right tools to handle your needs. Whether you’re seeking to deliver analytic presentations, provide self-service capabilities or simply deliver reports where and when your users need it most, there’s a solution for you.
Are new ways to distribute analytics in your analytics roadmap? We mentioned two solutions in this blog that both focused on PowerPoint, but there are more you could consider. For instance, Tableau Pulse recently went into beta and focuses on delivering metrics and KPIs directly to users in Slack, email and other locations. If you’d like to discuss which options might make the most sense for your company, contact us; we’d love to help you find your solution!


