
Tableau released a beta version of Pulse to the public this week, and we think there are some pretty cool things about it. If you’re not familiar with Pulse, we wrote an introductory article after Tableau showcased it at TC23. Tableau has been hard at work since then, and while they are only scratching the surface of what semantic layers and AI can do in this beta release, we think there are some exciting things going on already.
Building Metrics Is Easy and Intuitive – No Tableau Certification Required!
Pulse makes the process of defining a metric simple enough that anyone can figure it out. There are only three steps required:
- Select a measure and set its aggregation
- Select a time dimension
- Add any filters that are relevant
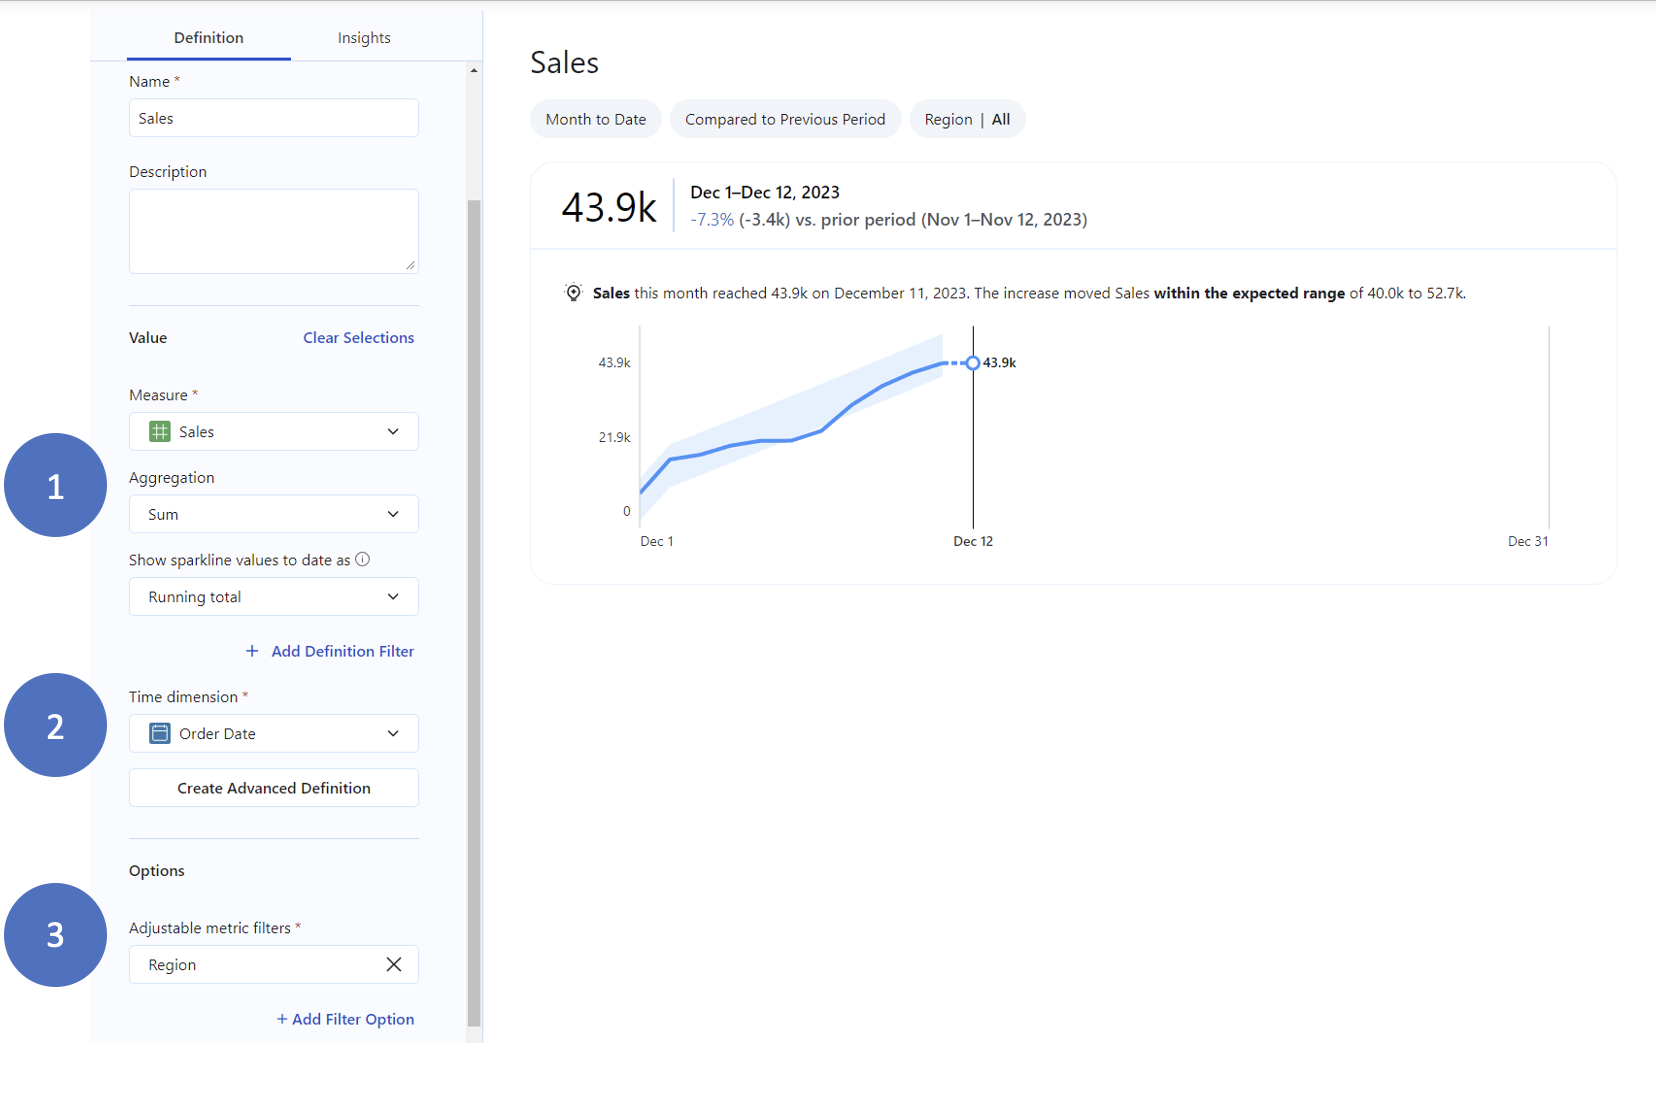
That’s truly all you need to do – but you have the option to create advanced definitions if you need something more complicated.
Once your metric is defined, clicking into it shows you some great information: The current value, a comparison to a prior period, a historical trend and more. You have the option to see an overview or a breakdown, and you can even ask follow-up questions to dig a bit deeper into what might be driving values and changes. Here’s a quick demo of what you’ll see for any metric you define:
 Customizable Metrics Offer Users Flexibility and Will Save Developers Time
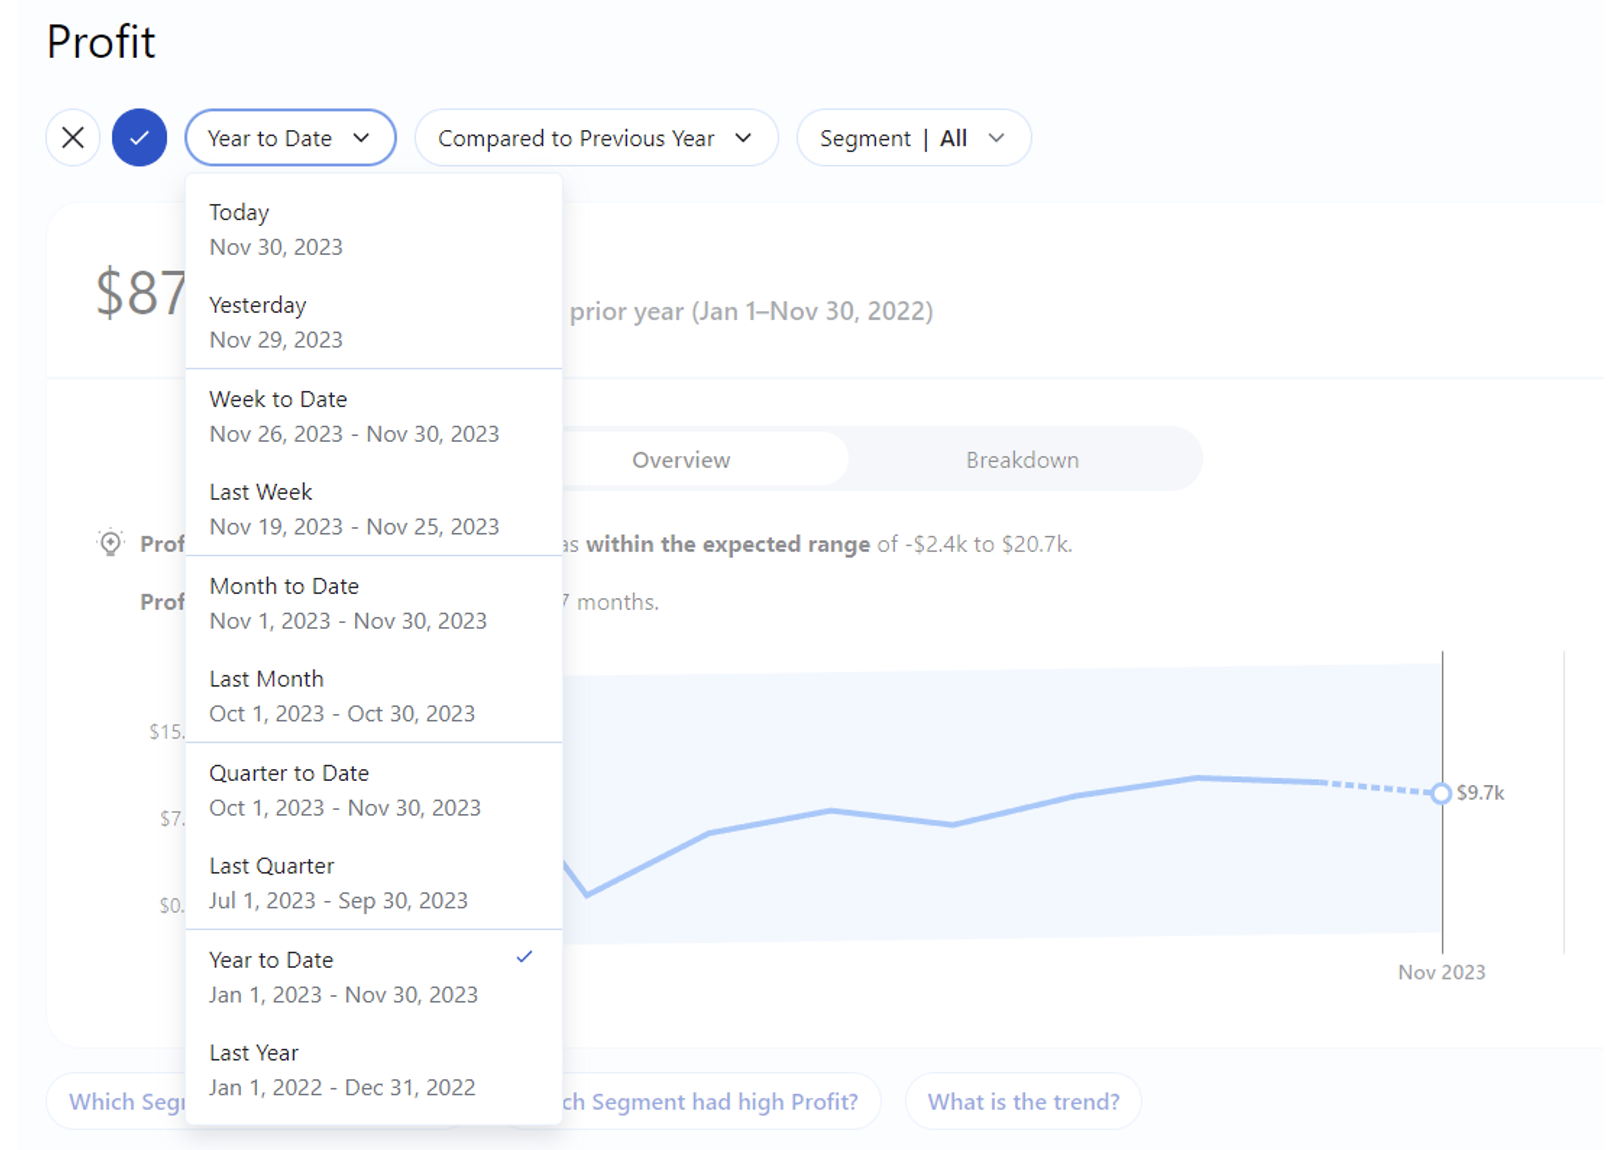
Not only is creating metrics simple, Pulse makes it easy for users to customize their metric, with common preset options for date filtering and comparison periods. Today, last week, year to date, etc. – there are ten common time frame options available so you can see the date ranges that matter most to you:
Pulse also offers flexibility for defining your comparison period, allowing you to choose between the previous period or the same period the previous year:
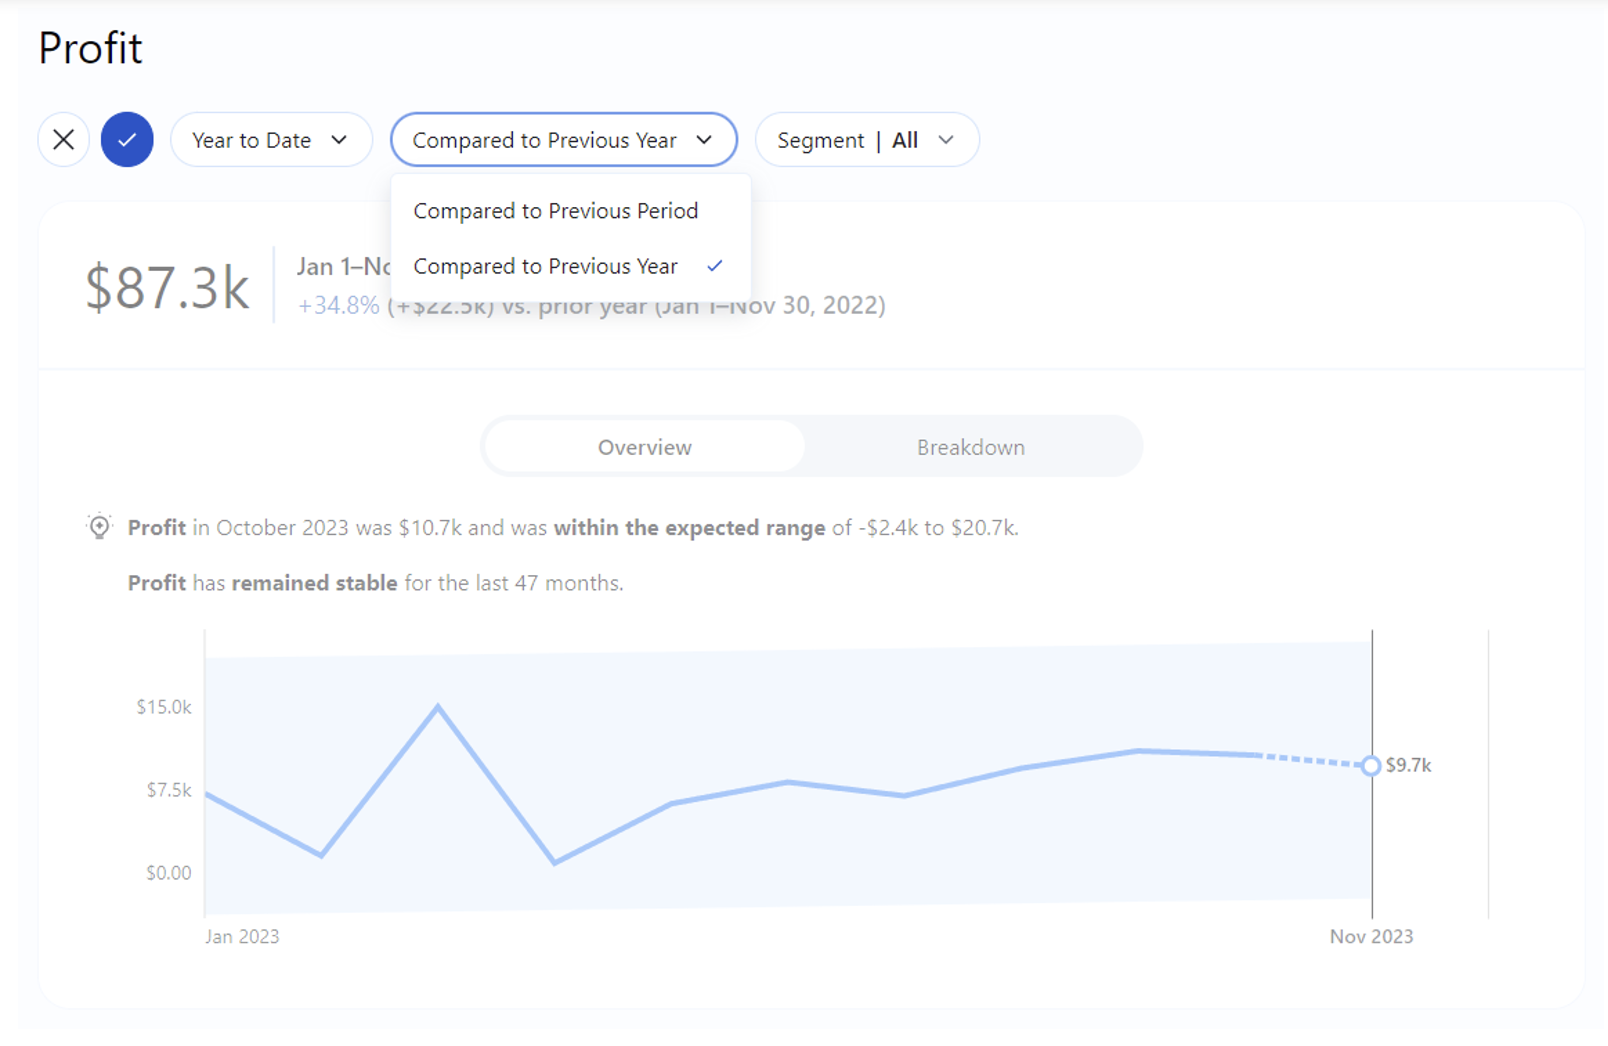
Pulse automatically determines a relevant granularity based on your date filter, making smart choices about whether to show trends at the daily, weekly or monthly level as you change date periods. Building all those options into a dashboard would take a lot of work, but Pulse makes that logic repeatable for all your metrics, which means developers and analysts can focus on other (and hopefully more interesting) work.
Pulse Pushes Metric Summaries Directly to You, and That’s Only the Start
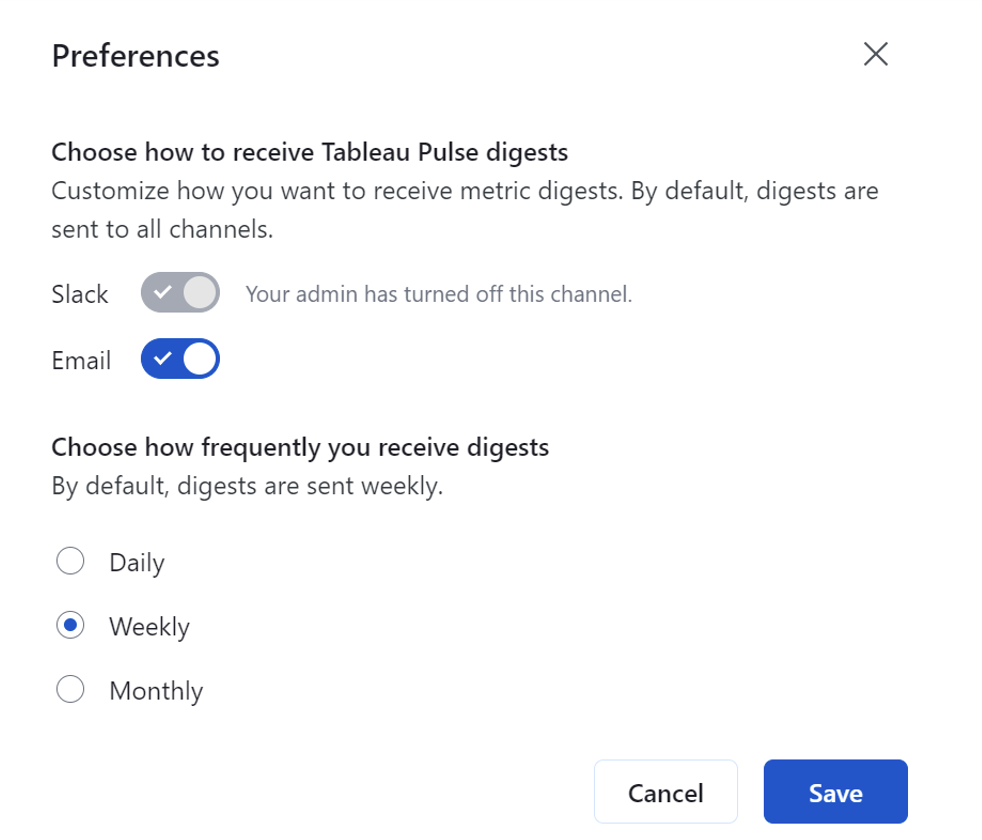
Once you’ve defined your metrics, you simply choose which ones you want to follow closely. Pulse displays those metrics on your homepage when you log in, but it also allows you to sign up for metric digests delivered to Slack or email on a daily, weekly or monthly cadence:
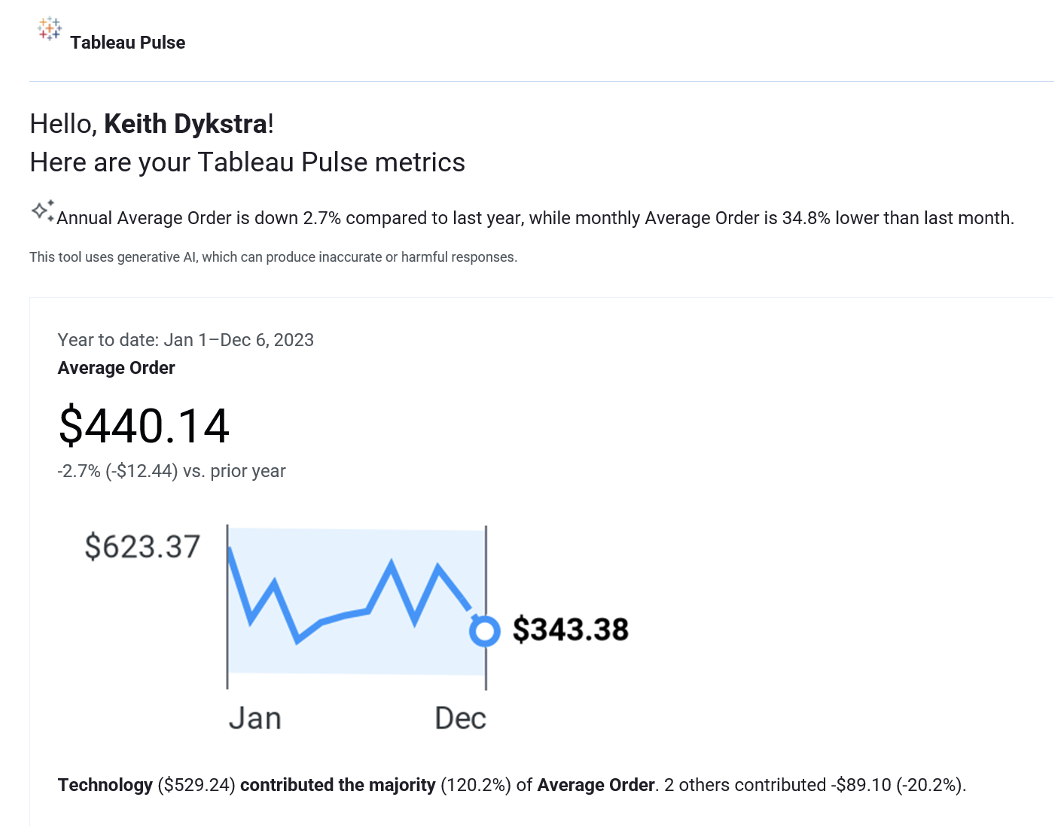
Those digests give you a quick summary of performance in your selected period and even call out underlying attributes that contribute to the overall trend:
But We’re Just Getting Started
Although we’re excited about what Pulse can do now, we’re even more excited about what Pulse will eventually make possible. Pulse is just the start of Tableau building a semantic layer that can push metrics wherever you want and rely on AI to help tell you what’s going on with those metrics. In conjunction with the VizQL Data Service that Tableau also demoed at TC23, Tableau is making big strides towards headless BI. Dashboards published to Tableau Server or Tableau Cloud will no longer be the only way to consume analysis. Pulse (and VizQL Data Service) will enable new experiences for end users and make it much easier for them to consume analytics directly within whatever apps or platforms are part of their workflows.
If you want to work with us on your Tableau Pulse, check out our offerings to see what we can do for you!