
As we mentioned in our last article, we’re excited about what the future holds with Pulse. Tableau let us have early access to the beta version before releasing it to the public, so we wanted to share a few things we learned while we were exploring it. We expect Tableau to continue improving the platform (and we shared a few ideas with them based on our experience), so some of these things may change. In the meantime, here are a few tips to get you pointed in the right direction with Pulse.
1. Heads-Up: Metrics Spawn Related Metrics
When you first define a metric, it’s just a single metric. But you might notice that what started as one metric can quickly turn into many related metrics:
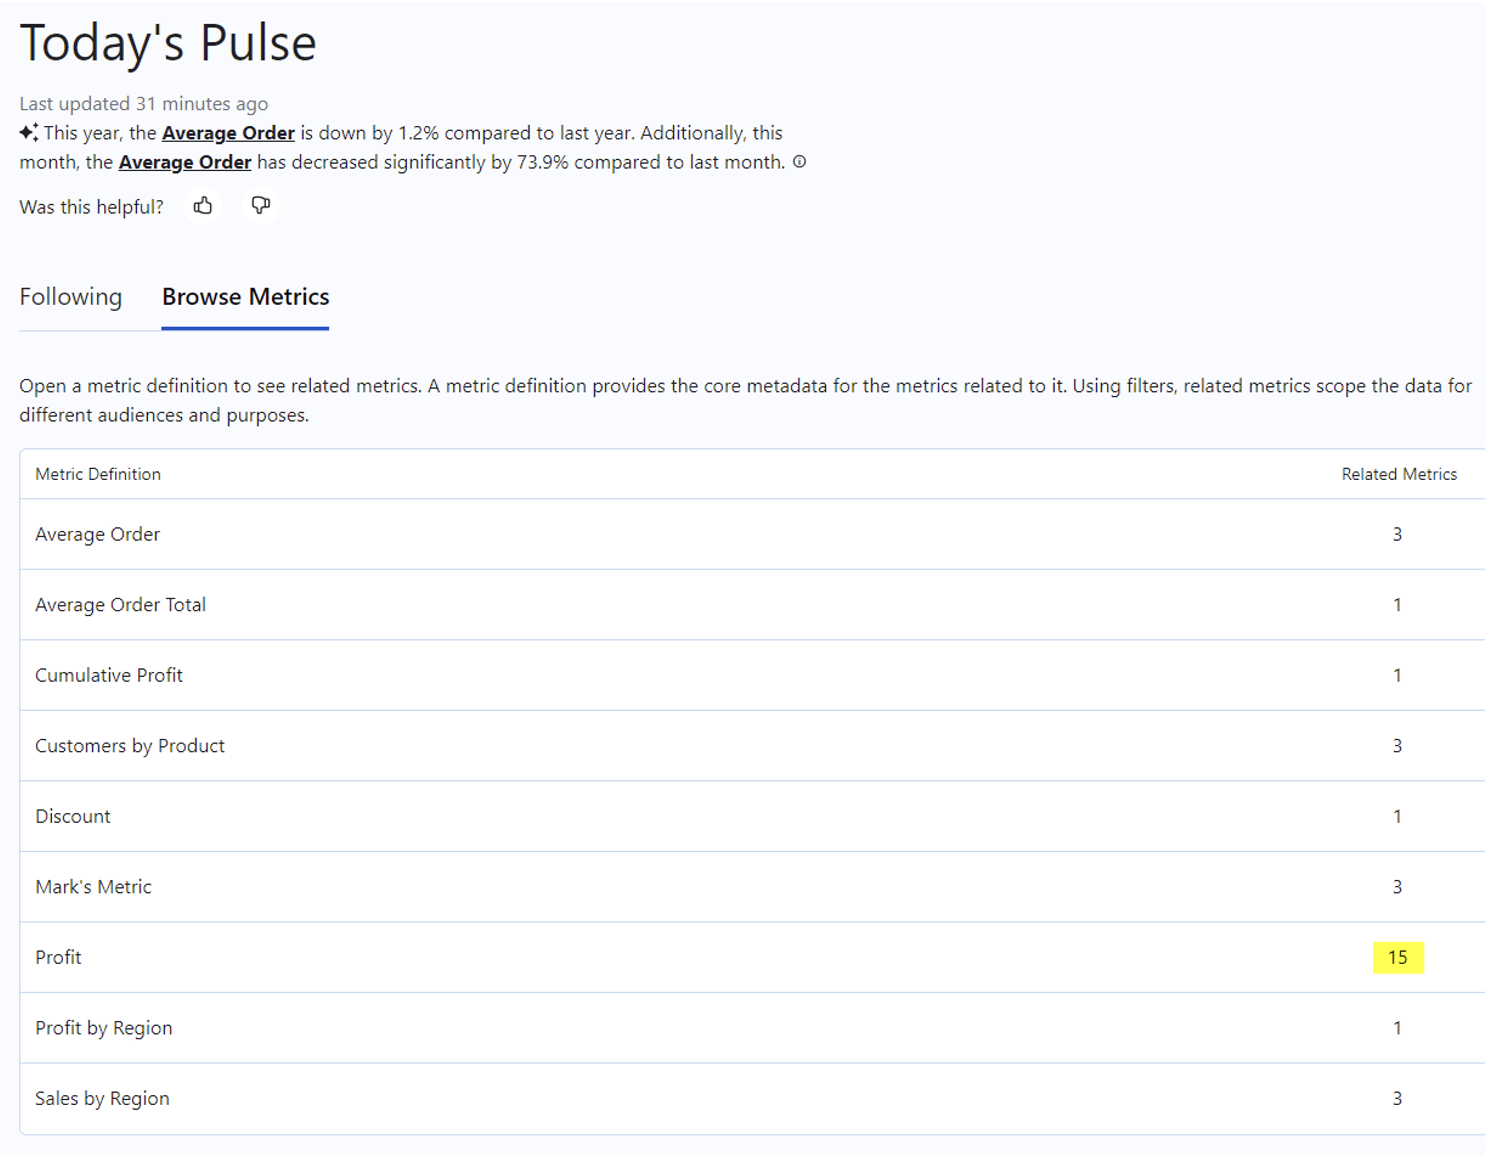
If you’re wondering where all those related metrics came from, don’t panic — you didn’t do anything wrong. As you change date range options or add filters to the metric you defined, Pulse keeps track of each unique combination and creates a related metric for it. Think of it like this:
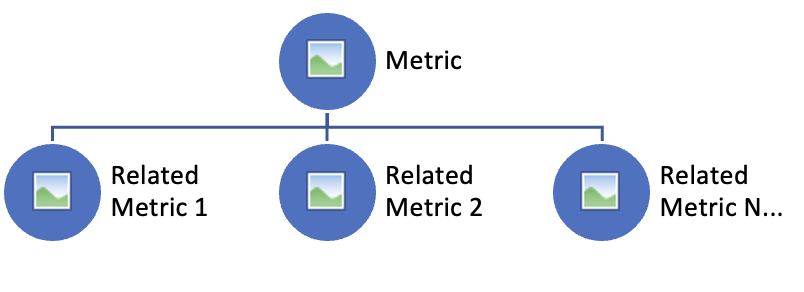
A metric is a single measure with defined aggregation, a time dimension and other filters. It acts as a parent for related metrics.
- Example: Profit (measure) summed (aggregation) by order date (time dimension) for all regions, categories, and sub-categories (other filters)
Related metrics are various expressions of that parent metric with specific filters.
- Example 1: Profit last month (time filter) for the West and South (region filter)
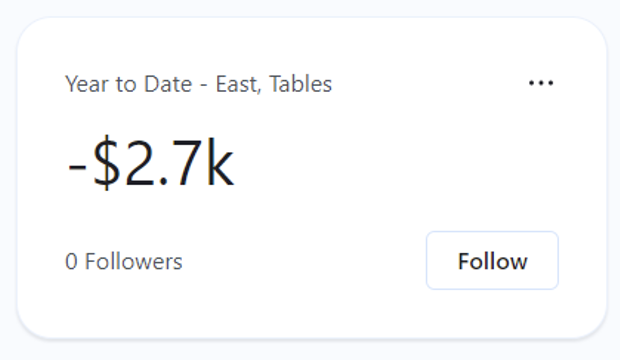
- Example 2: Profit year to date (time filter) for tables (sub-category filter) in the East (region filter)
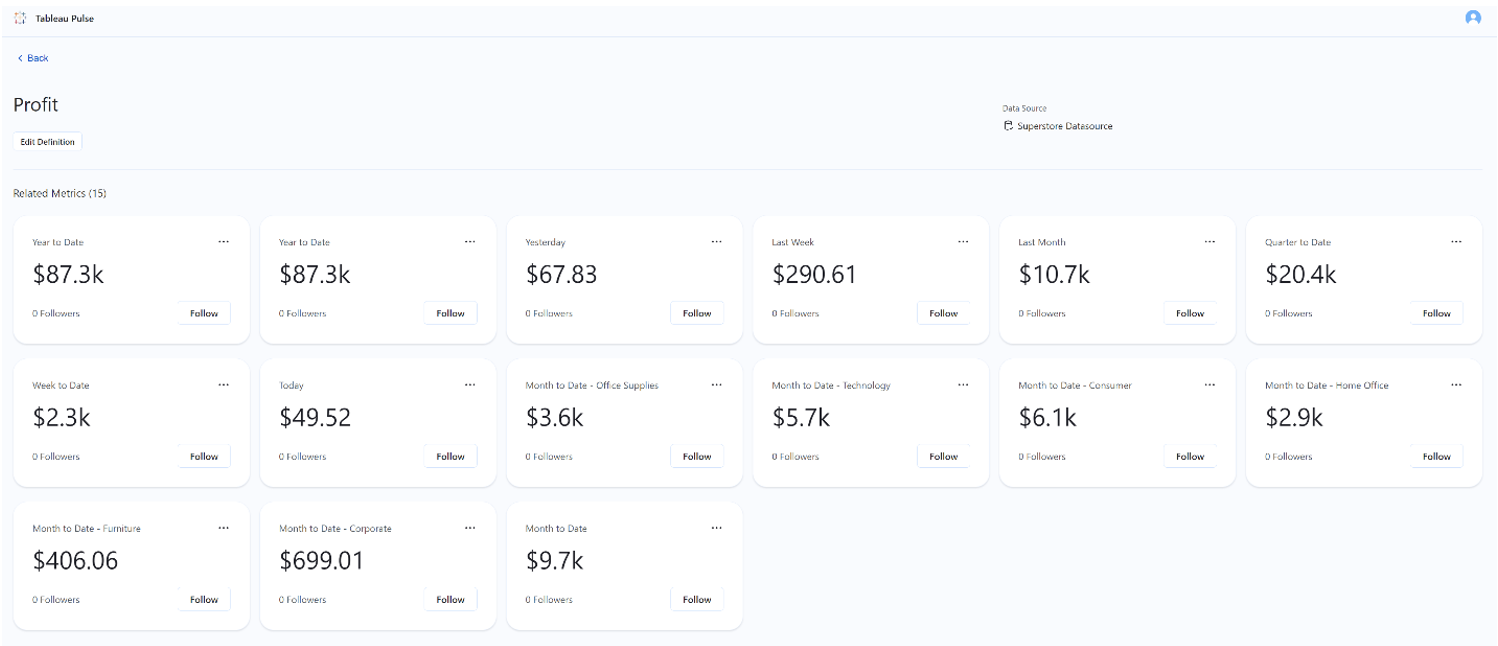
The fact that Pulse keeps track of specific combinations is helpful if you want to closely monitor those combinations. But just a heads-up that it can also lead to a cluttered experience if you try out a lot of different combinations:
You can choose which related metrics you want to follow, which adds them to your homepage and allows you to subscribe to email or Slack digests for them. You’ll only need to revisit these pages of related metrics if there are new combinations that you want to follow:
2. Slack and Email Digests Are Great but Have Limited Options in the Beta Release
Pulse allows you to subscribe to a daily, weekly or monthly digest of your metrics. At the time of writing this, you couldn’t set up different schedules for different metrics, so you’ll have to choose one option for everything:
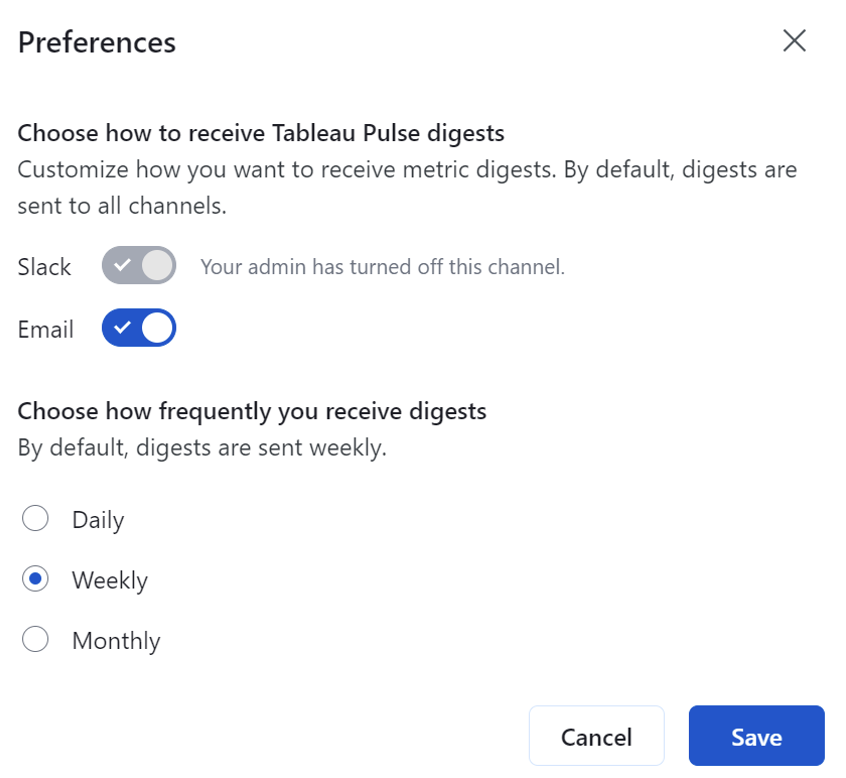
It might seem like a good idea to go for the most frequent option (daily), but if you’re just going to ignore it most days, consider whether weekly or monthly would be sufficient. You can always access your metrics on demand by logging into Tableau Cloud, so choose a schedule that provides timely reminders without adding excessive noise to your inbox or Slack.
3. You Can Customize the Type of Insights Pulse Generates
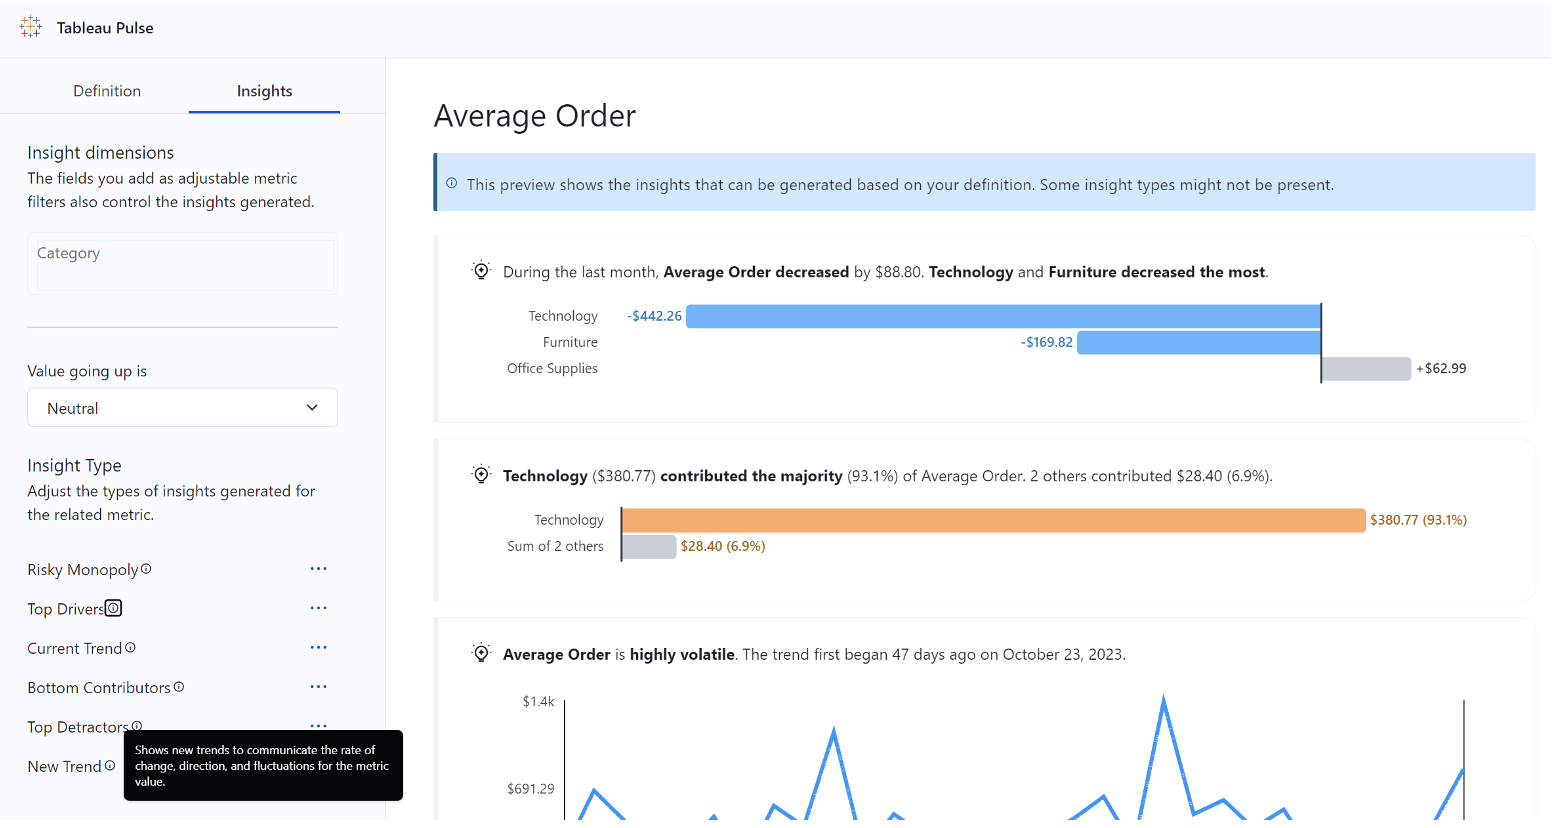
Something we nearly missed when we were originally testing Pulse was the option to customize your insights. You can indicate what kinds of insights or changes you care about. All of them are turned on by default, but you might want to turn some of them off if you don’t care about them (maybe bottom contributors doesn’t really matter to you) or if there are insights that seem more actionable (maybe focusing on new trends is what you monitor closely for a volatile metric). You can hover over the info icon next to each insight option to understand what it does:
4. You Will Probably Still Need Dashboards for Advanced Metrics
Pulse offers an option to create advanced metric definitions, which opens up a canvas that feels very similar to Tableau Desktop where you can write your own calculations in this section. I tried to recreate a specific metric that one of my former clients needed. It was essentially a daily trend, showing the percent change in running total sales for the current year compared to the prior year. I was able to set up the calculation as I wanted, but I received error messages when I tried to apply it:
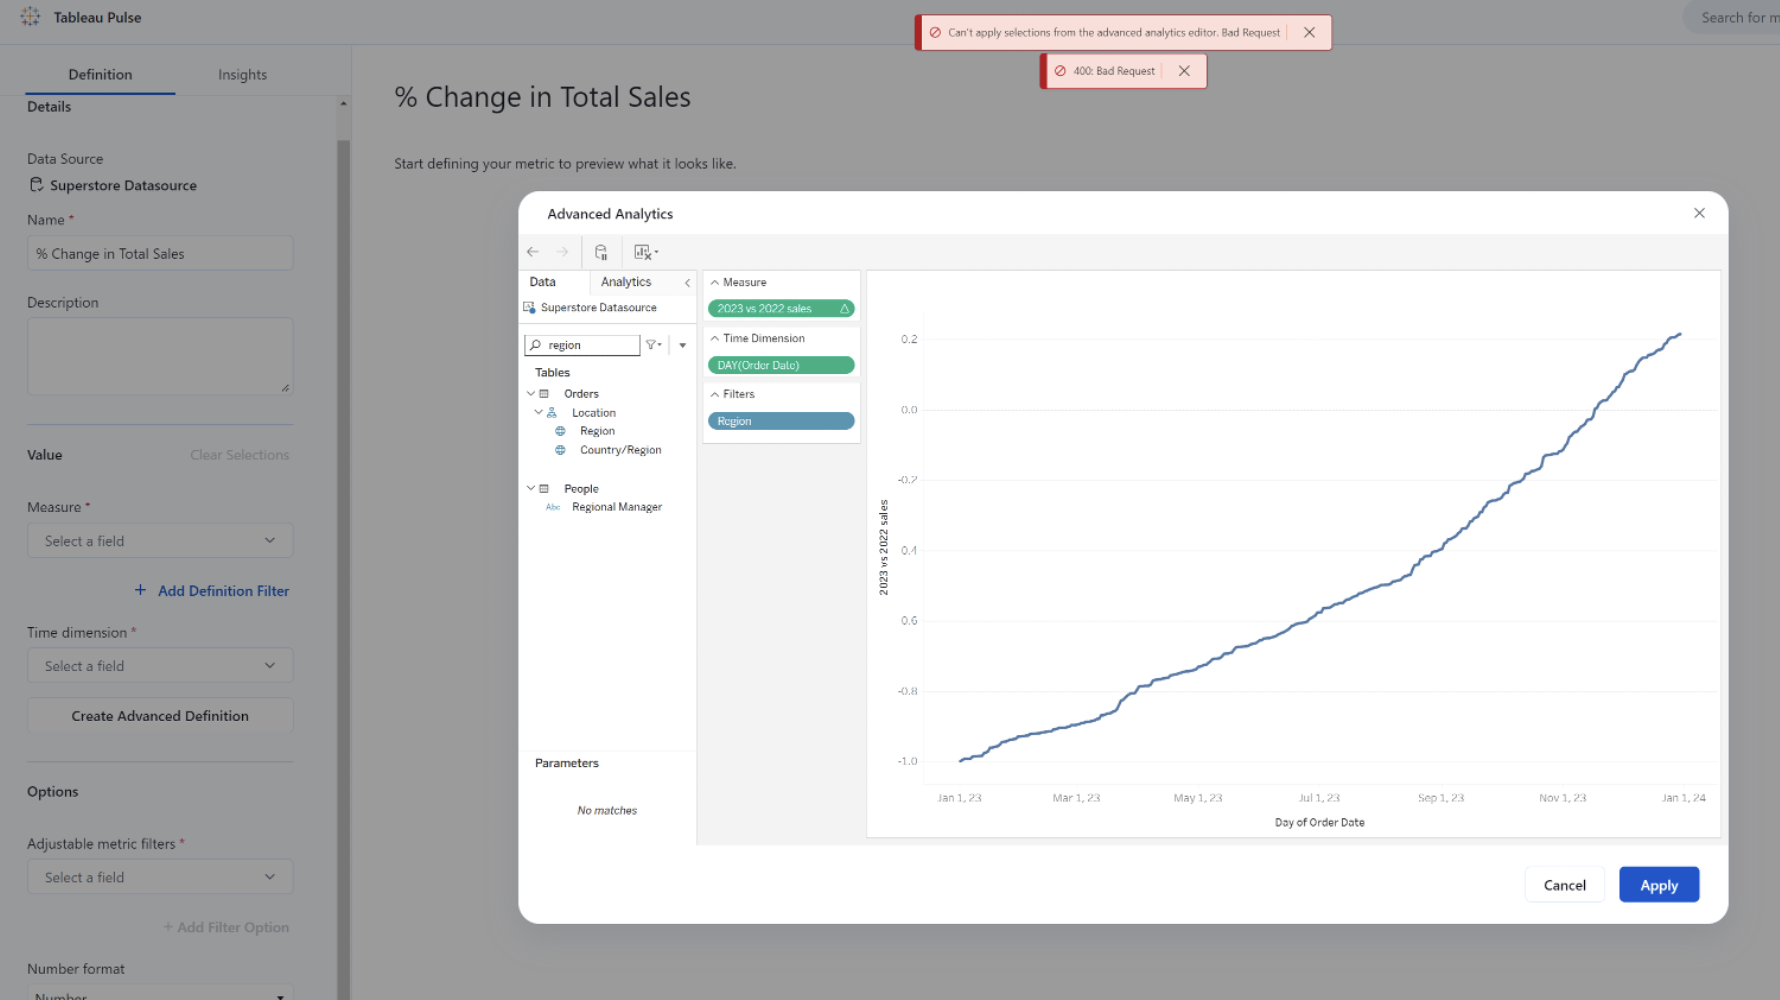
Note: The two errors say, “Can’t apply selections from the advance analytics editor. Bad Request,” and “400: Bad Request”
I passed this feedback along to Tableau, and they told me the beta version does not support table calculations within advanced metrics. I’m sure they’ll add that capability eventually, but in the meantime, you’ll still need to rely on other means like dashboards and subscriptions to show some of your more advanced metrics.
You might be asking why I’m trying to build an advanced metric in Pulse instead of building that into a published data source. Great question. In general, I’d say metrics should probably be defined in published, certified data sources. But in this particular case, I didn’t want to precompute the running total for each year because I wanted the ability to filter this metric by various dimensions (like region or store). Offering end users the ability to filter this metric means I needed to add a running total to the sales measure in Pulse instead of in the data source. Occasionally, you’ll probably also need to do some additional manipulation of metrics within Pulse, and while the advanced definition options offer some flexibility, they may not yet be flexible enough to suit all your needs.
5. There Are Limited Governance Options, So Start With the Essentials and Leverage Data Source Permissions To Control Access
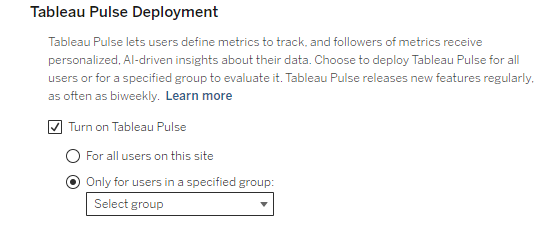
In the beta release, Pulse gave all creators and explorers the ability to define metrics. Tableau added the ability to turn Pulse on for select users groups in their general release in February.
For users with general Pulse access, data source permissions are still the only way to control which specific metrics they see. Users see all metrics from all published data sources to which they have access, so take a minute to review who has access to your published data sources.
We’ve got a lot more tips for you on how to prepare your organization for Pulse in our next article, so if you want to see more ideas like this, keep reading! Or, if you want to work with us on your Tableau Pulse, check out our offerings to see what we can do for you.