
Tableau supports a set of functions that you can use to pass expressions to analytics extensions for integration with R, Python and Einstein Discovery. These analytics extensions can receive data from Tableau in real time and return it back after it has been reshaped, transformed or augmented. This facilitates dynamic data visualization exploration. Today, I will be focusing on TabPy, Tableau’s Python server allowing Python script usage inside Tableau calculated fields.
What is TabPy?
First off, to those who are unfamiliar: Python is a widely used high-level programming language for general-purpose programming. By sending Python commands to an analytics extension, you can do things like predicting customer churn or running sentiment analysis. In addition, the user can use Python for data cleaning and predictive algorithms inside Tableau.
In the use case blog post later in this series, I demonstrate how to use this tool to assist in multi-variate decision making in a Tableau Dashboard. In a later blog post detailing how I built the dashboard, I write about how to incorporate TabPy into the project natively in Tableau.
Tableau Python Server (TabPy) is part of Tableau’s expanding range of new features. To install TabPy, visit this GitHub page.
On that link, scroll down to the ReadMe file, where you will see a list of TabPy documentation files:
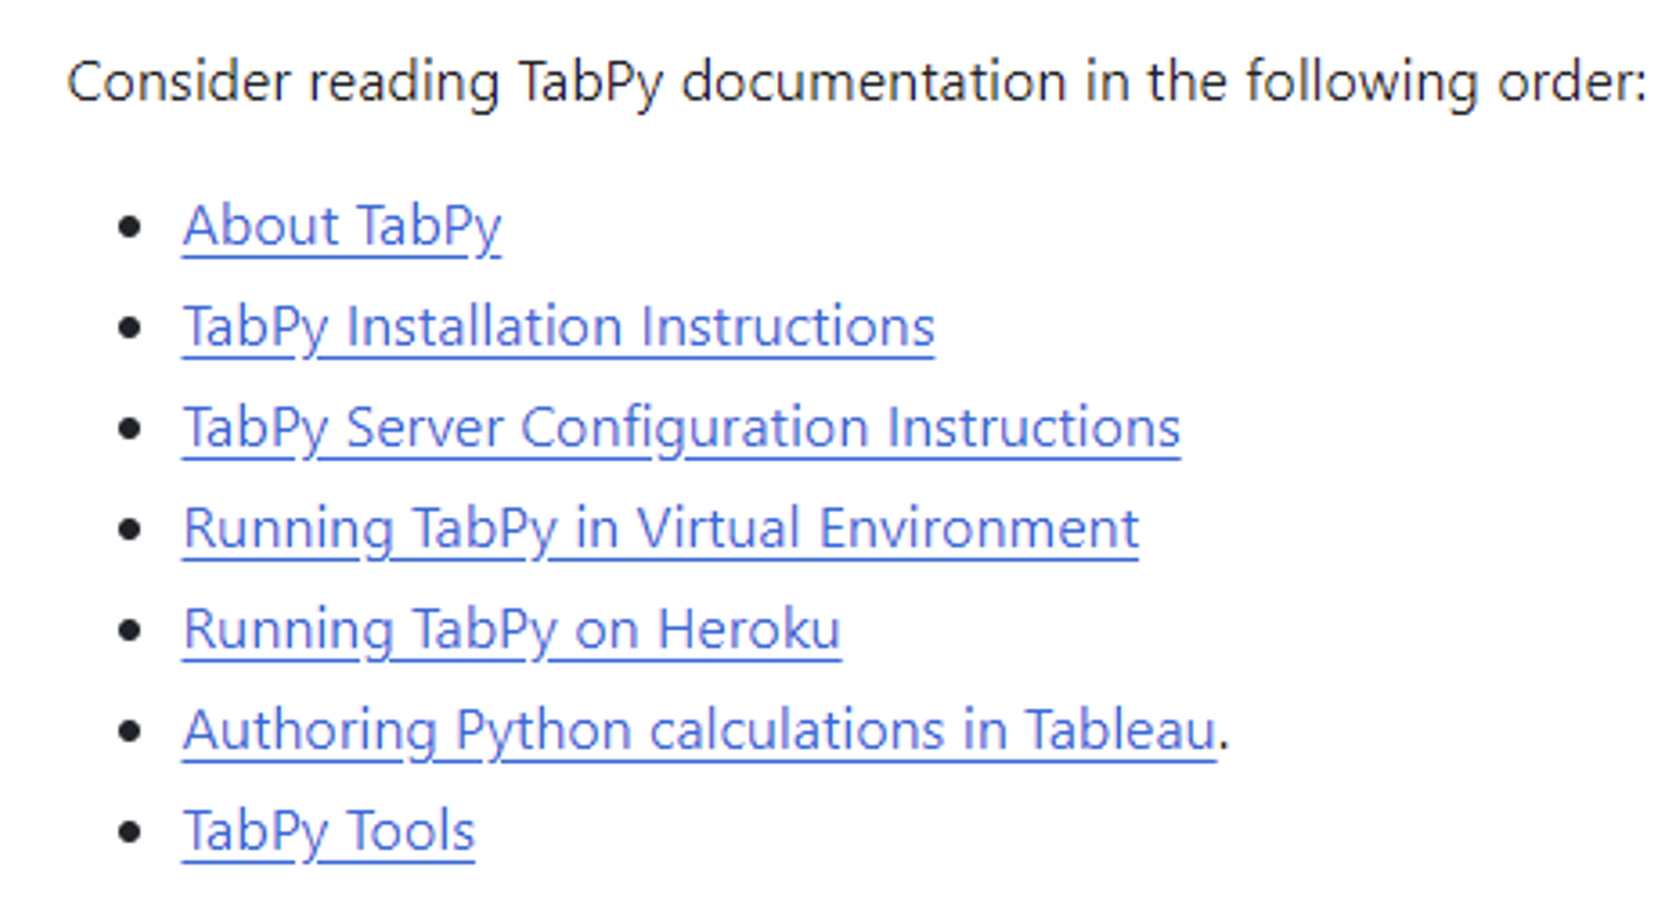
These resources detail everything you will need to install and configure your own server! Credit goes to the multiple public contributors on that page, but it is a great resource.
To read more about the possibilities of Python in Tableau, see the blog post, “How to build advanced analytics applications with TabPy” from Tableau.
Getting Started
To connect to an analytics extension in Tableau:
- Open Tableau Desktop and your chosen workbook
- Hover over the furthest right tab, “Help”
- Hover over “Settings and Performance,” about two-thirds of the way down the menu
- Click on “Manage Analytics Extension Connection,” also about two-thirds of the way down the menu
- You should be viewing this menu:
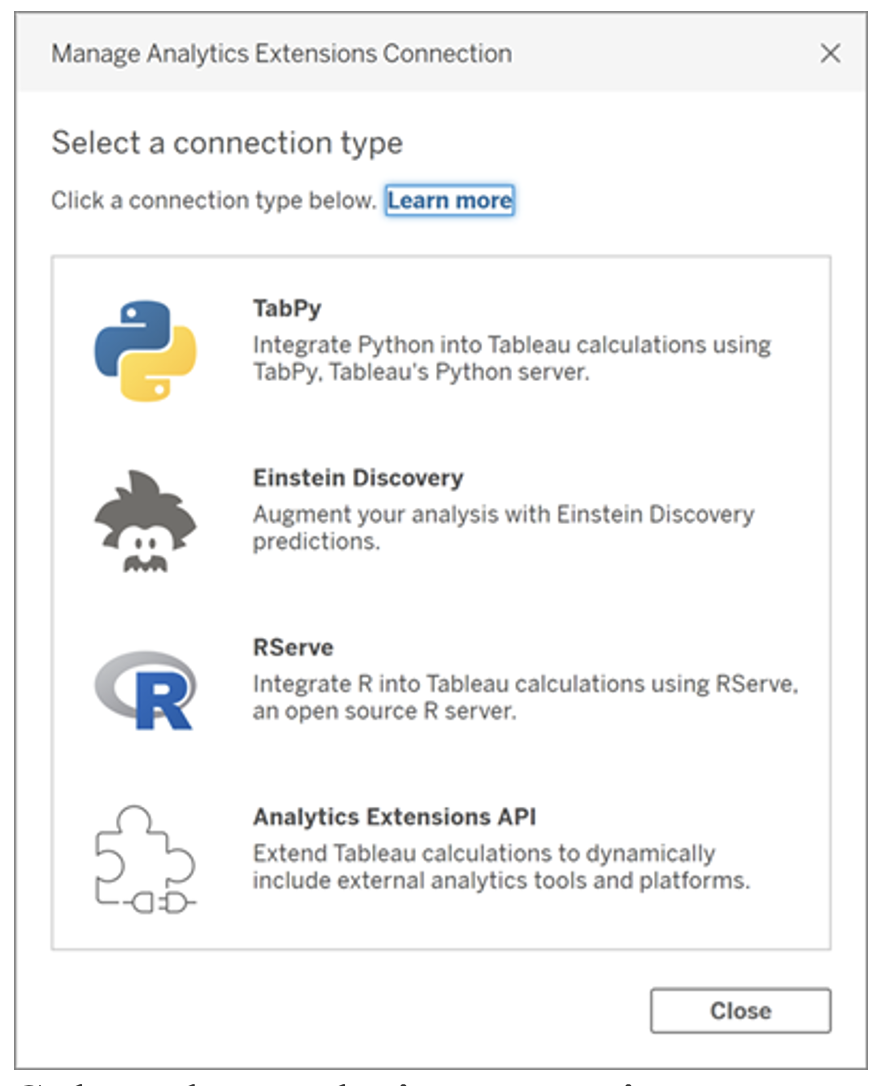
- Select the analytics extension you want to connect to.
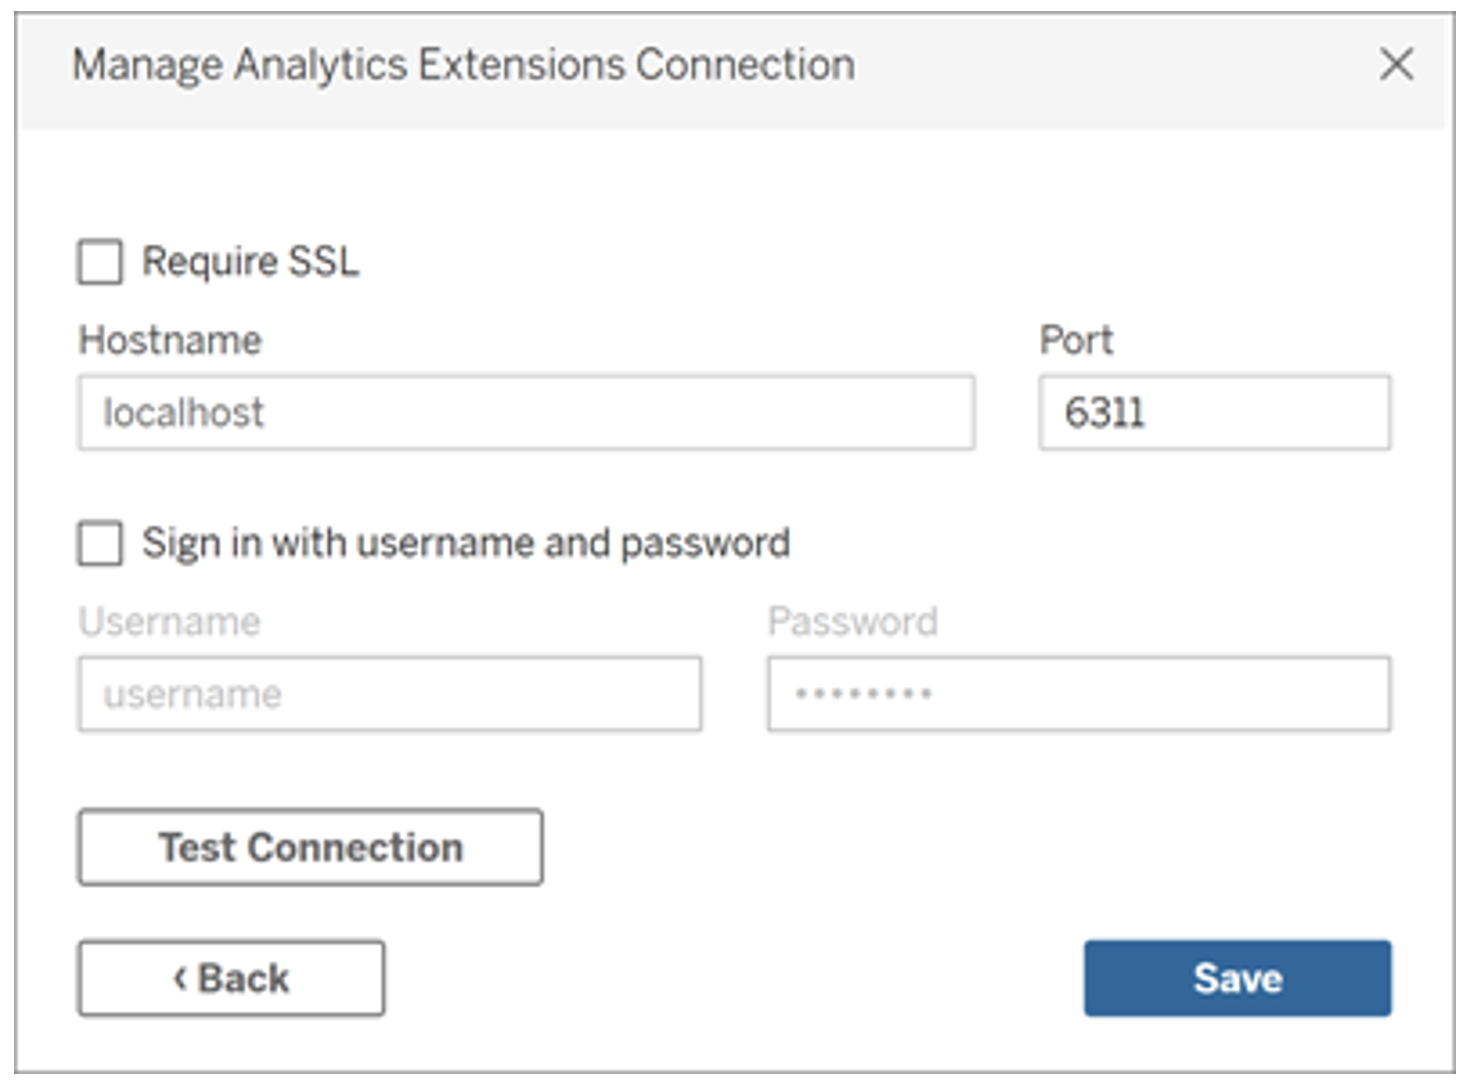
For Einstein Discovery, log in with your Salesforce credentials. For the other three options, you will need to configure your analytics service, i.e. enter the host and portal information from the TabPy server that you set up (see GitHub for reference):
Once connected, you are free to use Python script in your calculated fields by following certain steps detailed in this blog post from Tableau.
TabPy Use Cases
In the Building InterUrban Blog, I will describe how we incorporated the use of the TabPy analytics extension into our workbook. As mentioned above, we will be using the python code to help build our pareto frontier to optimize the selection process.
Another Tableau resource here, if you’re interested!