What Is Data-Enabled Decision Making?
It’s actually easier to start with what it is not. It’s not making decisions based on a, “gut feeling” or other instinct, but by looking at the hard data to choose a path forward.
For instance, if you have a company that wanted to improve upon the delivery times for their products, they may map out the areas that see the longest delivery times and compare that to where their transport hubs are located to see where they can build new facilities and hire new delivery drivers.
A Brief History of Self-Service BI
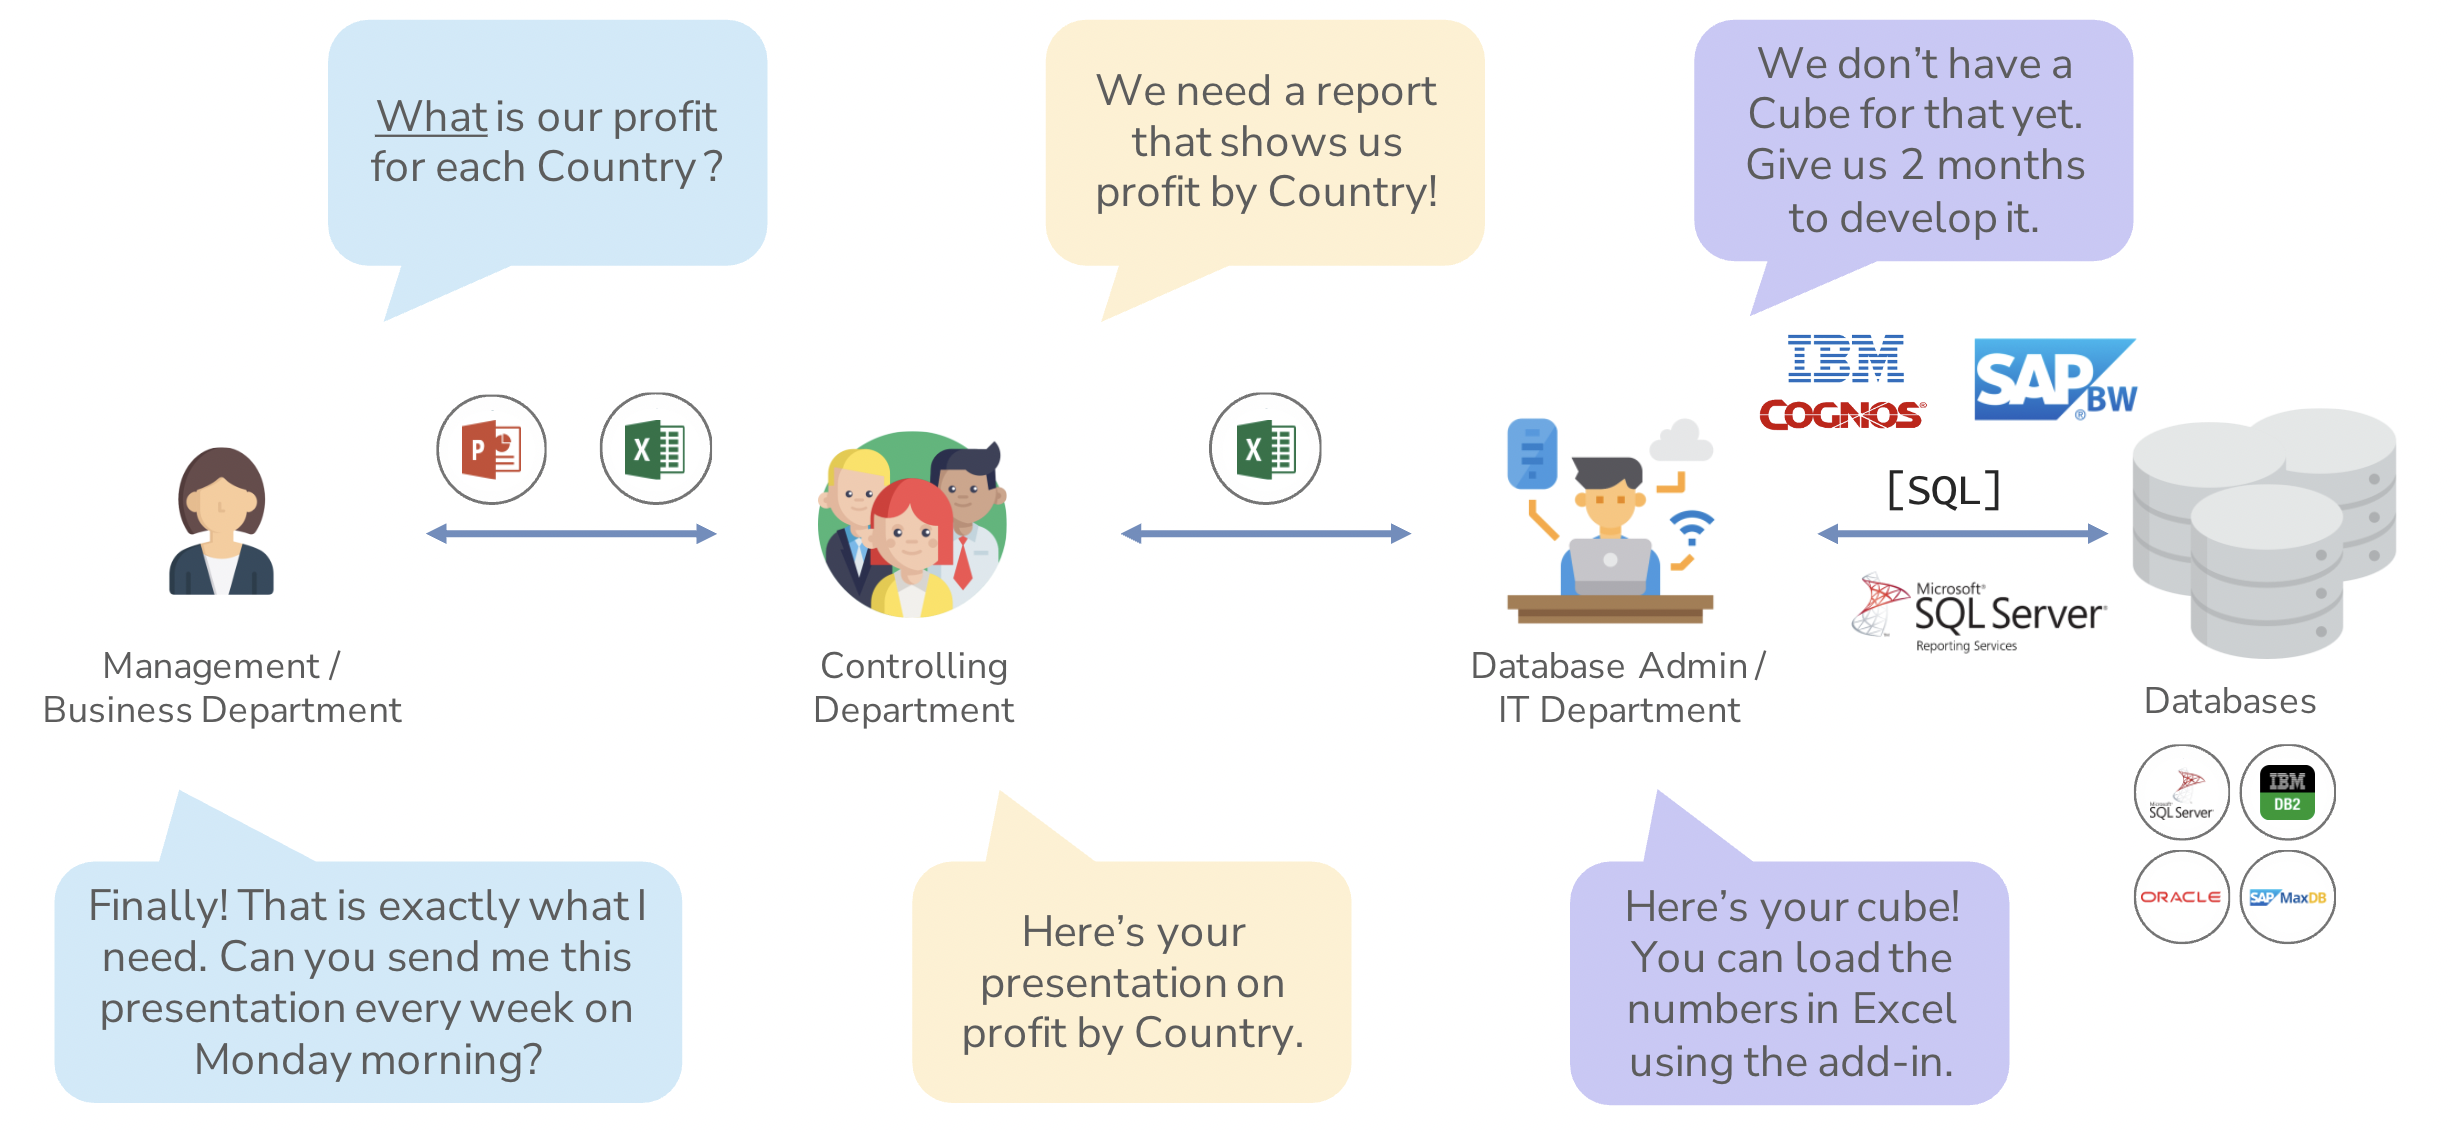
We can start our journey at BI 1.0, where the main goal was to answer, “the what.” A manager might ask the company’s finance department, “What is our profit for X region?” Finance might not have that number on hand, so they in turn ask the IT department for the data necessary to answer the question. Then, the IT department might have to develop a “Cube” for that data, a process that may take weeks or months, just to visualise the data with pre-calculated parameters. Then, finally, at the end of the process, the IT department can hand back the data and allow the finance department to see the numbers using an Excel plugin.
After all that, imagine if the manager asked for said report on a weekly basis. After that whole process, it was easier to recreate using the already existing framework, which was how reports were generated.
As you can imagine, this method wasn’t without flaws. It isn’t really scalable in a meaningful way. The time to insights was very, very high, even with the framework in place. None of that even touches governance, which is a nightmare with this system. There’s no version history, people could edit files as they saw fit, and there was little security in general.

Above: Visualising BI 1.0. Read clockwise, starting from the top left blue text box.
BI 2.0
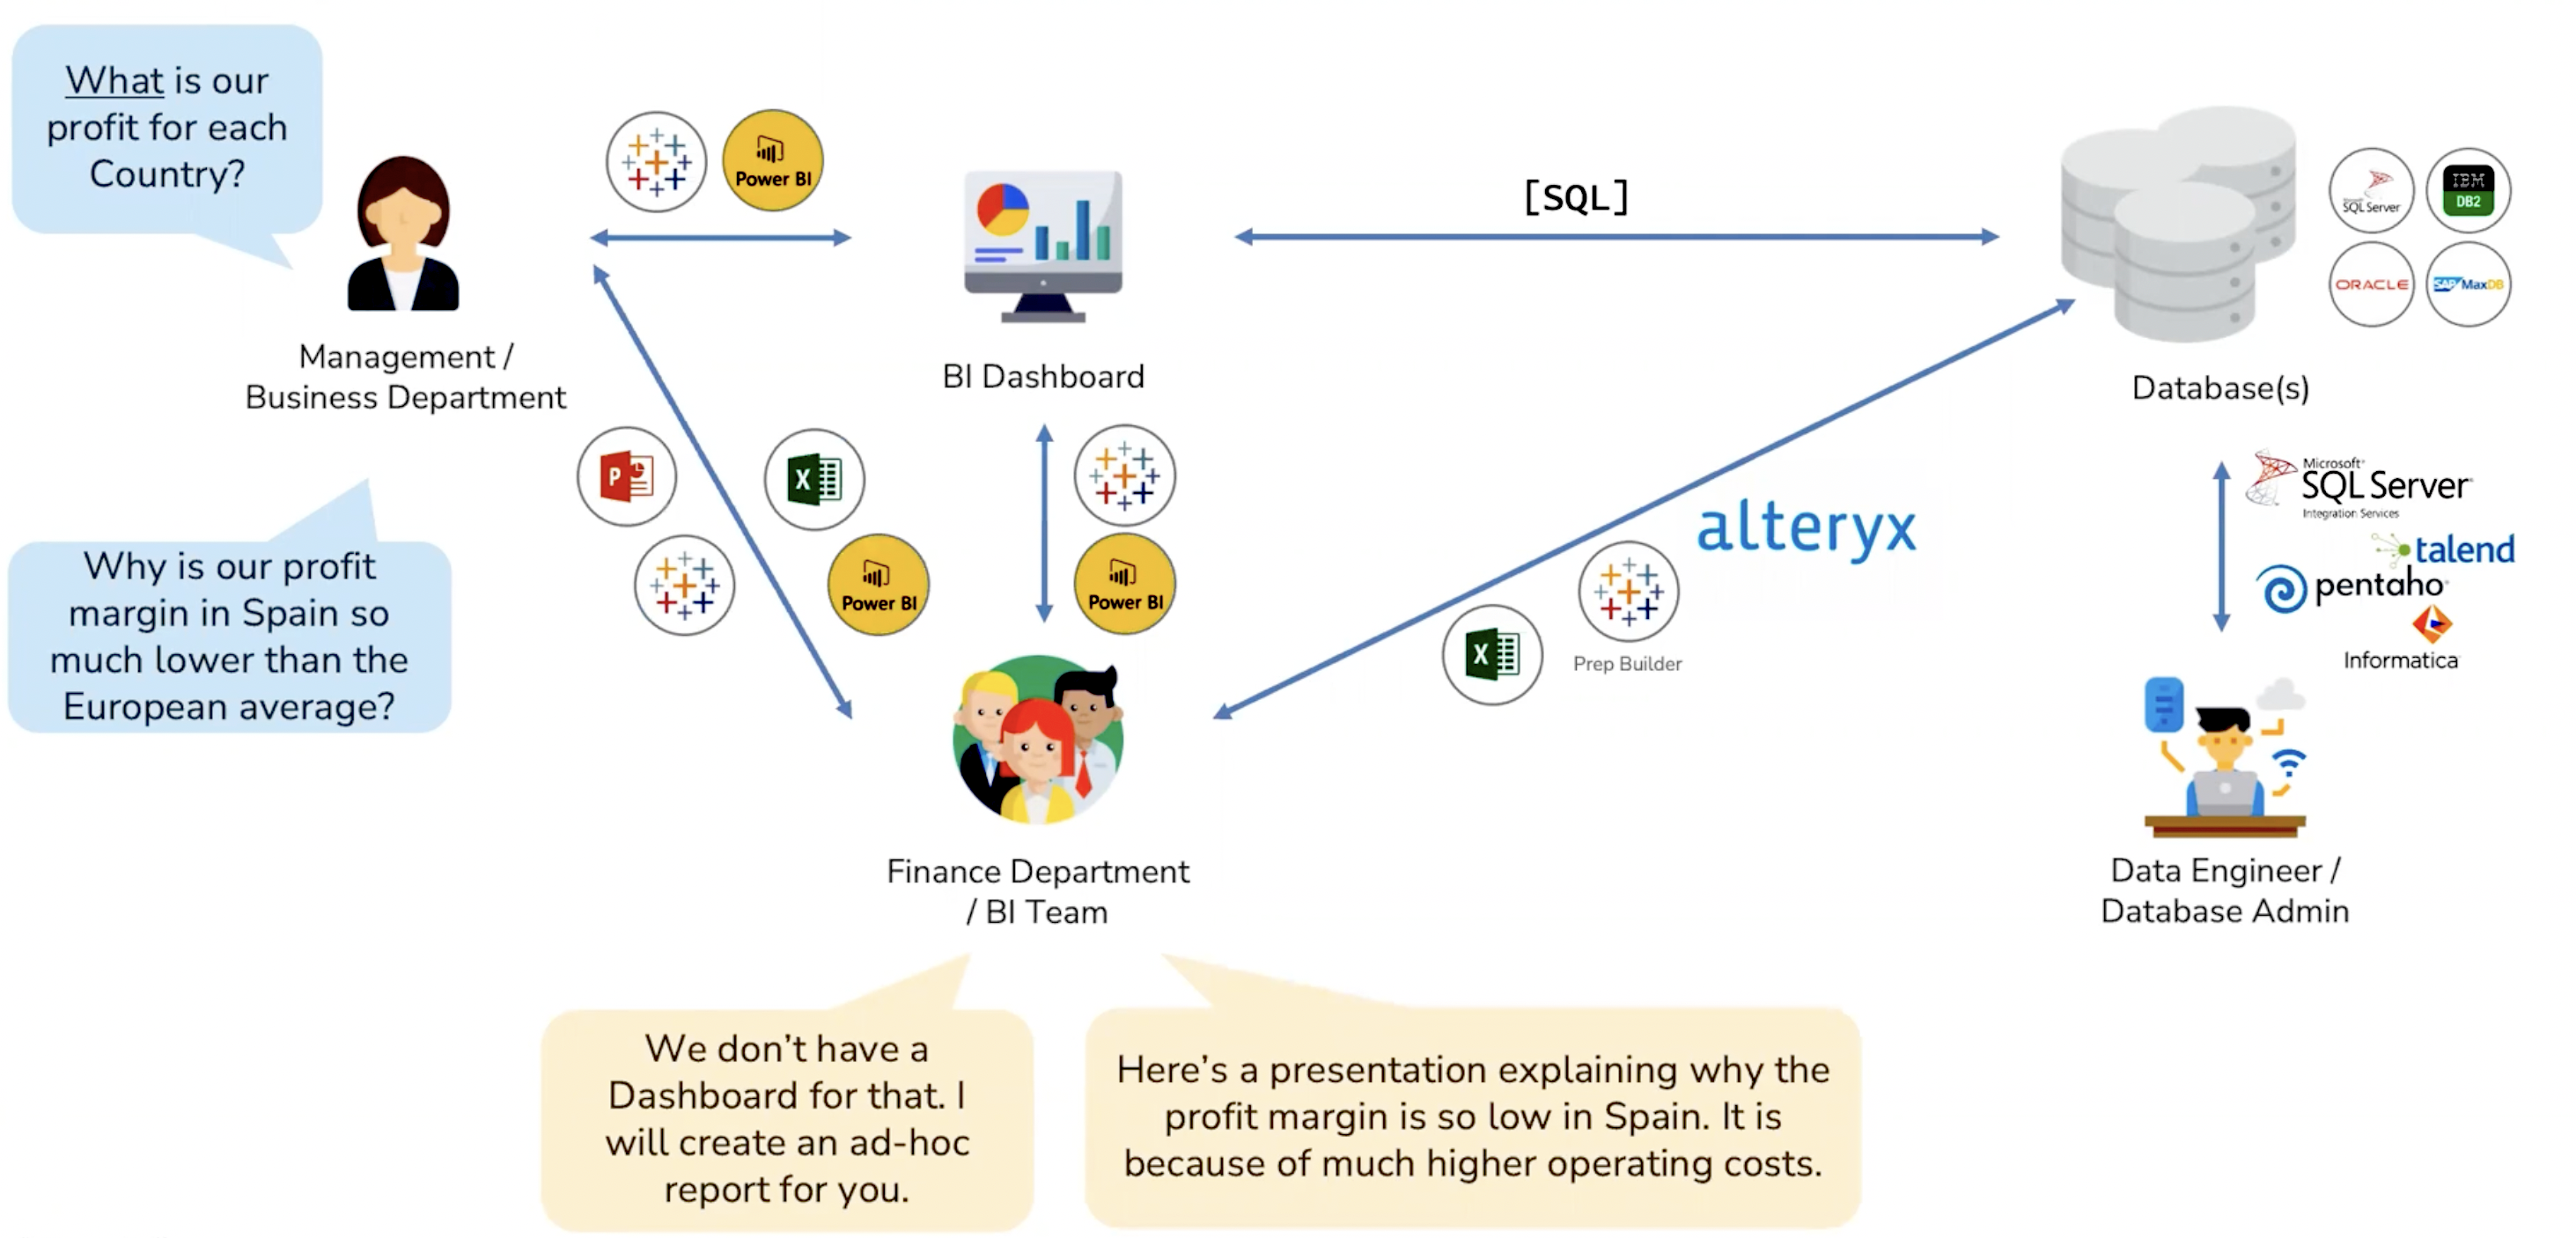
With 2.0, the purpose of BI changed to automating how we answer, “the what.” Here’s where we have the introduction of the dashboard. We can now incorporate a drag-and-drop interface for queries and have the calculations done in the background while it’s visualising said data on the front end.
All those calculations and visualisations could be combined into a dashboard where KPIs could be analyzed and follow up questions could be asked with a much, much higher time to insight. Instead of going through the middlemen, a manager could go to their dashboard for the insights needed, no weeks to months of turnaround time needed.
That said, there is much, much more going on in the dashboard’s backend, with a plethora of different pipelines and software tools. Database engineers/admins can be far removed from the end users maintaining said data environments and tools. Sometimes, the end users may not have access to all the data they need to make those insights themselves, leading to them still needing to reach out to the backend developers regardless. Or, they try ad hoc solutions that lead to more, niche dashboards That last part isn’t bad on its own, but it easily turns into a snowball effect of more questions, more ad hoc dashboards, so on and so forth ad infinitum.

Above: Visualising BI 2.0, where the manager tries to drill down, leading to the BI team creating ad-hoc reports.
So, are Dashboards Dead?
Maybe a slight exaggeration. They certainly have their place, aiding in qualitative judgements, capturing business logic, providing measurement against targets and productionalizing answering, “the what.”
That said, dashboards are incomplete.
The Next Level: Self-Service BI 3.0
Dashboards have their positives and negatives, but they certainly aren’t the end-all-be-all of data analysis. We’re moving on from, “the what” and trying to answer, “the why.”
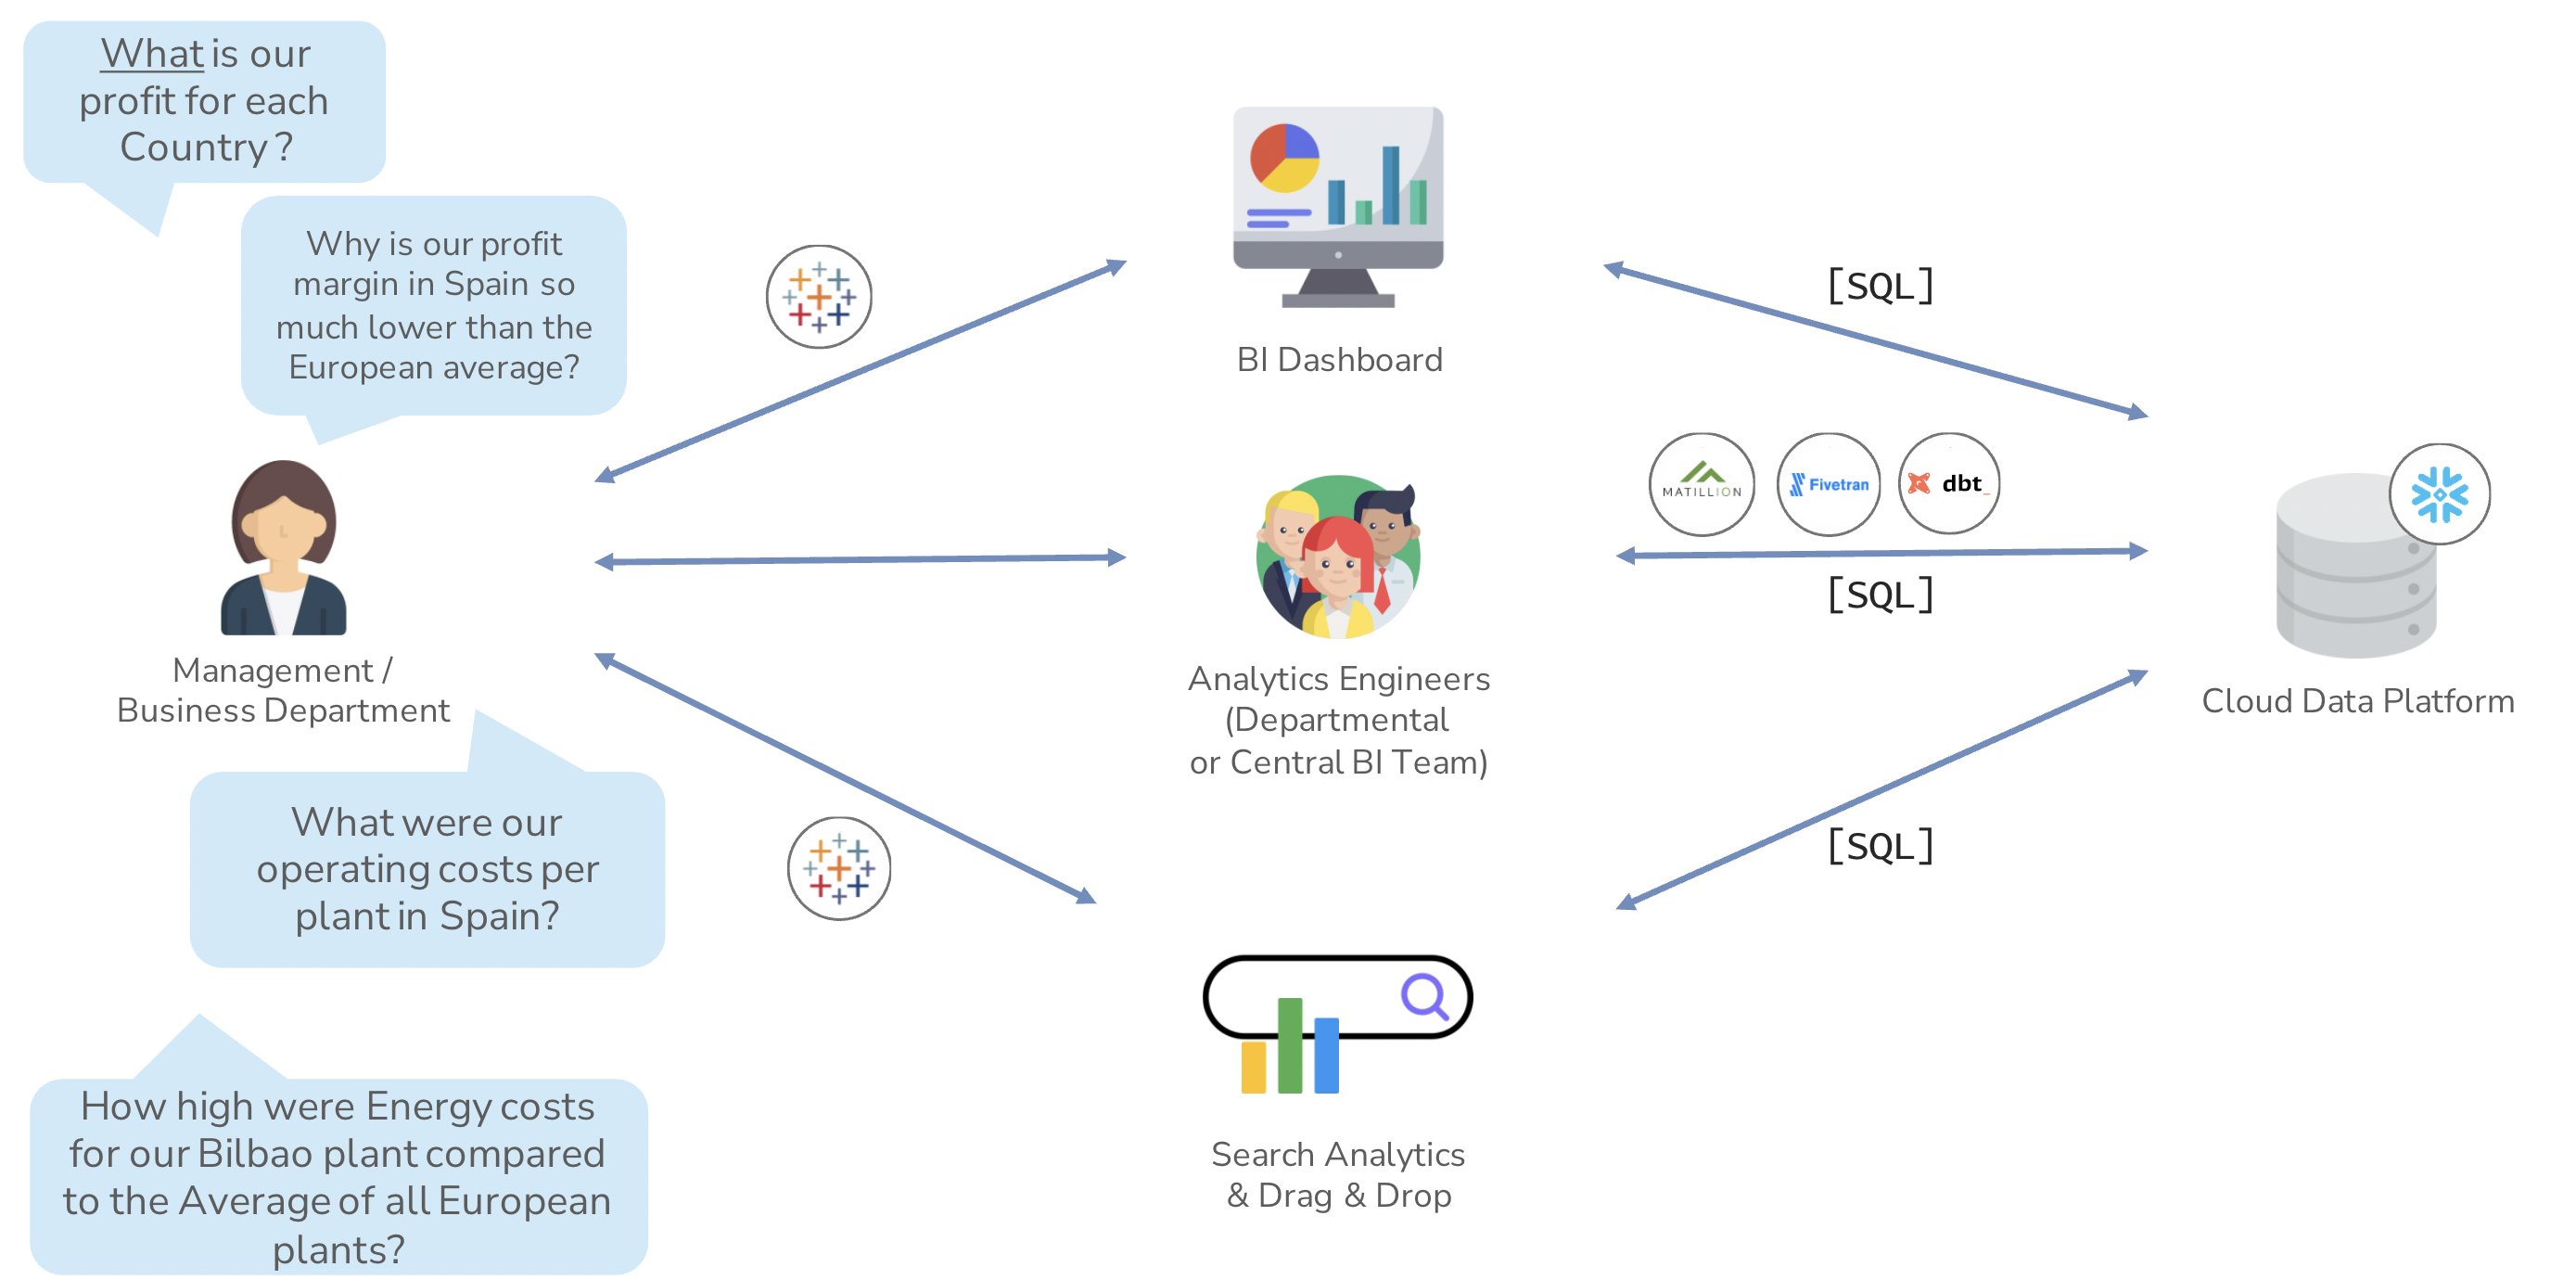
Under BI 3.0, should someone ask what their profit is in x region, they’ll still have a BI dashboard at their disposal. Should they want to drill down deeper into the insights of the dashboard, however, there’s a new player in the field: search analytics.
Instead of reaching out to a finance department or an analyst, the end user has more power at their fingertips to search for questions others have asked or to ask their own questions. ThoughtSpot, for instance, uses AI to power its search feature and provide insights quickly and as often as the user needs, right from their data.
To enable that, there needs to be a good data platform underneath that centralizes the data effectively and allows SQL to be used by both the dashboard and the search analytics. Additionally, a BI team comprised of analytics engineers is still needed to bridge the gap between analyst and data engineer in this ecosystem. They’re a hybrid, being able to understand user needs and having the technical skills to make the data available for the whole business.

Above: Visualising BI 3.0, where the end user has multiple avenues to drill down themselves.
For a visual demonstration of how search analytics works, it’s available in the replay above around the 21:15 mark.
What’s Needed to Make 3.0 Happen?
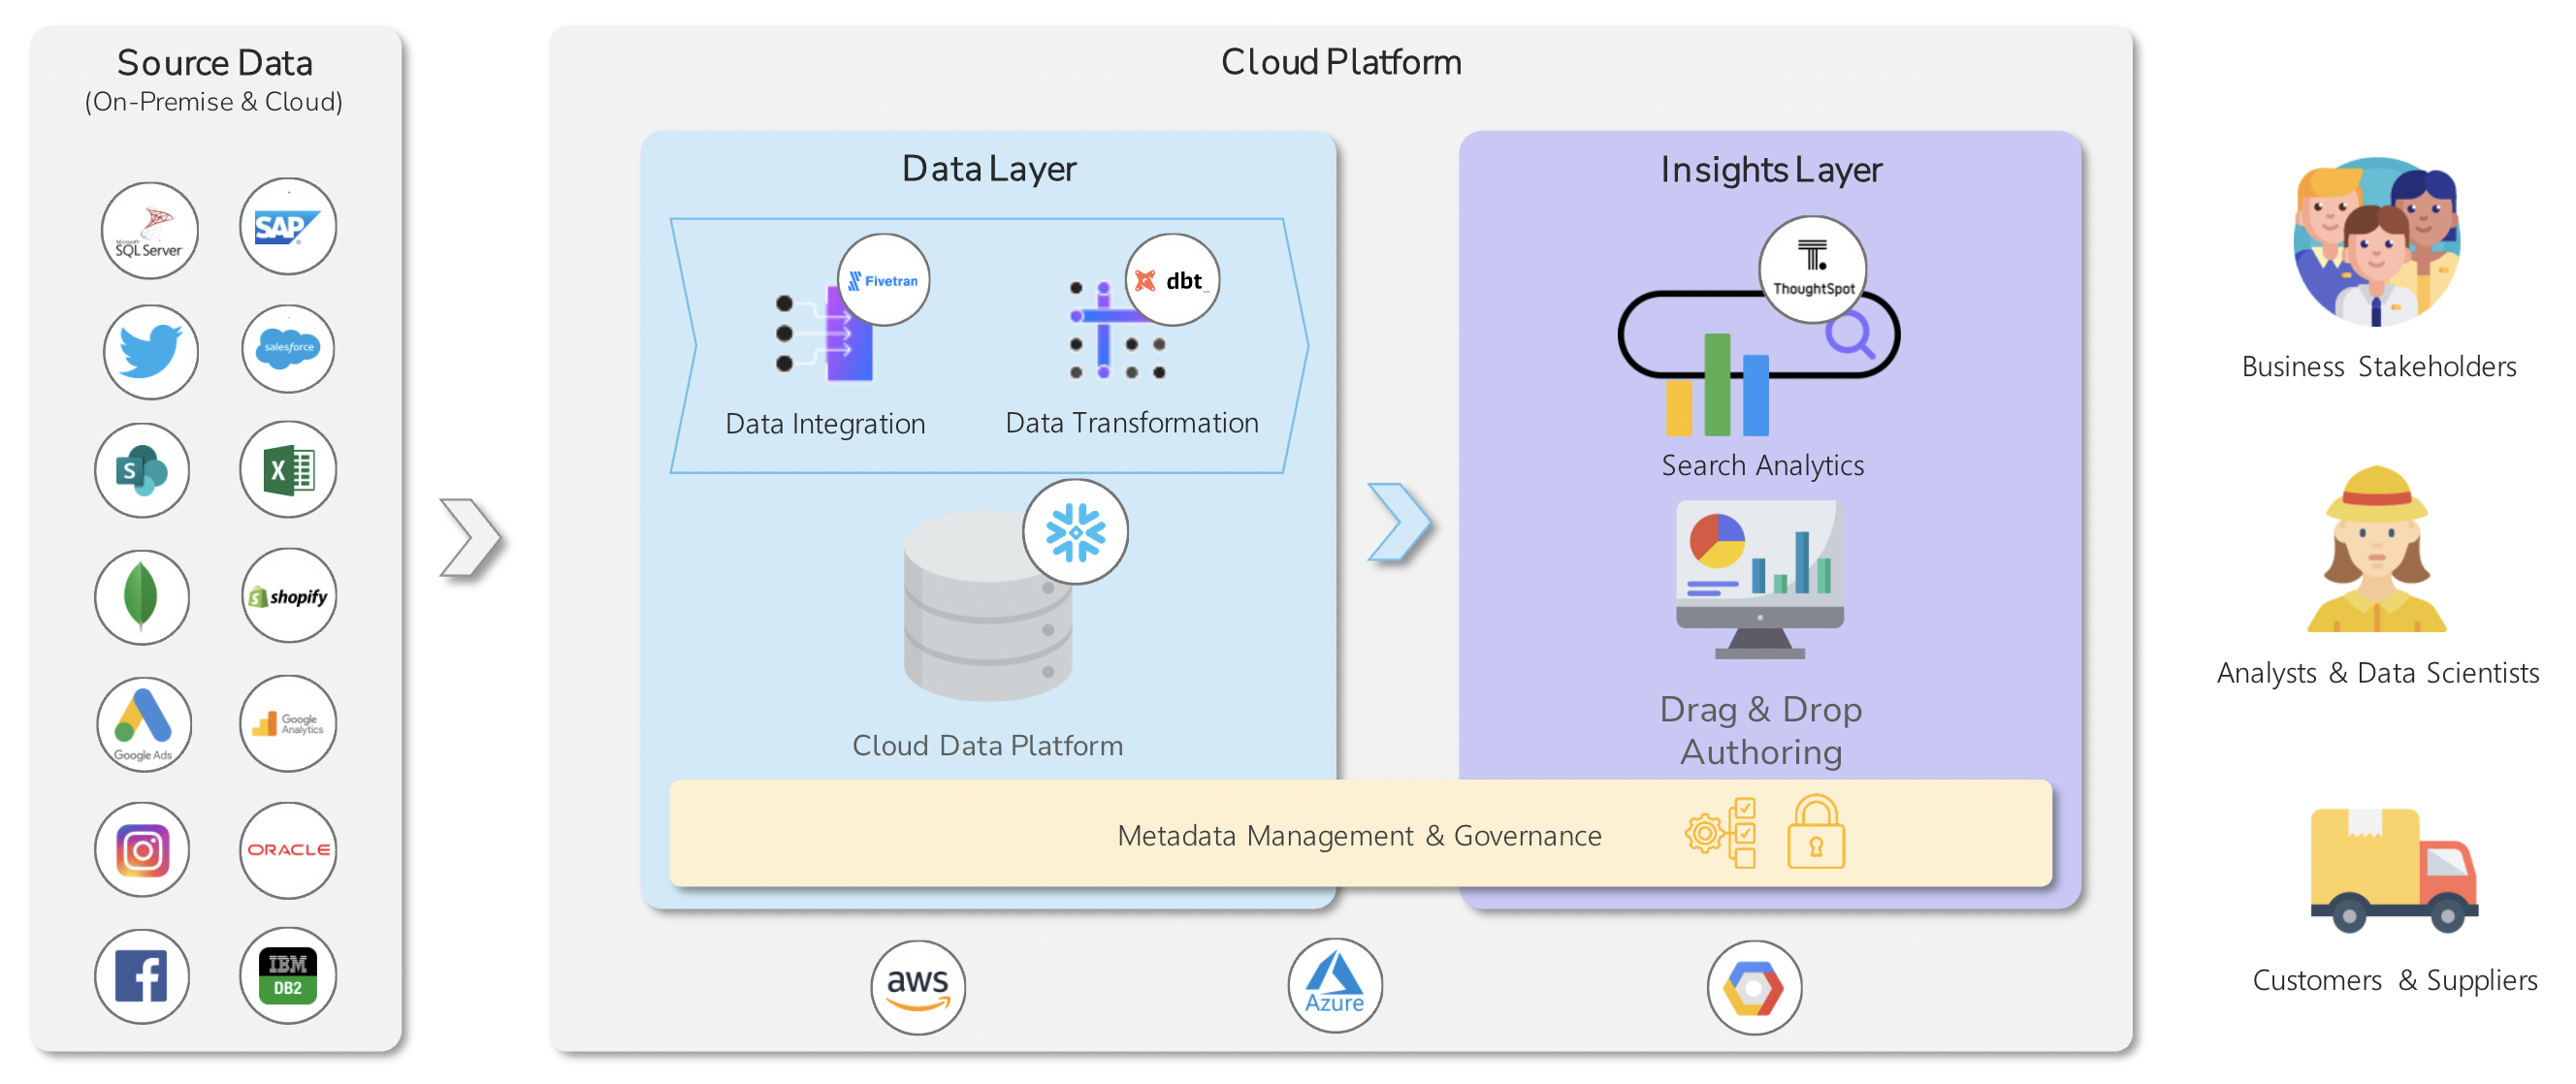
First and foremost, a modern data stack is needed. The “modern data stack” is a term coined by Fivetran, but we also have a special blend we call the “InterWorks data stack.”
Like all data stacks, it’s about moving the data to the people that need it: stakeholders, analysts/scientists, or customers and suppliers. To do that, we need the insights layer, where the search analytics live.
One step upstream from that is the data layer, where (as you might guess) is where the data is organized in the cloud data platform. You centralize the data by integrating it into the platform and transforming it using DBT.
To make it all secure and ensure that everyone only sees what they should be seeing, metadata management and governance stretch between the data and insights layer. This includes things like row-level security inside the database and access controls on the insights layer.
The whole data stack is hosted in the cloud using a software as a service concept to cut down on maintenance and update costs. Additionally, this setup scales with demand. You can start small, even with free trials, and scale as needed.

Above: Visualising the modern data stack.
The Modern Data Team
All in all, this technology is only as good as the people they use it. They’ll create the value from the database, but if they can’t use it properly, then that value is lost.
- The first group is the business stakeholders. These stakeholders must adopt an analytical mindset when it comes to data and be willing to collaborate with the wider data team. They should also be familiar with how to leverage their data to increase understanding.
- Next come analysts, who need to collaborate with the stakeholders, answer questions with data and carry out exploratory analyses. They’re charged with building dashboards, reporting on their findings and forecasting based on their data analysis.
- The previously mentioned analytics engineers provide knowledge of the data landscape, provide clean data set to end users and make data searchable, in addition to their role we discussed above.
- Data engineers manage the core data infrastructure while ensuring data is available and accessible across the organization at the expected time and at the expected quality.
- Finally, administrators manage integration of analytics into the organization’s IT structure and handle user and group management and authentication.
If you want to know more about how we envision Self-Service BI 3.0, or if you would like to work with us on your future projects, contact us and let’s see what we can accomplish together.


