
A video replay for this webinar is available at the bottom of the blog.
In this webinar, our analytics team covers what data prep looks like in a modern analytics stack and makes suggestions for a solid data prep environment.
The Data Preparation Process
When you’re going through the initial data prep process, there are four distinct steps that guide you from start to finish: exploring, cleaning, enriching and shaping:
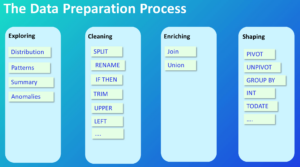
While this isn’t a comprehensive list, it’s a good bird’s eye view of what a standard data prep process might look like. It’s not out of the ordinary for analysts to spend well over 50% of their development time on data prep, and sometimes it can go even higher. A common statistic thrown around is that 80% of work time is data prep.
Modern data prep tools can provide great value while providing clear data much, much faster. Changes can happen at the “speed of thought,” instead of compiling and running code to see output. Additionally, it can be used by non-engineers and provide quick detection of issues. Finally, setting up a repeatable workflow through automation cuts down on prep time as well.
InterWorks tips for data prep:
- Create good data structures for analysis.
- Keep performance in mind.
- Avoid technical debt.
Create Good Data Structures for Analysis
This one is a little obvious, but when you use a framework or have a solid process for data prep, it makes everything easier down the line. You’ll have expected outcomes after cleaning the data, which can allow you to do faster analysis when you know what you’re looking for.
What we mean by expected outcomes can be found in Tidy Data, written by Hadley Wickham and published in the Journal of Statistical Software. To pull a quote from the piece (or rather, two), Wickham looks to the author of Anna Karenina, Leo Tolstoy, for inspiration:
“Happy families are all alike; every unhappy family is unhappy in its own way.”
– Leo Tolstoy“Like families, tidy datasets are all alike, but every messy dataset is messy in its own way.” – Hadley Wickham
Keeping strict rules for what piece of data goes where is a main key to data organization at a glance. There are three big rules for tidy data:
- Each variable must have its own column.
- Each observation must have its own row.
- Each value must have its own cell.
Keep Performance in Mind
Data prep, specifically for dashboards, can certainly have its performance improved before it ever gets to the production stage. If you want a more in-depth coverage of this topic, this blog post about Tableau dashboard optimization has you covered.
Using a portion of the Tableau whitepaper as an example, dashboard performance is dictated by four variables under the analysts’ control:
- The data we feed into the dashboard
- The calculations we use within Tableau
- The visuals, controls and layout of the dashboard
- The design of the user experience
When it comes to data prep, the first two of those variables are key: the data fed in and the calculations used. For the data part, a few ideas to use would be to limit the data size (like the columns, aggregation and filters) using well-modeled sources and materialize calculations in the data source.
To expand on the last point of materializing calculations in the data source, any complex logic that can be moved further upstream in the data pipeline will help performance downstream. For example, if any kind of calculations can be moved from being done in the extract phase to being completed at the source, that can trickle down into better performance overall:
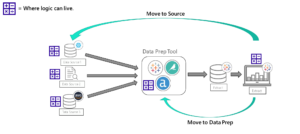
Regarding critical logic or calculations, it’s incredibly beneficial to move them to a more governed area, which may require the help of some data engineers.
Avoid Technical Debt
There are long-term costs to short-term decisions. That statement is compounded when the short-term decisions are bad ones. Poor documentation, inconsistent naming conventions and rushing prototypes into production all accumulate technical debt. With technical debt, the payment invariably comes due at the worst possible moment.
When building out similar pipelines, try to avoid redundancies wherever possible. Streamlining something that already exists instead of building out something similar but slightly different may work better in the long term.
If you’d like to see this presentation in full, the replay is listed below. If you’re wanting to sign up for any future webinars or just see what we have in store, check out our webinar page.