This series examines all things date-related in Tableau and shares best practices for optimal processes.
In the previous post, we discussed the benefits of supplementing traditional to-date reporting periods with rolling periods. In this post, we will dive into the optimal practices (and not-so-optimal practices) for creating the logic for effective Date Selection calculations in Tableau Desktop.
Common Date Functions
Before we get too technical, let’s review some of common date functions we will use:
DATETRUNC()
- Returns the first day in a given period based on the datepart (day of month, quarter, year)
- Example: DATETRUNC(‘quarter’, #3/16/2021#) will return 1/1/2021, the first date of the quarter relative to 3/16/2021.
DATEADD()
- Used to add or subtract date parts with negative/positive numbers to return a given date
- Example: DATEADD(‘quarter’,-1, #05/16/2021#) would return 2/16/2021, the date one quarter prior to 5/16/2021.
- Note: This is most useful when moving in date parts like month, quarter or year. If moving in units of days, a number of days can be subtracted directly from a date.
Anchoring Dates
In production dashboards, our date logic must be anchored to something. For example, current Month to Date sales pulls all of our sales for the month anchored to TODAY(). Our user might be interested in that anchor being a fixed date, or they might be interested in having the ability to toggle between different dates. In order from ordinary to optimal, these are how we rank the following anchoring methods:
- Ordinary: TODAY() function hard coded in separate calculations
- Better: TODAY() referenced in single calculated field used across calculations
- Optimal: Parameter updated to show TODAY(), {MAX([Date])}, or a static Date Parameter
Time Period Selection
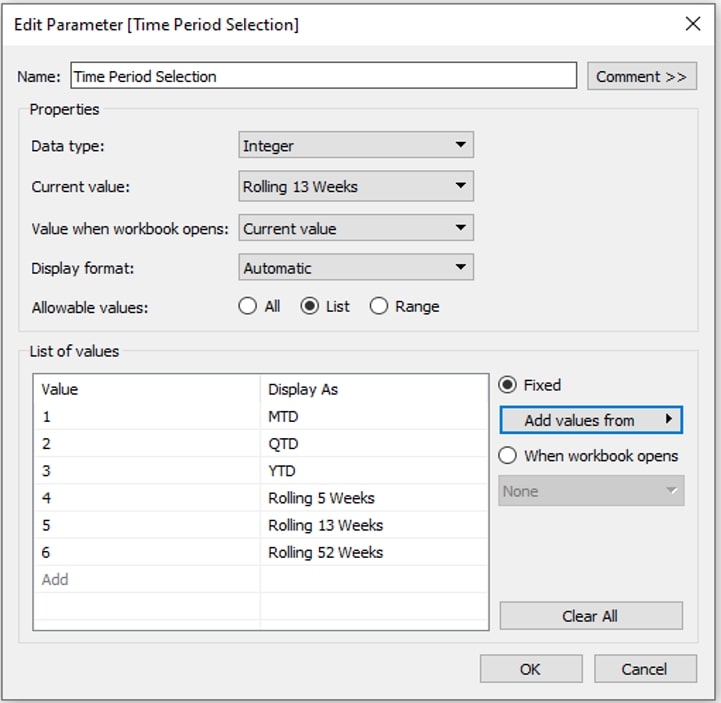
After deciding on an anchoring method, we provide our user a method to toggle between the date periods we create. In most cases, we will use parameters to accomplish this. In the example to follow, we will work from the below parameter. Note that we utilize integers, but strings are equally performant and can make the logic easier to read:
The Case for Centralized Date Logic
Here at InterWorks, we like to construct Tableau workbooks that are efficient, performant and scalable. If there is one tip to take with you from this post, take this: centralize your date logic.
The immediate benefits are:
- Fewer calculations to update/maintain
- Optimal performance
- Ability to scale up
Let’s look at an example of why we would want to do this.
The Ordinary
We are tasked with showing Sales performance at the current and prior Month-to-Date, Quarter-to-Date and Year-to-Date levels with corresponding rolling periods to make comparisons against. We create the following calculations for the current and prior period sales metrics:
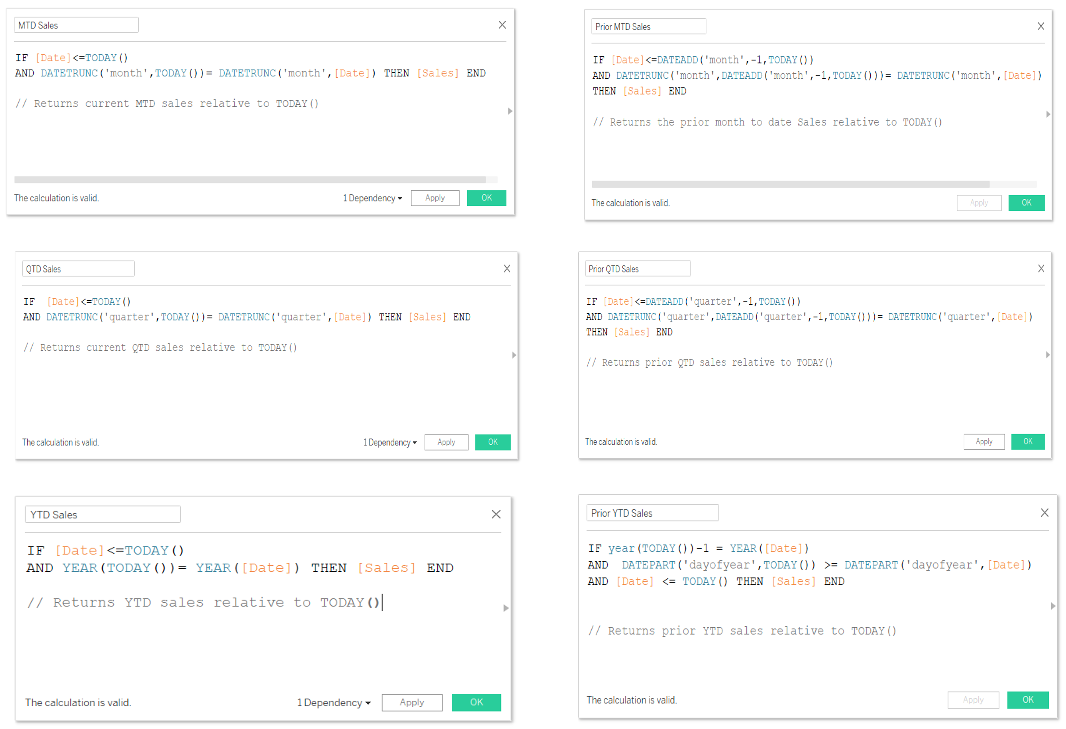
Above: Explore the full suite of calculations in the downloadable .twbx file at the bottom of this post.
In this example, we have a handful of calculations to maintain for our report. Maintaining this type of workbook as we scale could become problematic. If we need to make updates to what our sales should anchor to, we need to update every calculation. For example, we realize that our data lags a bit and that our logic should anchor to TODAY()-1, or we realize that we want to replace it with a parameter to be able to adjust the date.
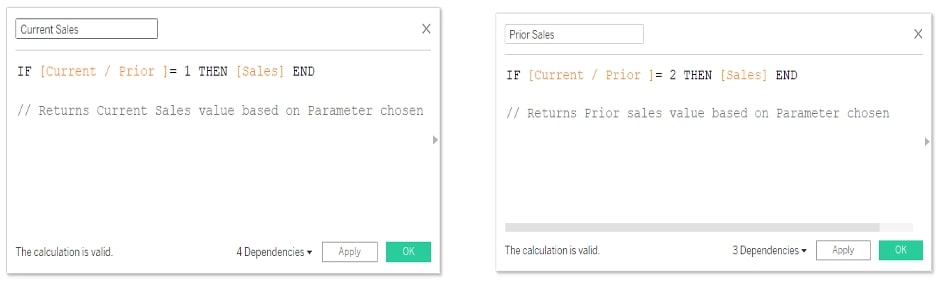
If we want to pull out the current and prior values, for the date period selected in our parameter, we create the following calculations:
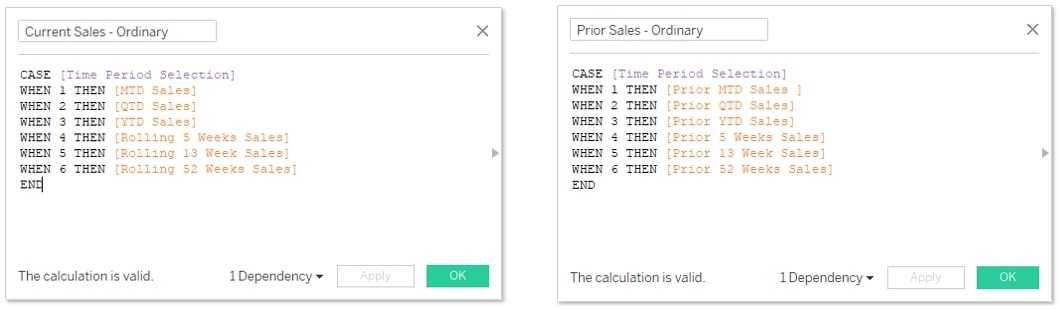
If we needed to add a new time period selection option, we’d need to create new calculations for the current and prior period, adjust the parameter for this new time period, and add the new calculations to the above current and prior calculations so that the parameter functions correctly. Whew.
The Optimal
Our ask is the same: creating a view with current and prior Sales performance by Month-to-Date, Year-to-Date and Quarter-to-Date with accompanying rolling periods.
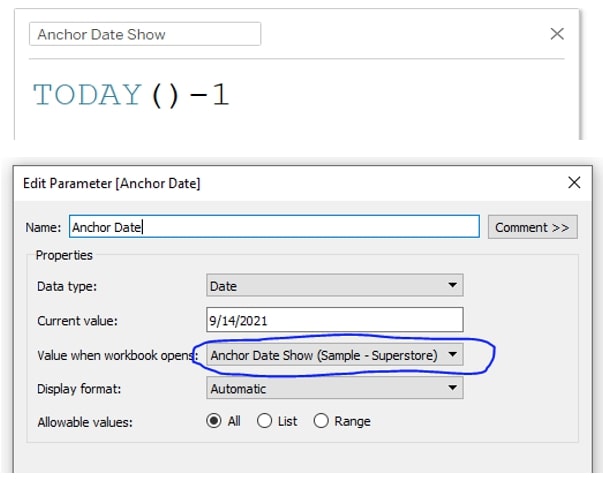
We refrain from using hardcoded TODAY() functions in our logic by using a Date Parameter as our anchoring method. We set the current value of this parameter to display TODAY()-1 when the workbook opens and allow the user to toggle different dates to view performance at different points in time:
Now, as opposed to the many, many calculations we created in the prior example, we can build one calculation to house our current AND prior period date selections:
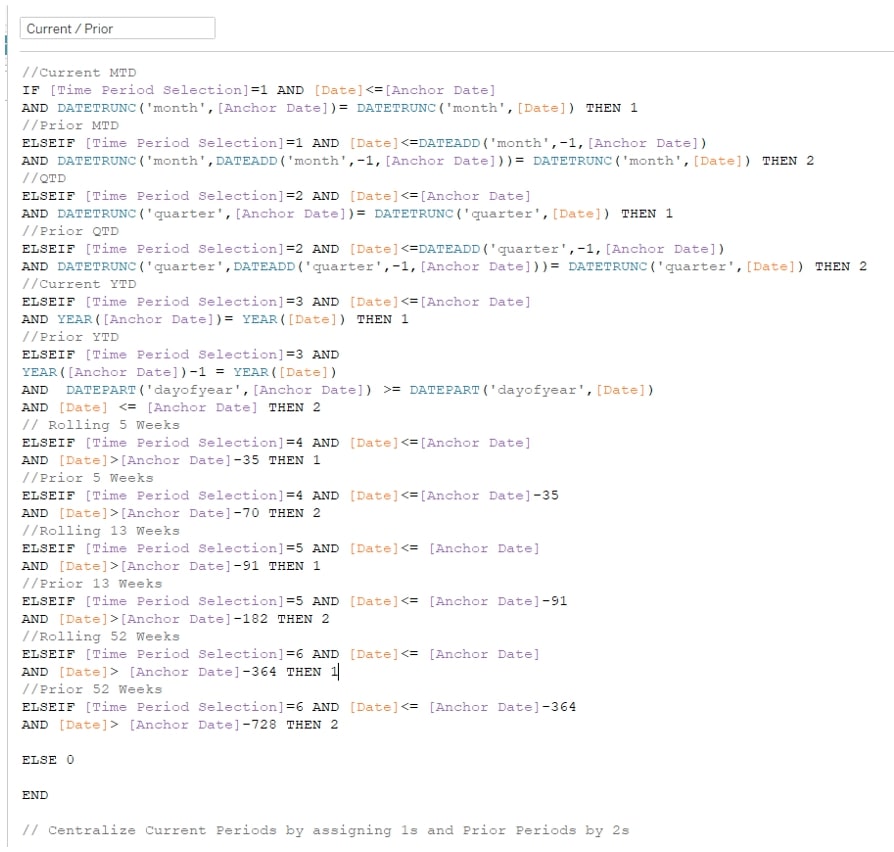
Above: Instead of having to maintain separate calculations for each time period sales value, we have one calculation that can be updated when we need to add or remove time periods for users.
This method allows us flexibility when we need to separate current and prior period values. For example, to show both current and prior periods, we can place our aggregated measure onto a viz and the [Current / Prior] calculation onto Color or Detail. We can also show current and prior periods separately by creating a quick calculated field from our [Current / Prior] field to distinguish them:
If we needed to add or remove a new time period selection, we only need to add it in our parameter and in the [Current / Prior] calculation. Centralized date logic provides us the luxury of maintaining fewer calculations while mitigating the risk of potentially damaging your dashboard’s date logic as your organization makes changes on what time periods they want to see.
There Is a Method to the Madness
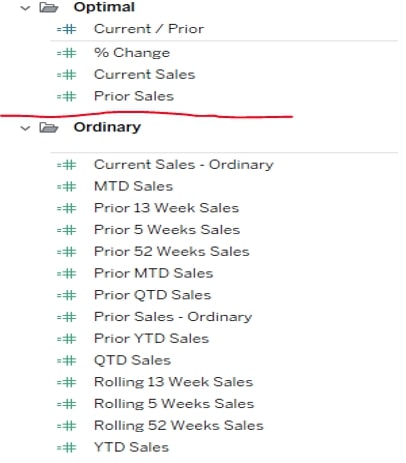
To provide the final argument for using the optimal instead of the ordinary with date selection logic, I have provided a screenshot showing the number of calculations one would have to create and maintain in both scenarios. I will allow you, the user, to make your choice!
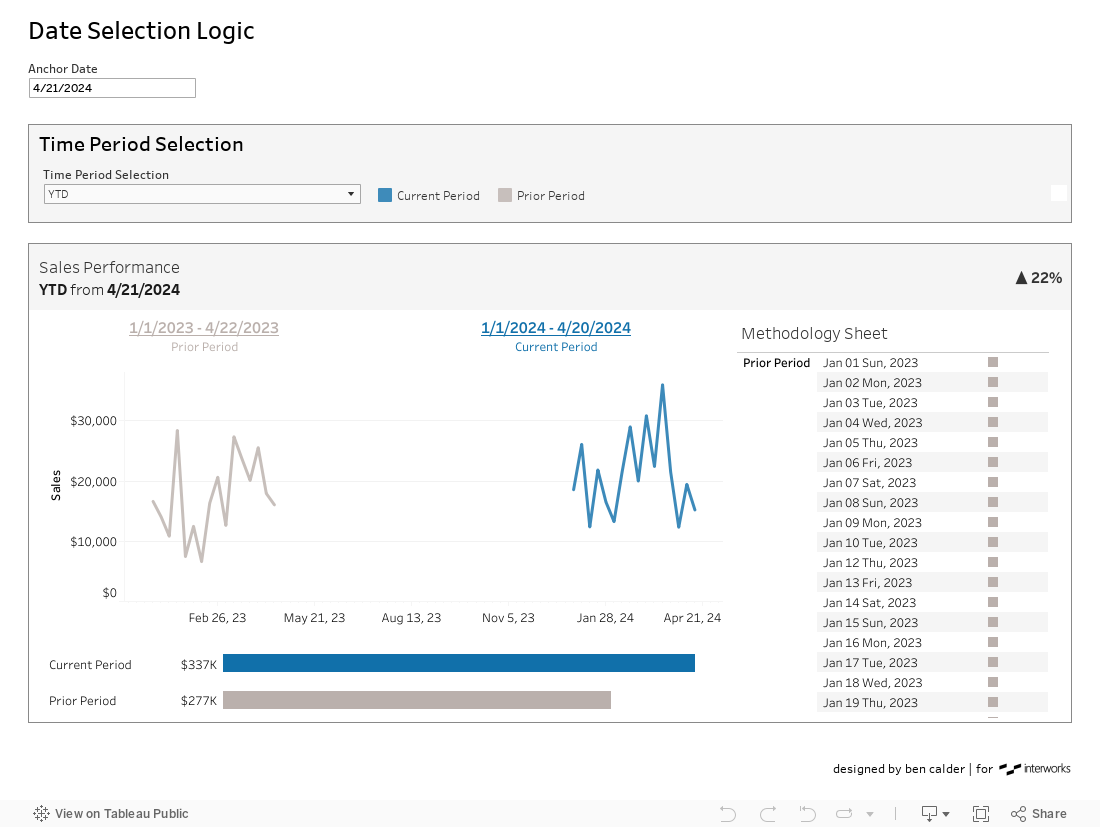
Take a look at the dashboard, or download the .twbx file to see how we like to construct effective date selection logic.
Oftentimes, we provide clients with a methodology worksheet or scratch sheet to test/prove how a calculation or set of calculations works together. We provided one in the example dashboard here to provide additional context into how the logic works.
Feel free to reach out to us if you would like to start the conversation about optimizing your date selection. Stay tuned for the next post in this series as we continue to understand dates.