This series examines all things date-related in Tableau and shares best practices for optimal processes.
A common question we field is how to create current period and prior period selections in Tableau to show % changes in periods. Popular periods include the To–Date family of Month to Date (MTD), Quarter to Date (QTD) and Year to Date (YTD). To-Date periods have a fixed starting point and provide a hindsight view of performance in a period. For example, when looking at YTD on the last day of December, the entire Year-to-Date’s worth of data is seen:
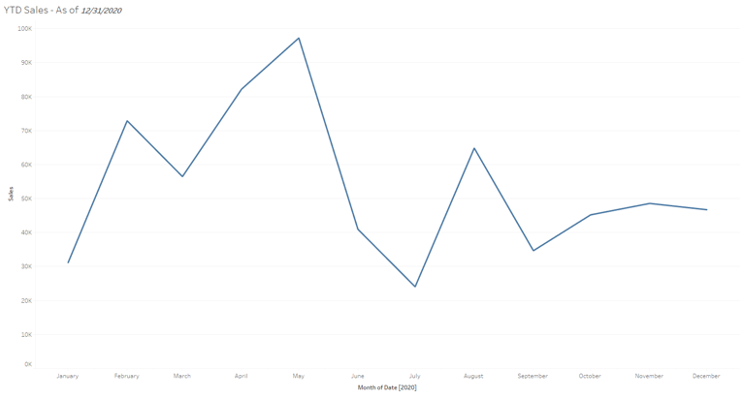
Above: Year-To-Date in this circumstance provides a holistic view of the year.
To-Date Periods in Tableau
When building MTD, QTD and YTD periods, we can run into limitations in analysis. With traditional ‘to-date’ periods, our start date is fixed, usually to the first day of the period.
For example, YTD means we can see data from the current date to whatever our fixed start date of the period is. It is a fixed hindsight view. In the above example, YTD provides a nice view of our sales trend. However, when we are looking for these insights during the beginning of periods, we can often run into something like the following:
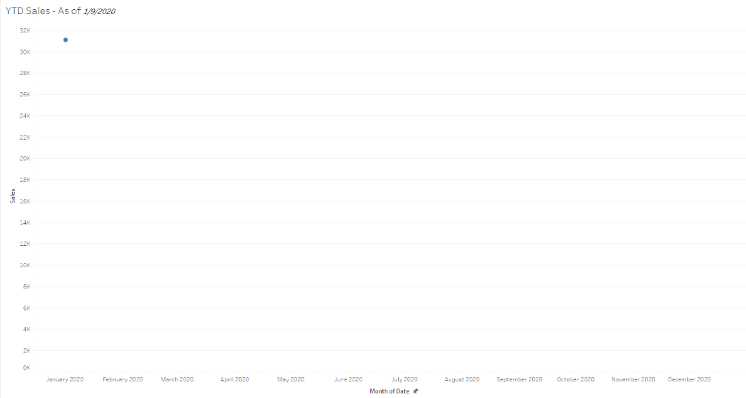
Above: Year-To-Date in this circumstance provides an incomplete view of the year because there is not enough information to complete the period.
The above view is accurate as we can see the entire year’s worth of data. However, we only have data through January 9, so our to-date view is not all that helpful. This view does not give us much information to digest.
The issue is that the To–Date view is dependent on when we are viewing the information. Traditional reporting waited until after a period was over to provide a summary of the period. As data has now become available to refresh on a daily – or even hourly – basis, this date selection that is dependent on the period being complete prompts us to consider some other options. As we can see above, during the beginning of periods, to-date views can provide incomplete pictures that may leave a user seeking more insights.
To provide insights that are as effective during the start of a period as they are during the end, we can supplement our options with rolling date periods. Unlike To–Date date periods, rolling periods will provide insights that steadily roll forward based on the most recent data available.
Rolling Dates
To provide added context when we are looking at trends during the beginning of periods, rolling date periods make a lot of sense. Instead of limiting ourselves strictly to ‘to-date’ periods, we can add comparison periods such as prior five, 13 or 52 weeks.
The immediate benefit we achieve with rolling dates is that we always have complete periods of time to compare because we aren’t fixed on the start date. An additional benefit of rolling periods is that the comparisons are more accurate since they contain an equal number of weekdays and weekends.
For some organizations, such as a factory that runs non-stop, this might not make much of a difference. However, most businesses see a difference in activity between weekdays and weekends. For example, if we were to look at the complete month of July in 2021 vs. 2020 for a business that is only open on weekdays – assuming they did exactly the same volume of sales every weekday – we would see a roughly 5% dip in monthly sales in 2021 vs 2020:
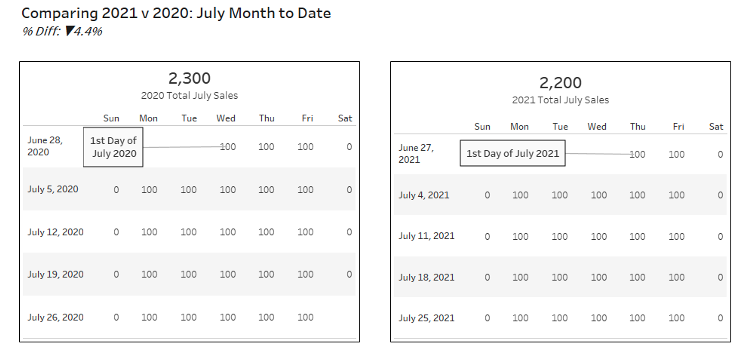
Above: Though showing MTD, our rotating calendar shows an extra weekday in July 2020, and our sales see a bump that is not very telling.
This dip can be attributed to our calendar structure. August in 2021 has 22 business days and nine weekend days, while August 2020 has 23 business days and eight weekend days. For more accurate comparisons, we should select for time periods in blocks of seven days, or weeks, regardless of what we consider the first day of the week we are counting from.
When comparing these months with rolling periods in mind (the last five weeks from the end of the month), we account for the same number of business days, and we can see a more accurate performance metric:
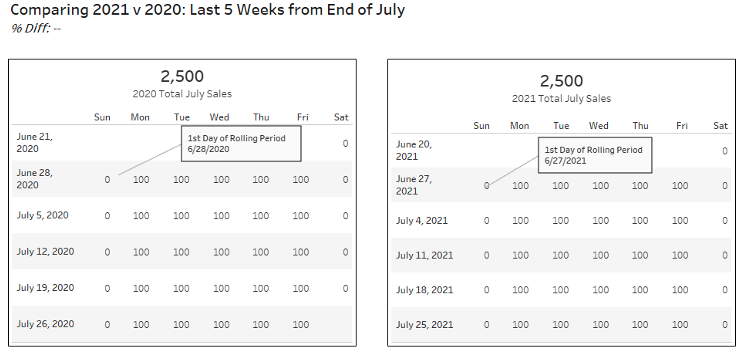
Above: By comparing with rolling periods, we account for the same number of business days (25) in the rolling period.
Unlike the Month to Date view where we leave our user wondering where the 4.4% dip came from, the rolling view provides a more accurate representation of performance.
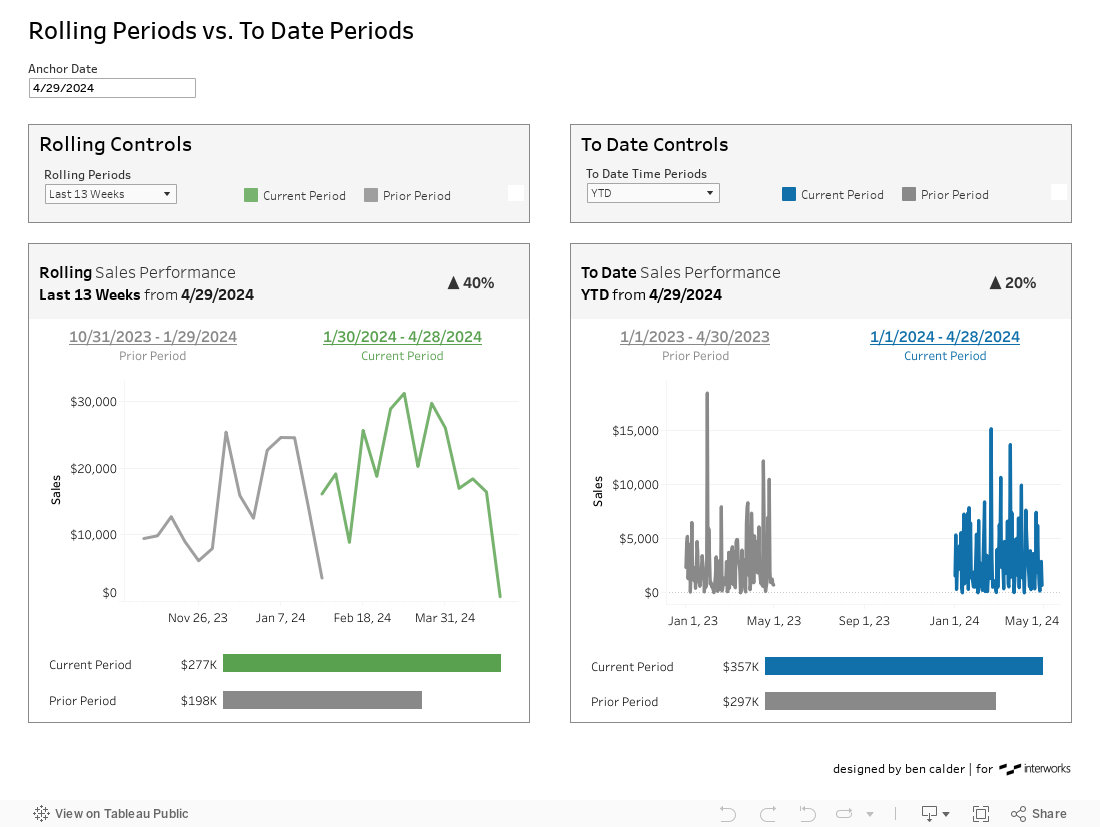
Have a look at the dashboard below to see what differences exist when working with to-date periods vs. rolling periods.
More Tableau Time Period Tips to Come
Feel free to reach out to us if you have questions on what comparison periods make the most sense for your organization. Stay tuned for the next blog post in this series where we will get into the weeds of building out these types of periods in Tableau!