
We don’t have to re-invent the wheel when it comes to making improvements. It’s about taking what we have done and making minor improvements to improve efficiency. With Tableau to make these minor improvements it often means doing the work in advance.
So why is performance important? The longer people have to wait for assets to load, the likelier they are to abandon the effort altogether. This applies to Tableau, too; the longer a workbook takes to load, the less likely people are to hang around and engage with our content. Valuable insights will be lost, and adoption of analytics will flatline. So, how can we optimize Tableau performance? Let’s look at four key areas.
Optimize Your Data Sources
- Your Tableau experience starts with how you are storing your data. Are your data sources extracts instead of live connections? We would always encourage you to make the most of Tableau extracts as they always reduce the number of queries Tableau is forced to run.
- If you are using extracts, are they filtered to bring in the relevant data?
- Are you able to aggregate this data up to the level of detail that you need?
- If you have calculated fields in your Tableau workbook, can you place them somewhere upstream? Can you place them back into the database ,so they are more native by the time they reach Tableau?
Optimize Your Data Connections
- Do we have the opportunity to minimize joins? Can we reduce the amount of data we can access based on the project that we have have? A great solution is to place your table or connection into a view, so Tableau doesn’t have to do that work at all and can focus on what it does best: visualization.
- Additionally, you can use data source filters to limit the amount of data we’re bringing into the workbook. This will help Tableau with its load time and query processing.
- An even better solution might be filtered extracts, so we’re only connecting to the rows of data we actually need.
- Finally, after you have built your visualization, you might want to hide unused fields. This will not only improve the performance of your workbook but it will also improve your own organization as you navigate your Tableau Desktop workspace.
Optimize Your Tableau Workbooks and Server
If your Tableau Server is under-resourced, you will see performance issues! All these elements need to work in tandem with one another.
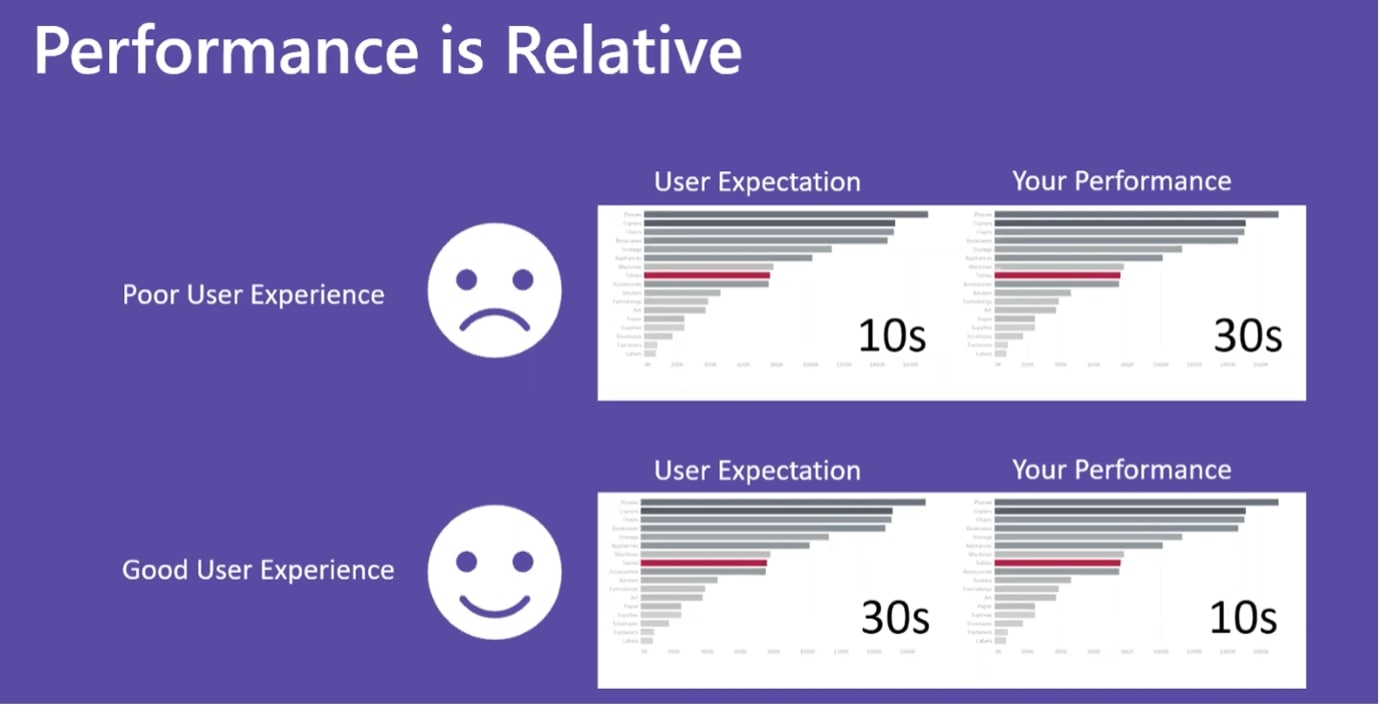
Above: Even a handful of seconds’ difference can affect a user’s experience.
Now. when it comes to optimizing your workbooks, that’s where we’ll be spending the bulk of our time in the rest of this post. Let’s start with how calculated fields can affect our workbook performance.
First question: Can the field be put in the data source? Let’s consider how often it will be used. Is there someone who can put the field back into the data source for us ,or can we do it ourselves? The bigger question is this: is the effort worth the reward? If this is an ad hoc calculation, it might not be worth placing it back into the data source.
NOTE: If you can avoid using Custom SQL by putting that calculation back into the database and accessing it by a view, we would recommend doing so.
Another consideration when using calculated fields is the type of data we are creating:
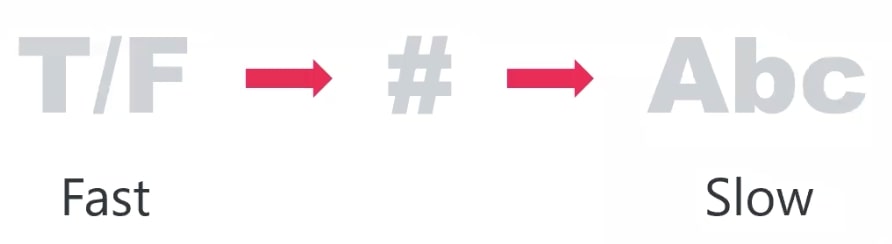
If we can use booleans or numeric values, those will be faster than strings. So anytime we can use a calculation or parameter, Tableau is going to be quicker to evaluate that. A great example would be when we are creating a value for some time of measure slot, e.g. maths, science, art and English. Instead of typing all of those out in a parameter, enter the values 1, 2, 3 and 4, and Tableau will be quicker to process that if you assign those later.
A good rule of thumb if you are using logic statements:
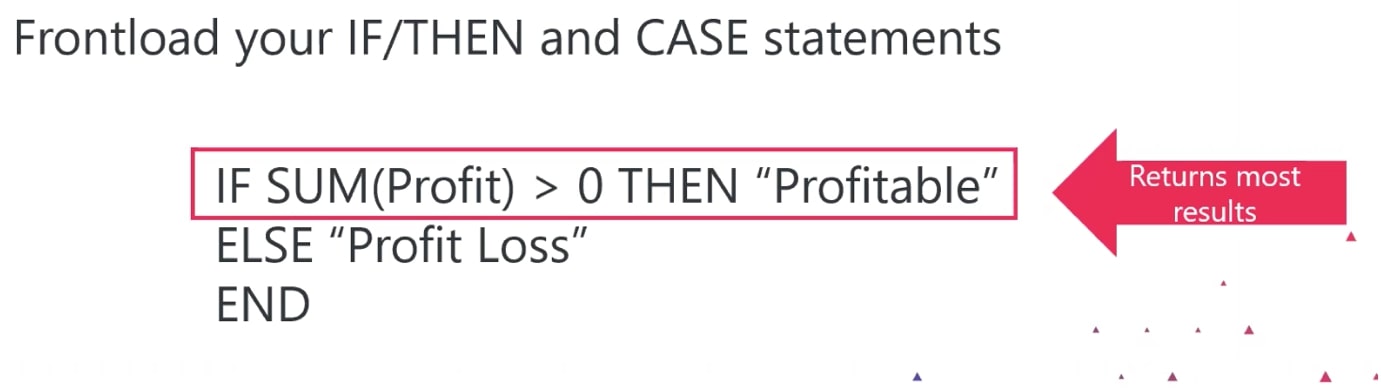
It could be really helpful for you to frontload your IF/THEN and CASE statements. Try to find the value that will return the most results within its first criteria.
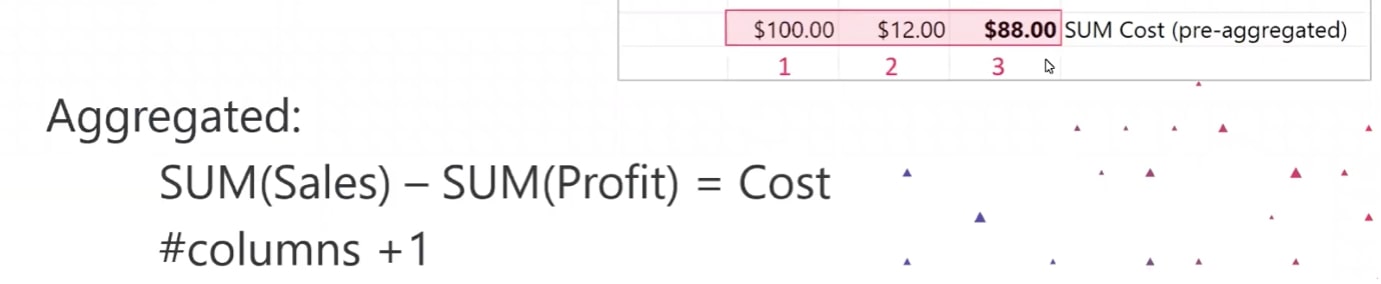
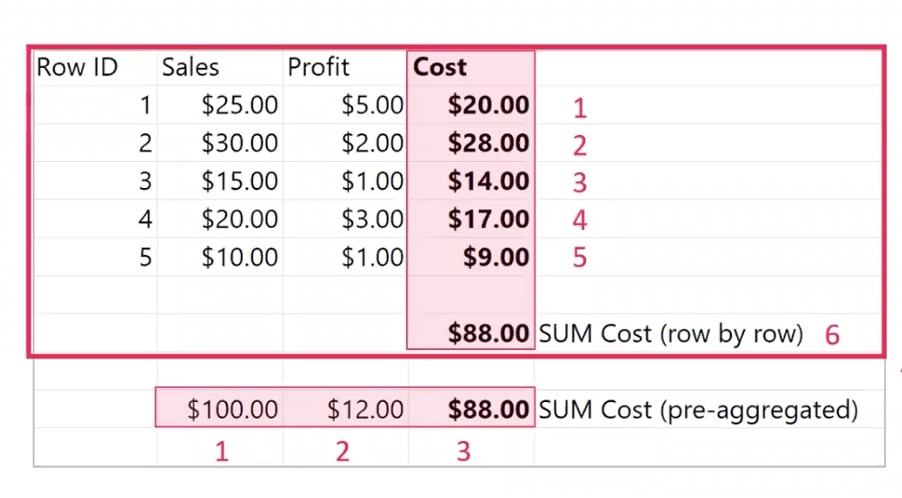
Can you pre-aggregate?
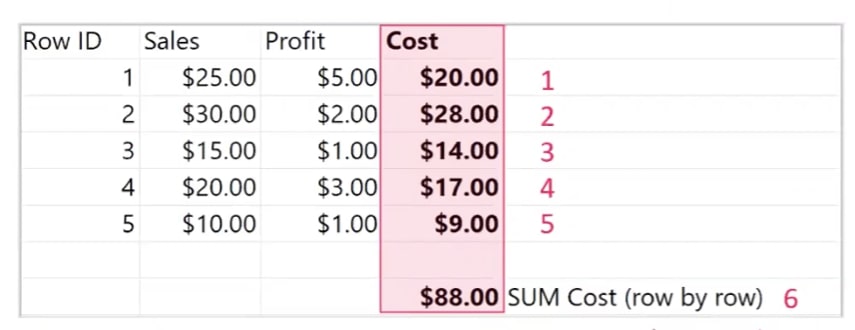
There are different types of calculations we can perform within Tableau as well. In this example, we look at row-level calculations. With this row-level calculation, Tableau has to perform more queries than if this was aggregated. If we are calculating on every row you have, this can add lag overtime.
By aggregating each column first, Tableau is only querying a fraction of the data:
NOTE: Level of Detail (LOD) calculations follow the same logic as row-level calculations in Tableau:
If you can use LOD calculations sparingly, you should do so as they can be really costly to the overall performance of your worksheet. However, we recognize the power that LODs have, so use them with purpose.
Is there already a native Tableau feature? Take advantage of what Tableau has already built for you:
- Splits
- Hierarchies
- Groups
- Relationships (v2020.2). With this feature, we have the opportunity to improve overall performance by using a blend. It will allow for a more efficient way to bring datasets together.
How Filters Affect Tableau Workbook Performance
Extract filters will allow you to limit your data to what you actually need to use for your analysis. Bring in to your Tableau data source only the records you need. You can also use Tableau data source filters, which keep the data in your data source while limiting what goes into your Tableau Desktop workspace. Your data is still present, but Tableau is querying less, which is a performance improvement.
Context filters can be used to filter data going into the view. These are applied before all other workbook filters. By happening first, they reduce all other filters that happen after that fact. This is great when working with only a specific sample of the dataset, i.e. a specific department of the organization.
Cascading filters are a fun trick you can use that provide a more detailed view of data when it is highlighted. This is a great thing to consider when building your workbooks to improve load time.
Cardinality’s Impact on Performance
Cardinality refers to the number of items in a dimension, set, parameter or group:
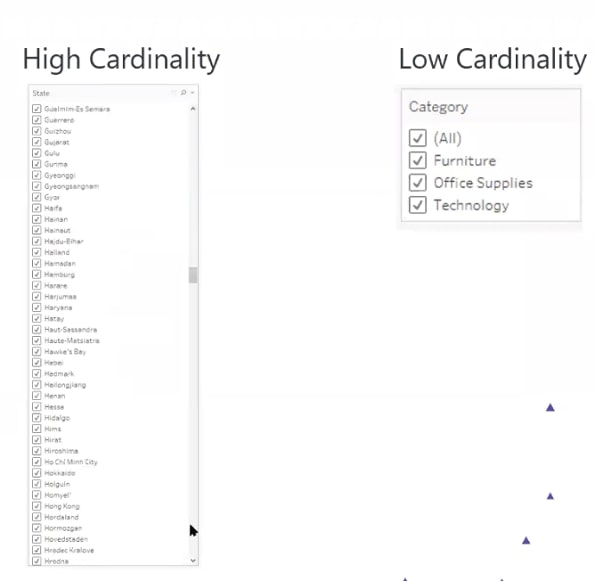
High-cardinality lists take way more time for Tableau to populate and render and for you to conduct searches. If you have the opportunity to reduce the number of items in quick filters and parameters, it will ultimately increase your worksheets’ overall performance. We know this isn’t not always an option, so you can try one of these:
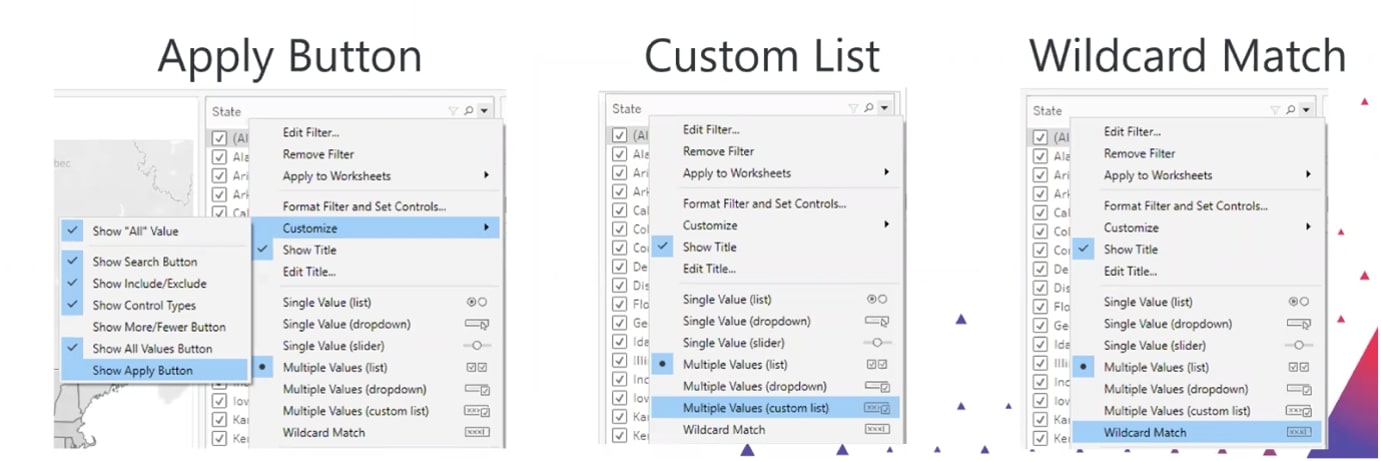
- Apply Button – Tableau will only run a query after you finalize the selections you wish to analyze.
- Custom List
- Wildcard Match – Tableau isn’t automatically rendering the list; it waits for you to tell it what to find.
For parameters, you can also use CONTAINS() functions:
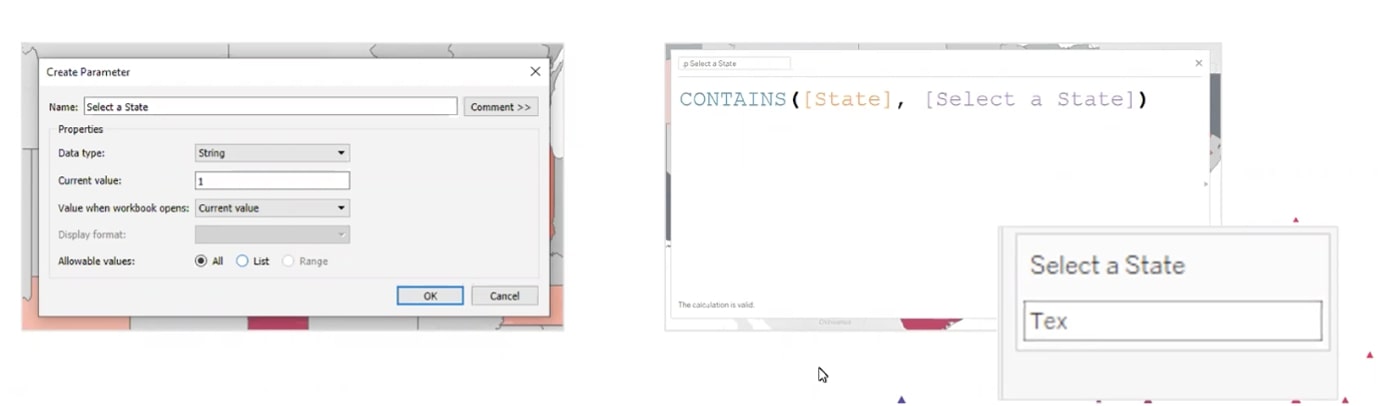
Again, this saves Tableau time from rendering long lists. If you are trying to blend on long lists of many too many matches, a better option would be for you to try data relationships in 2020.2 and beyond:
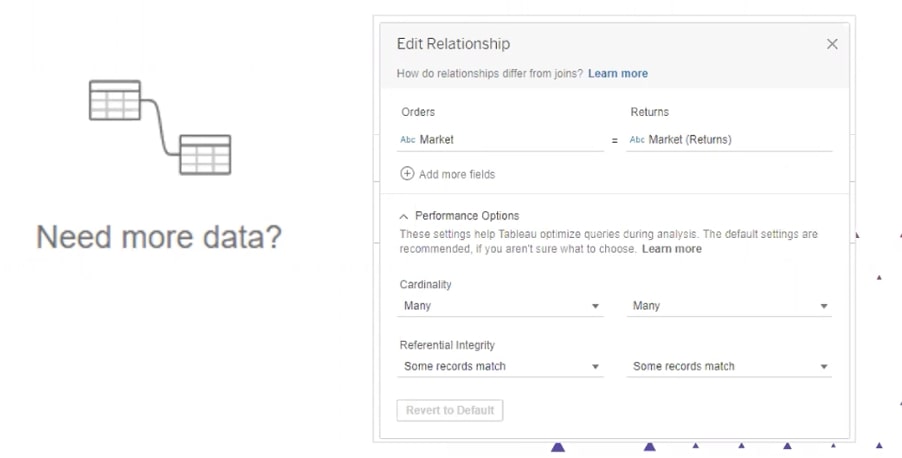
Tableau Dashboard Optimization
Once you have improved your Tableau workbook with calculated fields, workbooks and cardinality, we now look at dashboard optimization. Here are some things to consider:
- Number of marks on a worksheet
- Excess marks can impact performance.
- Try limiting initial mark load. You can use filtered data, so users can add marks as they need them.
- Display only relevant detail to reduce marks.
- Cascading filters are an option. Start with a high-level overview and only use detailed marks after a user has made their filter options.
- Number of worksheets on a dashboard
- Too many worksheets can impact performance.
- Tableau improves often; there is no hard-and-fast rule
- Try the Tableau Performance Recorder.
- Dashboard sizing
- Avoid automatic sizing on dashboards.
- Fix sizes to meet the needs of the majority of users.
- Reduce Tableau Server caching of dashboard sizing. If you have 1000 users all accessing your dashboard, Tableau will automatically cache based on the type of device that the user is accessing the dashboard on, using up valuable resources.
- Workbook size
- Excess dashboards can impact performance. Recognize that heavy workbooks take longer to process, so test the performance and see how your workbook reacts.
- Connect related dashboards in Server using URL links.
Dig Deeper into Optimization
Bringing all of these factors together to do the heavy lifting before you start using Tableau will significantly increase the overall performance of your dashboard. We have a number of resources to assist you in dashboard optimization, and don’t forget that you can watch this full webinar below:
- Tableau Performance Optimization Workflow
- Tableau Server Performance Monitoring Overview
- Record and Analyze Workbook Performance