
In its new version 2020.2, Tableau is about to release a quite revolutionary feature that will change the way we set up our data sources. Its impact is biggest where database admins have long found their way to solve the issue, and newcomers to data visualization need to be very careful and get their head around avoiding data duplication. Now, this can be avoided by a simple, curvy line called “the noodle” that handles data relationships based on your vizzes. If you have not heard about it yet, you might want to start with this post where Eugenia gives you all the details about this cool new feature.
“What about my cool dashboards that I have already built and deployed?” you may ask. Don’t worry, existing data sources have been taken care of as being migrated to the physical level of data sources automatically. Any prior existing data sources you are opening will now be shown as a single logical table called “Migrated Data”.
In this blog post, I am going to show you the difference between the new feature “relationships” and the pre-existing ways of making your data wider. Through direct comparisons, you’ll be able to compare strategies to help choose the best option for your scenario. Let’s start with a short recap of the new feature.
Relate Your Data Instead of Merging It
This is where “the noodle” comes into play, and it is the new default data source screen if you open from Tableau 2020.2 and onwards. The main reason why you should use relationships (if possible) is that joins will only be executed where necessary, so you do not need to drag along this perhaps very wide table that you set up just for this one specific analysis.
Further, you no longer need LOD calcs to control for the right aggregation level. This is great news as LODs are powerful but also had a negative impact on performance. Now that we can avoid them in many cases, performance of our dashboards can be boosted. The right level of aggregation is now controlled by Tableau. Depending on your visualization, Tableau will decide the most performant way of merging your data together. This first example shows you how easily you can bring two tables together that have different levels of aggregation:
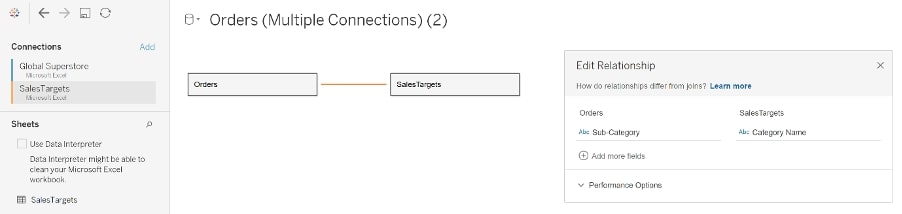
Above: Setting up the data source using the new data model.
The curvy line shows a relationship between Orders and Sales Targets based on the Sub-Category.
Above: Setting up the data source using the new data model.
The curvy line shows a relationship between Orders and Sales Targets based on the Sub-Category.
In general, I like to think of the new data model as a more abstract layer—one that database designers like to use when they structure a new database. When designing a database, they do not have specific questions or analysis in mind but want to set up the database as broadly as possible so that it fits many users’ requirements. Databases need to be maintainable, as do data sources. It is crucial to stay on top of things especially when you are working collaboratively on projects.
Having as few data sources as possible helps keep your workbooks clean and simple. Then again, sometimes, you need to be more specific because in Tableau you do have specific questions in mind you need to answer. So, let’s look at when we would prefer relationships over joins and vice versa.
Relationships vs. Joins
Scenarios, like the one in my previous example, may have been one of the main reasons to develop this feature. This certainly could have been solved previously using joins. However, beware of data duplication. If you thought of AVG( ) or LODs to avoid the duplication, that is a valid option. It may only possibly affect the performance of your dashboard negatively as I mentioned earlier.
But what if you still need to do joins; is that still a possibility? Of course! There are some cases where you would still need to do a join. For example, if you want to specify the type of join as left, inner, outer, etc. or the type of merging your tables is based on a calculation. Then you need to do a join.
Intended Data Duplication
Speaking of duplication, there are cases where you intend data duplication. Have a look at this next scenario where I am trying to give myself some structure during these times of quarantine. I am interested in how much time I spend on different kinds of activities beside work:
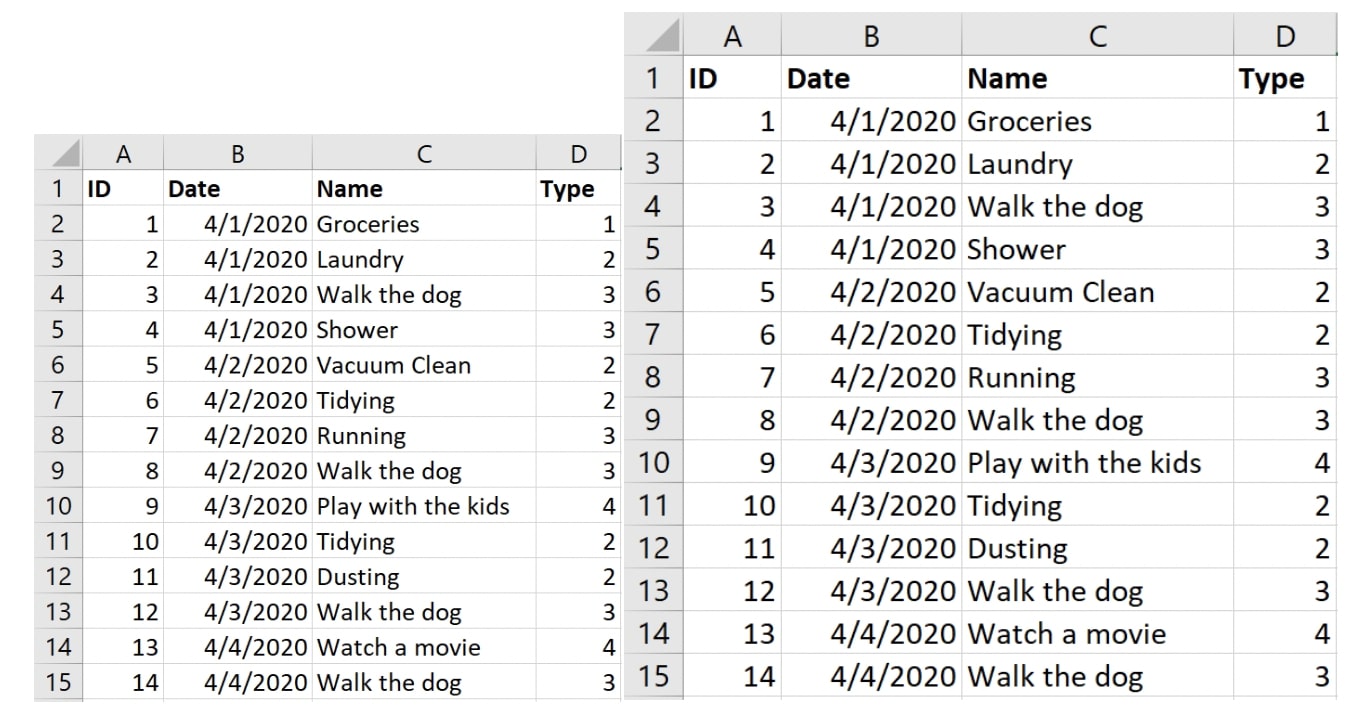
Above: Your plan of activities with their type in terms of categories
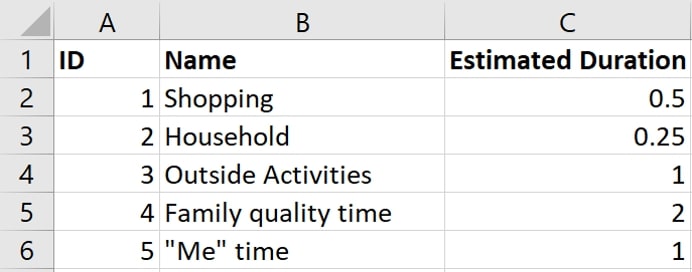
Above: The overview of categories and the estimated time you are spending on such an activity
In the Tableau Data Model, we relate the two tables on the fields Type (Activities) and ID (Categories). When I drag Name from Category to Rows and Estimated Duration to Columns, as I am used to, then the following happens:
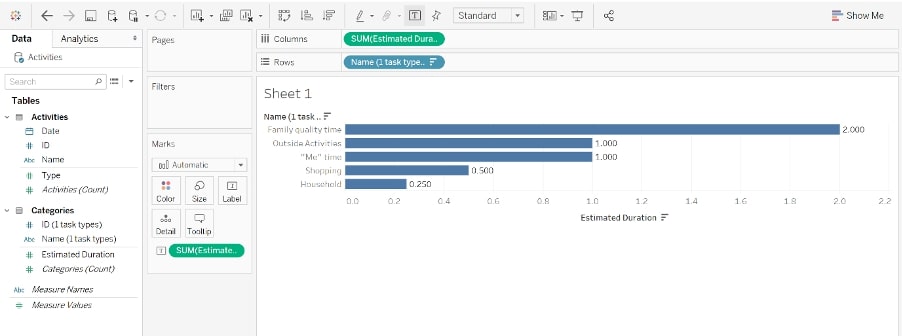
Above: Estimated duration per activity category
The numbers shown are the values from our second table, the categories. It becomes obvious that Tableau is not joining the tables together. Nothing in my viz tells Tableau to use both tables, which is why I am seeing the plain numbers from one table only. What I intended, though, was to sum up the hours as often as I have planned them in my activities, the first table. With a join, I would be done here. Of course, if we had no other option than using the relationship, we would find our way around—Calculate the sum of durations with the following LOD that includes the first table:
{INCLUDE [ID (activities)]:

    SUM([Estimated Duration (activity types)])

}
LODs still do a great job for us. We have to assess if it is a valid option in the specific use case. So far, so good. But what cases definitely require joins? There are a few. Imagine any case where you want to merge two tables not based on matching values but based on < or >= operators or calculated fields. Those dependencies cannot be defined in relationships and need to be incorporated by (physical) joins. A very common use case where you would choose a join over relationship is the implementation of row-level-security where you depend on having duplications as well.
Another important argument is about extracts. If you need to precompute your extracts in a format other than .hyper, you are required to use joins because relationships can only be extracted to .hyper.
Relationships vs. Blends
To compare relationships to blends, I would like to go back to our first example. You have certainly tried to solve this issue using blends as that is their most popular use case and their intended function: to bring together data of different levels of aggregation. This can still be done as before, though you may have encountered several problems with blends:
- Only left joins are available.
- Blends cannot be published as a data source as they are defined on a worksheet.
- They are not performant on large datasets because they are computed as part of a query.
- The secondary data source is always aggregated.
Those are all good reasons to use the new relationships if possible. However, a reason to keep using blends is because your tables relate on different fields for each worksheet. Instead of having multiple data sources with the same logical tables but different relating fields, you would connect once to your tables, and activate the relevant connection on the specific worksheet.
And sometimes, you are not in control of the data sources and can only make use of what someone else has been prepping and publishing. If those tables are published separately, you can only bring them together in a blend.
If you are interested in more details, I can recommend watching this video where Bethany Lyons is talking about the capabilities of the new Data Model.
Embrace Change
In conclusion, I can assure you that the way you are used to working with Tableau still exists. Don’t worry. It is a lot to digest at first glance, but I encourage you to try incorporating it to boost your dashboard performance and maintenance!