This series reveals there's more to being an analytics consultant than meets the eye. The InterWorks team shares candidly about the struggles and challenges they've grappled with throughout their careers. You may think you know, but you have no idea...
Everyone has that moment. You’ve got the data. You have the goal – make a dashboard/visualization that says something interesting. You sit down. And then you freeze. You’re staring at a blank screen. Where do I go from here?!?!? The possibilities are virtually endless and it’s terrifying. Sometimes, it’s feeling paralyzed by all the options. Sometimes, it’s feeling the intense impostor syndrome that so many of us face. But whatever it is, it’s debilitating. Generally, people just see the finished product. A beautiful dashboard that’s polished and shiny and whole. What people don’t see is the process—the often stressful, sometimes agonizing, existential-dread-inducing process—leading up to it.
Where Do I Even Start?
To combat this, I have created a process (with steps I can check off because who doesn’t love crossing off something on a to-do list?). Hopefully, it can help you as well! Get your pen and paper out and let’s get started! (Actual pen and paper. I do a lot of these steps in a physical notebook)
For each of the steps, I’ll show my process through building this dashboard for Week 7 2019 of Makeover Monday (find the data here and the Makeover Monday website here).
Step 1. Write Down All the Questions
At this point in the process, I want you to think of the data very theoretically. What does your data involve? Is it sales data? HR data? Test scores? Survey responses? Whatever it is, think about some of the questions you might want to answer with it. Write every single one of them down:
![]()
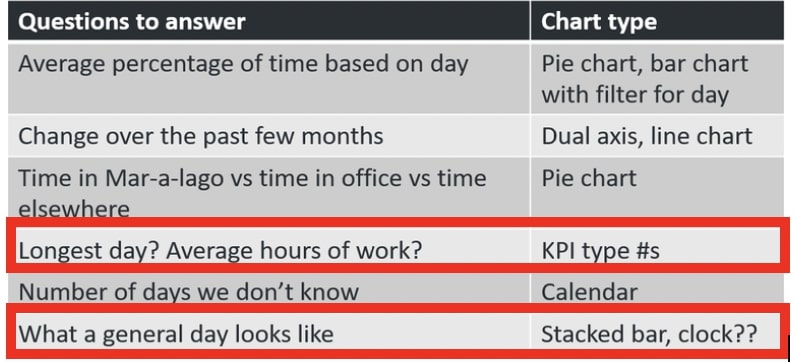
Step 2. Write out the Charts That Go with Each Question
Now that you have a list of all the questions, write out charts that would be helpful in visualizing the answers to the questions. Some of the questions might have multiple charts that would work. For example, if you are an online store with sales data, and you want to see what department the majority of your orders belong to, you could possibly show that with a pie chart, a bar chart or even just a BAN (Big A$$ Number) type visualization where you only show the name of the top department:
![]()
Step 3. Group the Questions That Go Together to Create a Story
Up to this point, you’ve let the creative juices flow and have written down almost every idea that’s crossed your mind. This is the part where you’ll start taking a more critical eye to your ideas. Creating a visualization that answers every question you wrote down would be a bit overwhelming for the viewer. To help narrow down the questions, begin to group them together. If you already have a story you want to tell in mind, what questions help? If you don’t have a story already, which of your questions go together? Grouping them will help you come up with a cohesive story.
Step 3a. Get the Data You Need for Your Story
A sub-step of this is to begin to look at the actual data and figure out if you have all the data you need to tell the story you’ve chosen. It might be that you need to collect or acquire more data. This is also the time where you might need to create calculations to get the data you need. For example, say you want to look at % towards a goal instead of the raw number. That number may not be in your data as is, but if you have the Target and the Actual numbers, you can create a calculation to determine it:
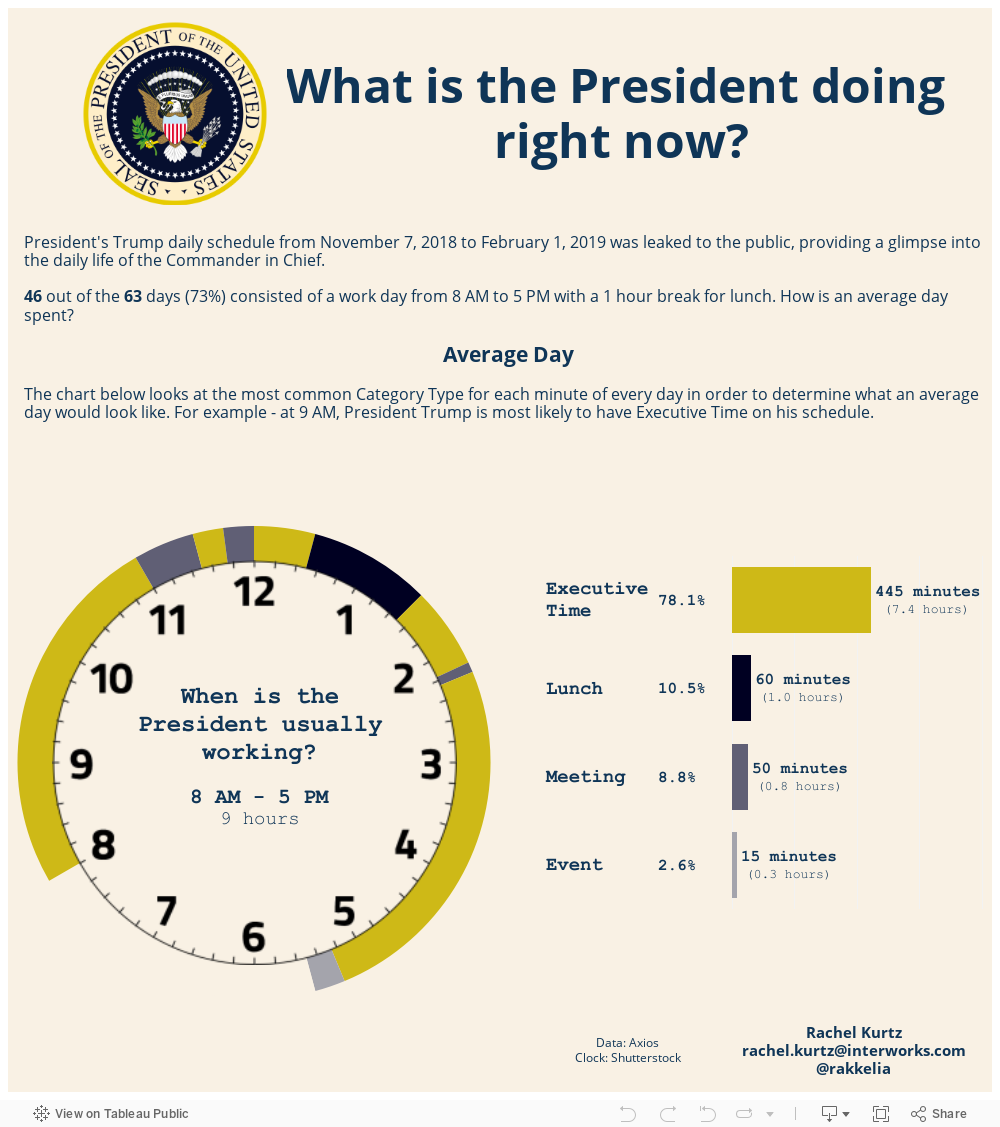
Above: This is a politically charged dataset, so I wanted to make sure the story I told was simply reporting the data without spin.
Step 4. Make All the Charts … Yes, All the Charts
You should now have a slightly smaller list of questions. For each of these questions, you have at least one chart idea. Now, you should make them all—every single one of them. You don’t need to change a lot of the formatting such as the color and the font. Just build the bare-bones version of each of the charts. Why? Building all the charts helps you see with your very eyes which is the best way to visualize the answer to your questions:
![]()
Above: This is a cleaned-up look at all the charts I created in Tableau.
Step 5. Draw out What It Could Look Like
Now we go back to pen and paper (or whiteboard and marker) to make our blueprint for the dashboard. Usually, I’ll have my paper represent the dashboard and then using a pencil I’ll start to place and draw my visualization. This will go through many rounds, hence the use of a pencil. Below is a sped-up video of my process for this project:
Step 6. Create
Put the dashboard together to match your drawing. For me, this part usually takes the longest because this is the time when you’ll edit the formatting to make everything cohesive. The amount of time I’ll spend choosing fonts would astound you. If you want, try to set a time limit on this portion:
![]()
Above: My first attempt at the dashboard I drew out (after a lot of formatting)
Step 7. Ask for Help (Optional but Recommended)
Reach out to ask for feedback on what you’ve created. I generally use colleagues I have at InterWorks. If you do not have that community, the Tableau Twitter community is very helpful. To me, this is the most nerve-wracking part: sending something I’ve created to someone else for critique. It’s the time when impostor syndrome starts to kick in. “What if they think it’s awful? What if they would have done it completely differently and are now judging me and will never trust my work again?” Try your hardest to push past these thoughts and reach out to your community. Remember—your community is here to help you, not bring you down.
Getting feedback and practicing this is the best way to get better at dashboarding, so the sooner you can get comfortable baring your soul (or so it feels) for feedback, the better:
![]()
Above: The comments I received back from my colleague Keith
Step 8. Walk Away
Have you ever been working on a puzzle and are looking for a particular piece and even though you swear you’ve tried every piece, you just can’t find it? Then you stomp off in frustration. A few hours later, you come back, and the very first piece you look at is the piece you were looking for all the time. This step is basically that same idea. You need to give your brain a chance to reset, which will ultimately help you make a better product.
Sometimes this is the most difficult part. A lot of times, I’ll combine this with Step 7 as a way of forcing myself to walk away. When I hand it off to someone to look at and give their opinion, I vow not to edit it until they respond.
Step 9. Come Back and Move Things Around
Now that you’ve had a breather and have probably received some feedback from whomever you reached out to in Step 7, it’s time to get back into it. Move things around, remove things, edit the things that are there, iterate.
Step 10. Repeat Steps 7-9 Until You’re Satisfied (or Satisfied Enough)
One sentence I keep in my mind as I’m working on dashboard is from Voltaire: “Perfect is the enemy of good.” Or to put it another way from Confucius: “Better a diamond with a flaw than a pebble without one.” You could spend forever tweaking the dashboard and not feeling like it’s good enough, but remember, this is already better than what you had to start with! My final dashboard can be found below.
These are the steps that have worked for me to get over that blank page debilitation, and I hope they help you, too! I’ll leave you with one last quote, this time from Zig Ziglar: “You don’t have to be great to start, but you have to start to be great.” You got this!