
Tableau is the #1 visual analytics platform in the world. In part, it has accomplished this by providing its user base with a tremendous amount of flexibility when it comes to data sources. By my last count, Tableau has over 80 native connectors to a range of sources. So many options! However, just because you can use Tableau a certain way doesn’t mean you should.
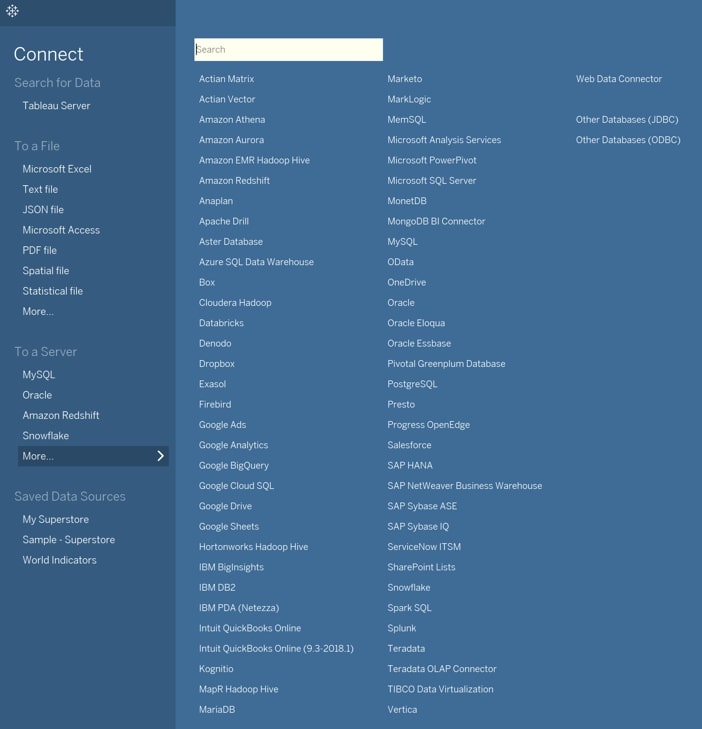
Above: So many options, but not all data sources are equal!
The Tableau Blueprint
Last year, Tableau came out with Tableau Blueprint, a methodology for building the capabilities of a successful, data-driven organization. At the very top of the blueprint diagram is the overarching principle that data should be trusted and governed. As any organization grows, it is imperative that it take a hard look at how data flows, what rules govern the exchange of data, how data gets transformed and who has access to the data:
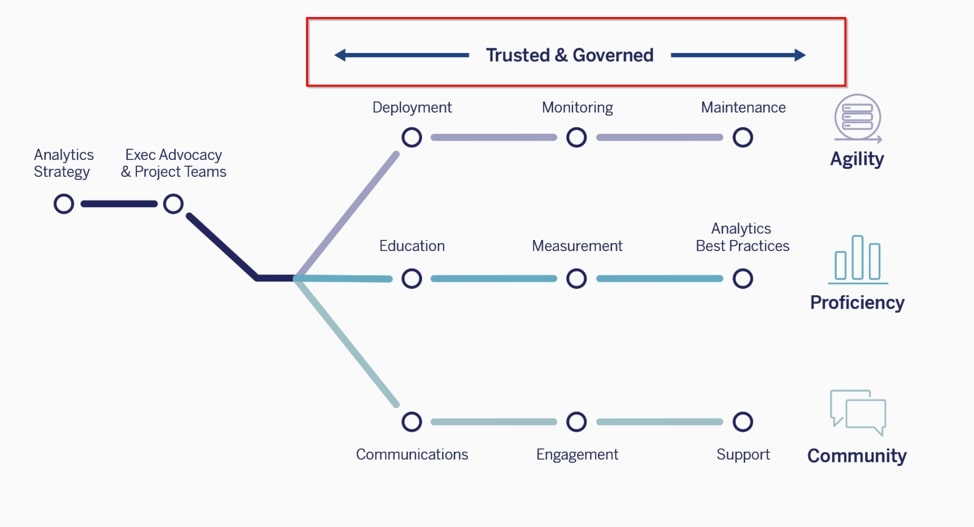
Above: Is your data trusted and governed?
As consultants, we provide guidance and solutions for clients no matter where they are along their data journey. Some organizations are more mature than others when it comes to data—not at all a problem. But some requests from Tableau users instinctively set off a red flag, signaling we should probably discuss how the data is getting into Tableau and whether the approach is a scalable, long-term best practice. Once an organization becomes big enough, it is likely time to start investing in a modern cloud data platform, so Tableau dashboards can be fed with trusted and governed data from a reliable source, such as a data warehouse or data mart.
I’m going to list five red flags when it comes to Tableau practices. If any of the following apply to you, let’s talk!
Red Flag Practice #1: Custom SQL
When you go the Data Source pane of Tableau, there is a button titled New Custom SQL that allows you to write SQL for your data connection instead of clicking and dragging the tables and views for your joins. Over the years, we have seen this repeatedly abused by novice Tableau developers who come from a data engineering or SQL analyst background.
Once, we were brought in to help performance-tune an impossibly slow dashboard only to find that another consulting firm had written a 50-page SQL script inserted into the custom SQL. You read that right: 50 pages! It didn’t take long for us to identify why the dashboard stalled out. The opportunity for this madness presents itself when the organization tries to use Tableau as a data integration tool to both transform the data and combine multiple sources together. This can put a tremendous strain on dashboard performance since this is not what Tableau was designed to do. Another example of just because you can do something, doesn’t mean you should.
Why should custom SQL be avoided unless necessary? Well, Tableau’s data engine is very smart. When you use the Data Source pane as intended, Tableau understands the structure of the data and constructs efficient queries based off this understanding. With a custom SQL connection, Tableau treats the entire connection as a nested SQL query, wrapping all the filtering, grouping, aggregations, etc. on the outside. In many cases, the performance difference may not be noticeable. But when you are abusing custom SQL by doing extensive data integration in that step, the dashboard will be impossibly slow. There are many good uses for custom SQL, but this is not one of them. In this case, better to move that workload to a back-end database.
Red Flag Practice #2: Files Hosted on SharePoint
Most early adopters of Tableau use Excel as a data source and host those files on a platform like SharePoint. Excel is ubiquitous among analysts and easy to understand, making it a natural fit as a preferred data source in the beginning. If there are any data issues, Excel is relatively easy for analysts to troubleshoot on their own. But this approach fails to scale for several reasons.
To begin with, anyone with write-access to an Excel file can edit it, potentially causing a data governance nightmare. In this sense, Excel’s strength is also its weakness. Companies who want the flexibility of changing their data will pay for it later when the data is incorrect or unexpectedly changes but they cannot trace why. Certainly, a good SharePoint administrator can alleviate many of the issues, but the reality is that many organizations with this arrangement suffer from gaping holes.
Further, what happens when the data becomes too big for Excel? In an age where data volumes grow at an exponential rate, this is very easy to do. Tableau can also read from CSV or text files with higher record limits, but none of these file formats are optimized for analytical queries since they are row-oriented instead of columnar. In practice, Tableau users will likely be refreshing extracts from these sources.
Finally, many companies are moving to SharePoint Online (Office 365), and you cannot natively connect to files hosted from this source. Tableau has published an article describing three possible workarounds, but they are non-ideal solutions, and none of them offers the ability to make live connections to the data.
Red Flag Practice #3: Web Data Connector
A web data connector (WDC) is essentially an HTML file that includes JavaScript code, allowing Tableau to connect to data that is available through HTTP (e.g. an API). WDCs are useful when an existing connector is not available. For example, if Tableau does not have a native connector to a source, and the source does not have an ODBC driver but does have an API then a WDC can seem like a good fit. The WDC would call the API, and the returned data can be moved to a Tableau extract (note that live connections are unavailable through WDCs).
A web data connector is a great way to start but almost never the correct long-term solution. They require custom development in JavaScript and APIs are prone to change. Owning, fixing and maintaining a custom-built WDC to keep up with changing APIs is likely to incur just as much cost in the long term as using fully supported connections through an established ETL tool.
Furthermore, you cannot maintain history on data collected from APIs using this approach. If the API only returns the last six months of data when it previously returned the last five years, you have no control over this as the data consumer. If the source changed or deleted a record, you would not be able to track the change. Ideally, you would have been able to save off the data in a history table somewhere, but this is not possible using just WDCs and Tableau. You’re going to need a data platform that stages the table into history tables.
Red Flag Practice #4: Connecting to a Cube
Tableau can natively connect to cube data sources such as Oracle Essbase, Teradata OLAP, Microsoft Analysis Services (MSAS), SAP NetWeaver Business Warehouse and Microsoft PowerPivot. Data cubes are essentially multi-dimensional objects where the hierarchies and aggregations are preset by the cube designer. Think of it like a 3D table; hence, the “cube” name. For example, a company may want to summarize financial data by Product, Location and Date. The cubes were originally designed to be easily understood and faster to analyze, but they introduce severe limitations for modern analytics:
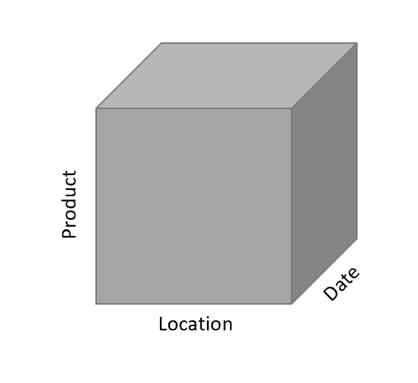
Using the above cube as an example with regards to revenue reporting, we may find it relatively easy to see that the revenue for Tables (Product) in Singapore (Location) on January 2020 (Date) was $1,000, which is a 20% increase from the same month of the prior year. But in modern analytics, decision-makers want to know why that 20% increase is there. To answer this question, you would likely want more granular data (e.g. a table with all revenue transactions for the past two years). Cubes do not offer this because the data has already been rolled up and revenue aggregated according to its pre-defined configuration. It does not provide you the same amount of flexibility to explore, which is what analytics is all about.
Critically, the main reason we steer clients away from using cube data sources is that Tableau features become severely limited with these types of connections. There is a long list of features that will not work with cubes. You cannot create extracts with cubes (live connections only). Also, forget about creating sets, bins, groups or aliases. Level of detail (LOD) expressions and any advanced analytics features—forecasting, trend lines, clustering—are also not supported. So, in summary, cubes have their place but when it comes to reporting in Tableau, this would be a big red flag.
Red Flag Practice #5: Semi-Structured Data
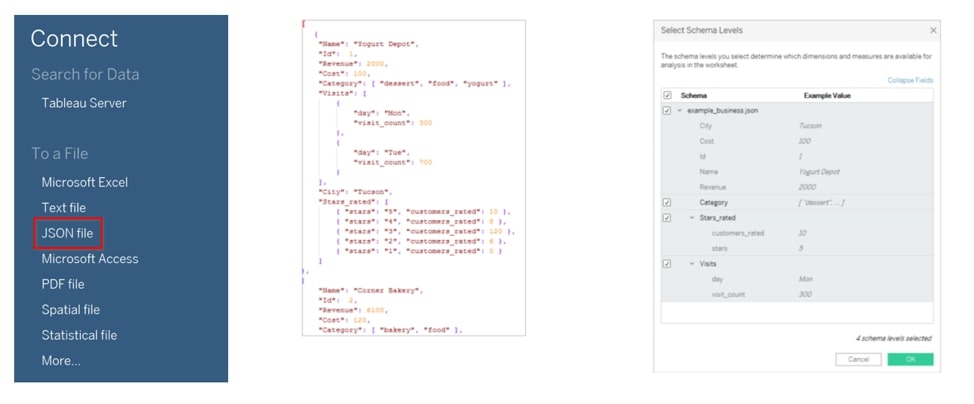
Most Tableau users are very familiar with structured data, which typically looks like tables with columns and rows. Semi-structured data does not conform to those standards but does have tags or other markups that help identify distinct entities within the data. With the explosion of machine-generated data from applications, sensors, mobile devices, etc., it has become critically important to incorporate analysis of semi-structured data. Examples of semi-structured data formats include JSON, XML, Avro, ORC and Parquet.
Fortunately, Tableau has a native JSON file connector. Unfortunately, it does not support the other data formats. The JSON file connector can also be hard for some analysts to use. This approach may be great for exploratory purposes in the beginning, but a better approach would be to flatten the data out into tables or views, so they become more accessible to other users. Doing so would also allow a data platform to keep history on the data and track changes:
When to Use Data Warehouses and Data Marts
We have now identified five red flag practices that make me think an organization would be better off using a data warehouse or data mart.
A data warehouse is essentially a centralized database that integrates data from multiple sources in a very structured way. A data mart is typically a subset of the data warehouse meant for a specific audience. For example, a data warehouse may integrate data from different sales, marketing, finance and logistics applications, so there is a single view and definition of core business concepts such as customer or revenue. A data mart could then be provided with tables and views specific to the Finance department while including some integrated data from the other sources.
Since data warehouses or data marts are centralized and structured, they can be governed. Moving your data away from Excel into databases means there are guard rails that provide processes and rules for how data should flow through an organization. Moving your data transformation away from Tableau and into the back-end database could tremendously increase performance and reliability by taking the unnecessary workload off Tableau. Finally, data that comes in semi-structured formats or via API sources should be stored as valuable resources and analyzed by the widest audience reasonable.
A lot of the red flags mentioned above have the effect of creating data silos. Instead, we should be fostering a culture within aspiring data-driven organizations of creating shared and integrated data resources that are trusted and governed.
Snowflake: The Cloud Data Platform
In our opinion, Snowflake is the best cloud data platform to pair with Tableau. It is a true SaaS multi-cluster modern cloud data platform that enables instant elastic scalability for unlimited concurrent users. It offers one platform to use as a data lake, data warehouse or data mart. Here are a few reasons why we recommend it:
- Separation of storage and compute along with a multi-cluster computing architecture enables elastic scaling up (for complex queries) or scaling out (for concurrent usage).
- Columnar micro-partition architecture allows for automatic and efficient pruning of queries, so performance should be much faster than traditional row-oriented databases.
- Snowflake caches query results for 24 hours, meaning Tableau users clicking around a dashboard can experience fast results as they subsequently navigate through dashboards.
- As a result of the above, Tableau users are encouraged to make live connections to the data rather than extracts because they can expect such fast performance for analytical queries.
- Snowflake natively handles semi-structured data, allowing you to flatten out those formats into regular tables and views just using SQL queries.
Put all your data in one place and run queries without having to worry about performance. If you would like to hear more about how InterWorks has helped organizations all the around the world with managing their data, don’t hesitate to email me or contact us today!