NOTE: The COVID-19 global pandemic continues to evolve. This data visualization is no longer being updated, and we recommend the Johns Hopkins Coronavirus Resource Center for regularly updated data and information.
What is the impact of COVID-19 on deaths in the United States?
As many states complete their second month of lockdown, and millions of people have been forced out of work, skepticism has grown over the true deadliness of this disease. High-profile figures like Elon Musk have gone so far as to question whether public officials are misleading the public by erroneously attributing patient deaths to COVID-19, especially in cases where coronavirus was not laboratory-confirmed or did not seem to be a contributing factor to death.
Americans need to know: Are continuing lockdowns worth it? Are public health officials inflating the number of COVID-19 deaths? Inversely, are we actually undercounting the number of COVID-19 deaths?
Pursuing the Right Facts
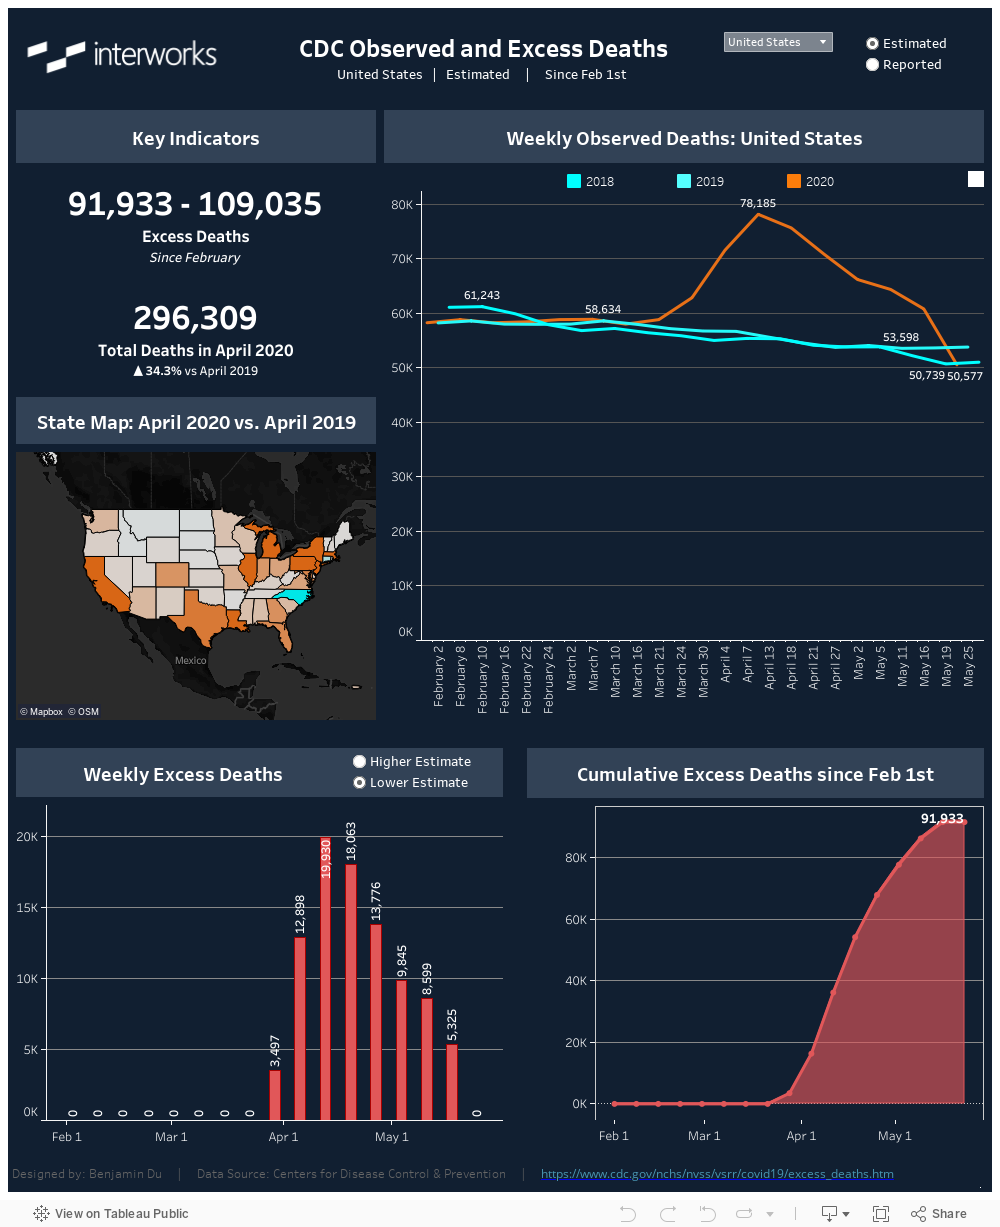
Fortunately, the U.S. Centers for Disease Control and Prevention (CDC) has long maintained a dataset around potentially excess deaths, defined as the number of observed deaths subtracted by the number of expected deaths. By looking at this, we can better understand the impact of what both the disease and the mass social-distancing behavior changes have done to affect overall deaths. Note that there is a known lag in death reporting, with estimated weighting applied to the data to account for this lag. Because of this, we are only going to focus on the period from February to the end of April, with a particular focus on April since most of the country was locked down during that month.
Three takeaways to note:
- COVID-19 has almost certainly resulted in tens of thousands of deaths that would not otherwise have occurred. The CDC estimates that since February, there have been roughly 55,000-66,000 additional deaths (lower and upper bound estimates) beyond the expected threshold.
- The disease burden is not distributed evenly. New York City alone experienced over 22,000 potentially excess deaths since February, although their excess death count seems to be declining. Meanwhile, the excess deaths in new hotspots seem to be on the rise. As states reopen, we will be watching this trend closely.
- The impact of social distancing and government restrictions almost certainly have had an impact on deaths. There are likely fewer deaths due to vehicle accidents and likely more deaths due to suicide. The data is not granular enough to know at this point, but this is an interesting question to explore.
After exploring this dashboard, how do you feel about the deadliness of COVID-19 and the use of government restrictions to enforce social distancing?