
Was anyone else fascinated with the American sitcom “The Jetsons” growing up? I know I was. The imaginative, futuristic world was so captivating to me, making me wonder if we would ever have holograms or talking robots. I was most intrigued by the flying cars, how they worked, how they were fueled and if they were practical. Little did I know that as an adult I would be asking myself the same questions about different modes of transportation. Having a background in chemical engineering might answer why I have such a fascination with how things work, in particular, how they are fueled.
An Alternative Future
In today’s world, we are highly dependent on fossil fuels for our means of transportation, but as most of us know, there is a shelf life associated with this. Fossil fuels, as the name implies, are a thing of the past. It won’t be here to power the futuristic cars we saw in “The Jetsons.” Instead, we will need to depend on alternative fuels. The U.S. and many other countries have implemented a variety of alternative fuels that are widely used every day.
I thought it would be interesting to create an alternative fueling station visualization for the U.S. Built with Tableau, this dashboard allows users to access station-specific details, such as location and contact information. The dashboard also provides historical data of when the station was opened and if it is accessible to the public.
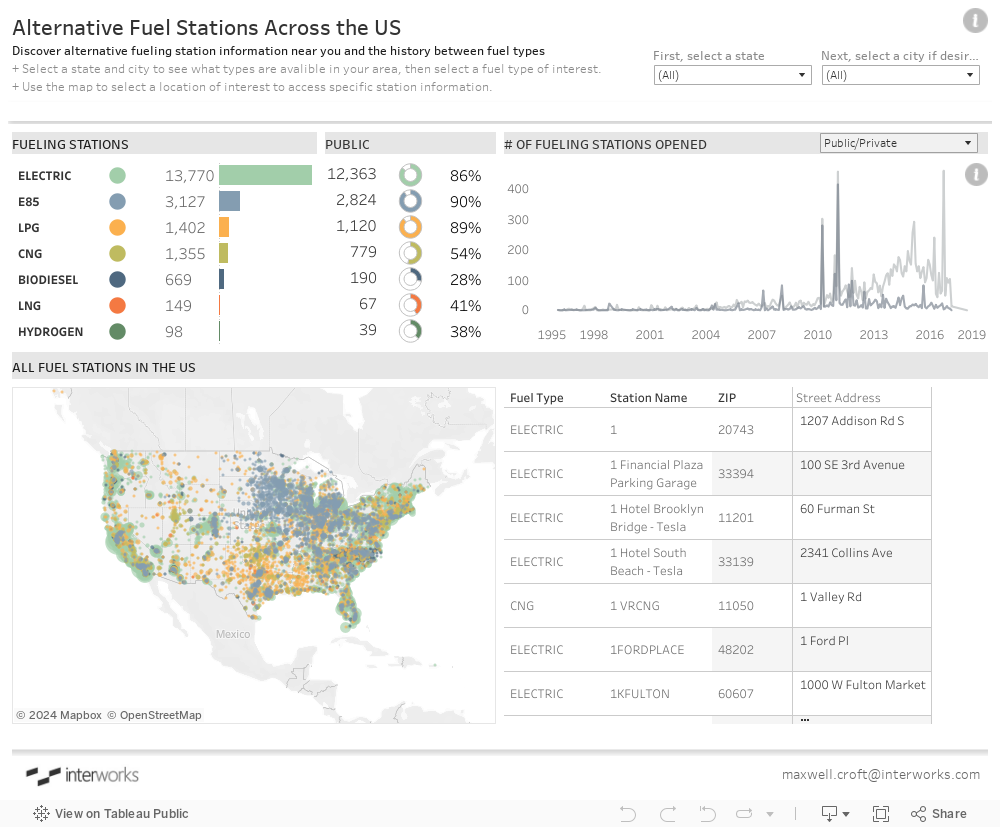
Designing Informational Donut Charts
During the design stages of my dashboard, I knew the dataset was composed of seven different alternative fuel types, with informational station data gathered across the U.S. This led me to create interactive and informational donut charts for each fuel type, in order to provide the user with more interactivity for each specific fuel. To do this, I created multiple overlaying pie charts. The back chart displayed the percent of public and private stations, and the front chart was left blank to create the donut itself.
To display the percent of public stations, I had to create two calculations: one that calculated the percent of public stations (SUM(IF [Private or Public Station] = “Public” THEN 1 ELSE 0 END)/COUNT([Private or Public Station])) and another that subtracted that percent from overall total percent (1 – [Percent Public Station]). Next, using those two calculations as Measure Names and Measure Values, I created a new pie chart to display each fuel type and the number of stations available for each.
To make it a donut chart, I then created a “placeholder” calculation of AGG(MAX(1)) on my Rows shelf to create a dual-axis chart. With the second axis as a circle, I was able to add a label of each fuel type in the center of each donut by adding my fuel type name and number of stations to Label on my Marks card.
The tricky part was getting each fuel type to stay present on my dashboard when the count of stations was zero since every state didn’t have all seven fuel types available. To address this, I created a new table that had records for each state and fuel type.
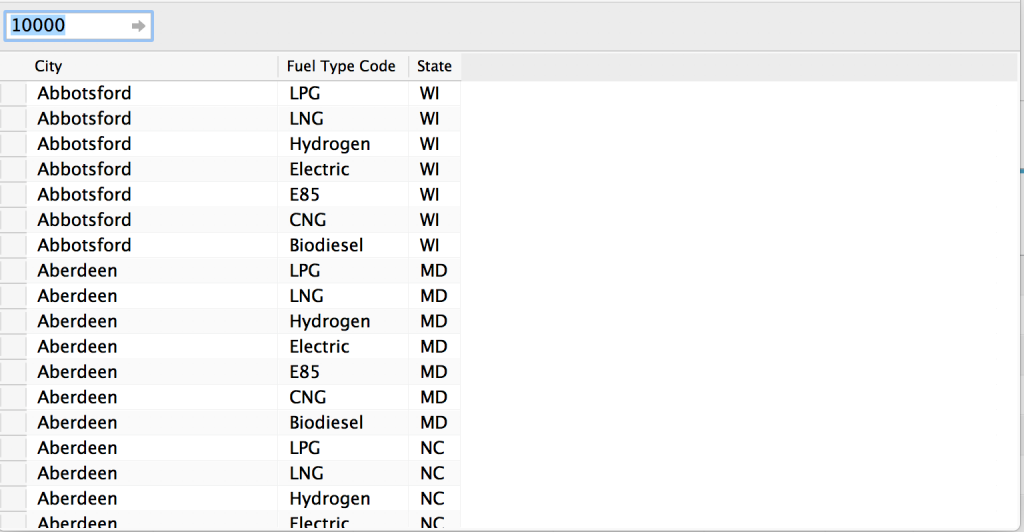
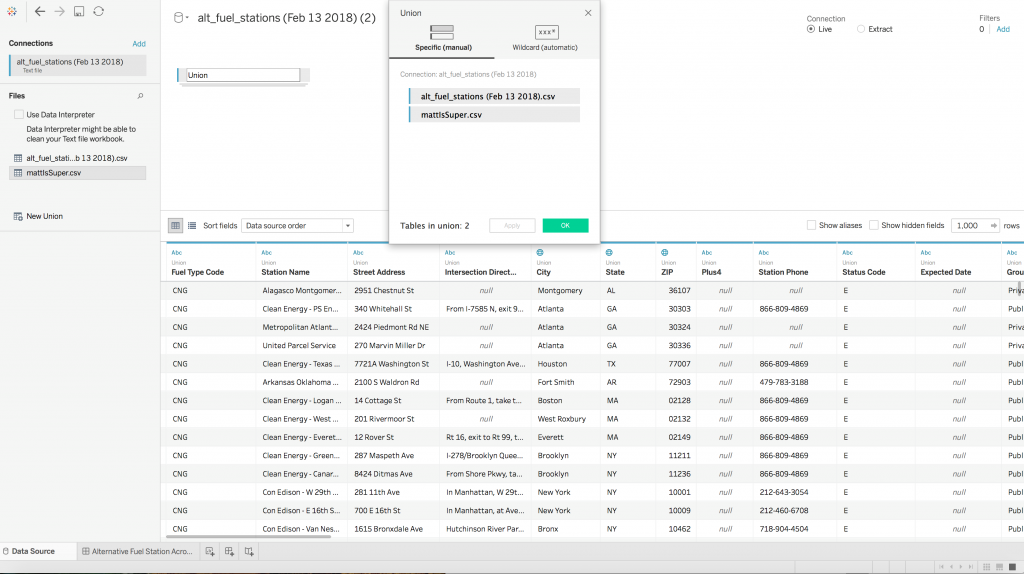
I then created a folder that contained the original data source and the new table, where I was able to union both sheets together, as seen below. This resulted in there being at least one record for the state/fuel type, even if one didn’t exist in the state. With that, my fuel types were able to stay fixed on my dashboard, which eliminated resizing and missing types issues.
I hope you will take a moment to look up your hometown and see what alternative fueling stations are available near you. We should all continue thinking of the fuel of the future, so one day we’ll be able to live out our childhood fantasies.