With more than 150 virtual sessions, talks and live Q&A events, the Power BI and Fabric Summit 2024 conference had something for everyone.
The keynote session kicked off with an overview of the Microsoft Fabric ecosystem. Getting a chance to hear from Kim Manis, who is on the Microsoft Fabric Product Team, meant everyone was both informed and enthused as she touted Fabric as a single, AI-powered platform to handle all of your data analytic needs.
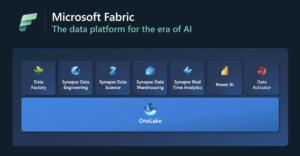
Fabric is a Software as a Service solution that operates as an end-to-end data experience with real-time analytics, data integration, data engineering, data science and warehousing all rolled into one.

It was clear that Fabric would be the star of the conference, having been launched less than a year ago, but the content coverage actually reached far and wide, including plenty of material on Power BI-specific functionality.
For those unfamiliar with Power BI, this is Microsoft’s native visual analytics tool that allows for the creation of rich, interactive reports, custom data visualizations and insightful dashboards. The goal is to easily see data in a visually, compelling way.
“Empowering everyone to discover insights and make data-driven decisions.”
Having the ability to gain insights nearly as fast as you can get access to your live, underlining data is essentially how Fabric and Power BI are paired together. Because they both operate under the same framework, there’s no longer a need to navigate in silos.
How is this useful? Here’s an example. Let’s say you want to be able to trigger an alert that tells an associate at a specific store to restock a shelf when product inventory starts to run low. That could make sure there’s no lost sales opportunities, right?
In an always-on, 24/7 world, your data is oftentimes the key to discovering trends that help lead to organizational efficiency and/or the means to effectively impacting your company’s bottom line.
Side note:
When doing some self-taught training with Power BI last year, I could tell that it was full of new things that would require more than just a weekend of upskill time. The one constant that makes Power BI easy to poke around in is the similar navigation to Excel and PowerPoint. The menus, ribbons, panels and layout are all neatly organized.
Honestly, I am still a bit new to many of the components of Power BI, but that is why the Power BI and Fabric Summit 2024 was so helpful. The product teams at Microsoft want to share release info, tips, updates, changes, etc. This was a perfect forum for them to do so.
On day one, I watched a session on the basics of Power BI, understanding DAX, getting started in SQL and an intro on the M (language). For the next few days, I got to participate in interactive table talks, and even connected directly with a few folks at Microsoft to ask follow-up questions and share some of our organization’s feedback.
I especially enjoyed getting to connect and network with other like-minded users across hundreds of other organizations who are actively using, just now transitioning or plan to transition over to, Power BI. Finally, I cherry-picked a few of my favorite highlights and moments of the conference, which (warning) may be a bit subjective:
OneLake Shortcuts – OneLake is a single, unified, logical data lake for your entire organization. It houses direct-connect shortcuts to other OneLake locations with Azure (ADLS), Amazon S3 (AWS) or Dataverse. As a result, your Power BI semantic models become seamless analytical experiences for all users.
Visual Calculations – This is in preview, but thanks to Jeroen (Jay) ter Heerdt’s session, our team at InterWorks feel this is the biggest game changer, once released. There is always a sense that learning DAX is not intuitive and can be difficult at times. What if you simply took DAX out of the equation, pun intended, and could write simple functions to generate measures and perform view-specific, templated calculations? Done and Done.
Go here for more information on visual calculations.
Explore and Share – As an analyst, getting your hands on data is never really as easy as it should be. That is, until now. Through the latest Explore data tool and updated sharing functions, being able to search, save and share are all worth revisiting if you haven’t been in Power BI in a while.
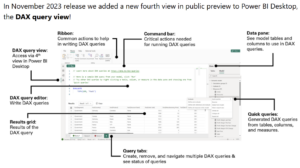
DAX Query View — The DAX query view gives you the ability to write, edit and see the results of Data Analysis Expressions or DAX queries on your semantic model from a new dedicated space. It is currently in Public Preview, so you can only play around with it in versions of November 2023 or newer after turning it on from the Global preview settings with the “DAX query view” option check marked.

Q&A (Powered by CoPilot) — You guessed it. The ability to ask your natural language questions of your data is here. At a high level, you are still using the same Power BI Desktop Q&A interface, but it can now be powered with CoPilot once enabled in your tenant settings.
Some of these collective options or highlights mentioned above may require Pro or Premium versions of Power BI, or a potential subscription to Fabric itself. But the major takeaways from the most recent conference are Microsoft’s ability to listen to user demand and stay agile, even with a company that employs more than 200,000 people.
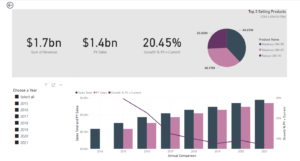
And this might not look like a Mona List, but this Power BI report consists of custom measures, compelling slicers, clickable filters, easy-to-understand charts, trend graphs, KPI cards and a built-in color theme. Once I knew the questions I had of my data, this report took just 20 minutes to produce, publish and share with my team.

If you have any questions about how Power BI works, need assistance accomplishing something specifically,or want some help enabling your users with best practices with the tool, definitely reach out to us here at InterWorks. Our job is to empower your users and make technology work for your people. You could say we’re the fabric that glues technology and people together. Too soon for that?

