This visualization has a personal aspect for me.
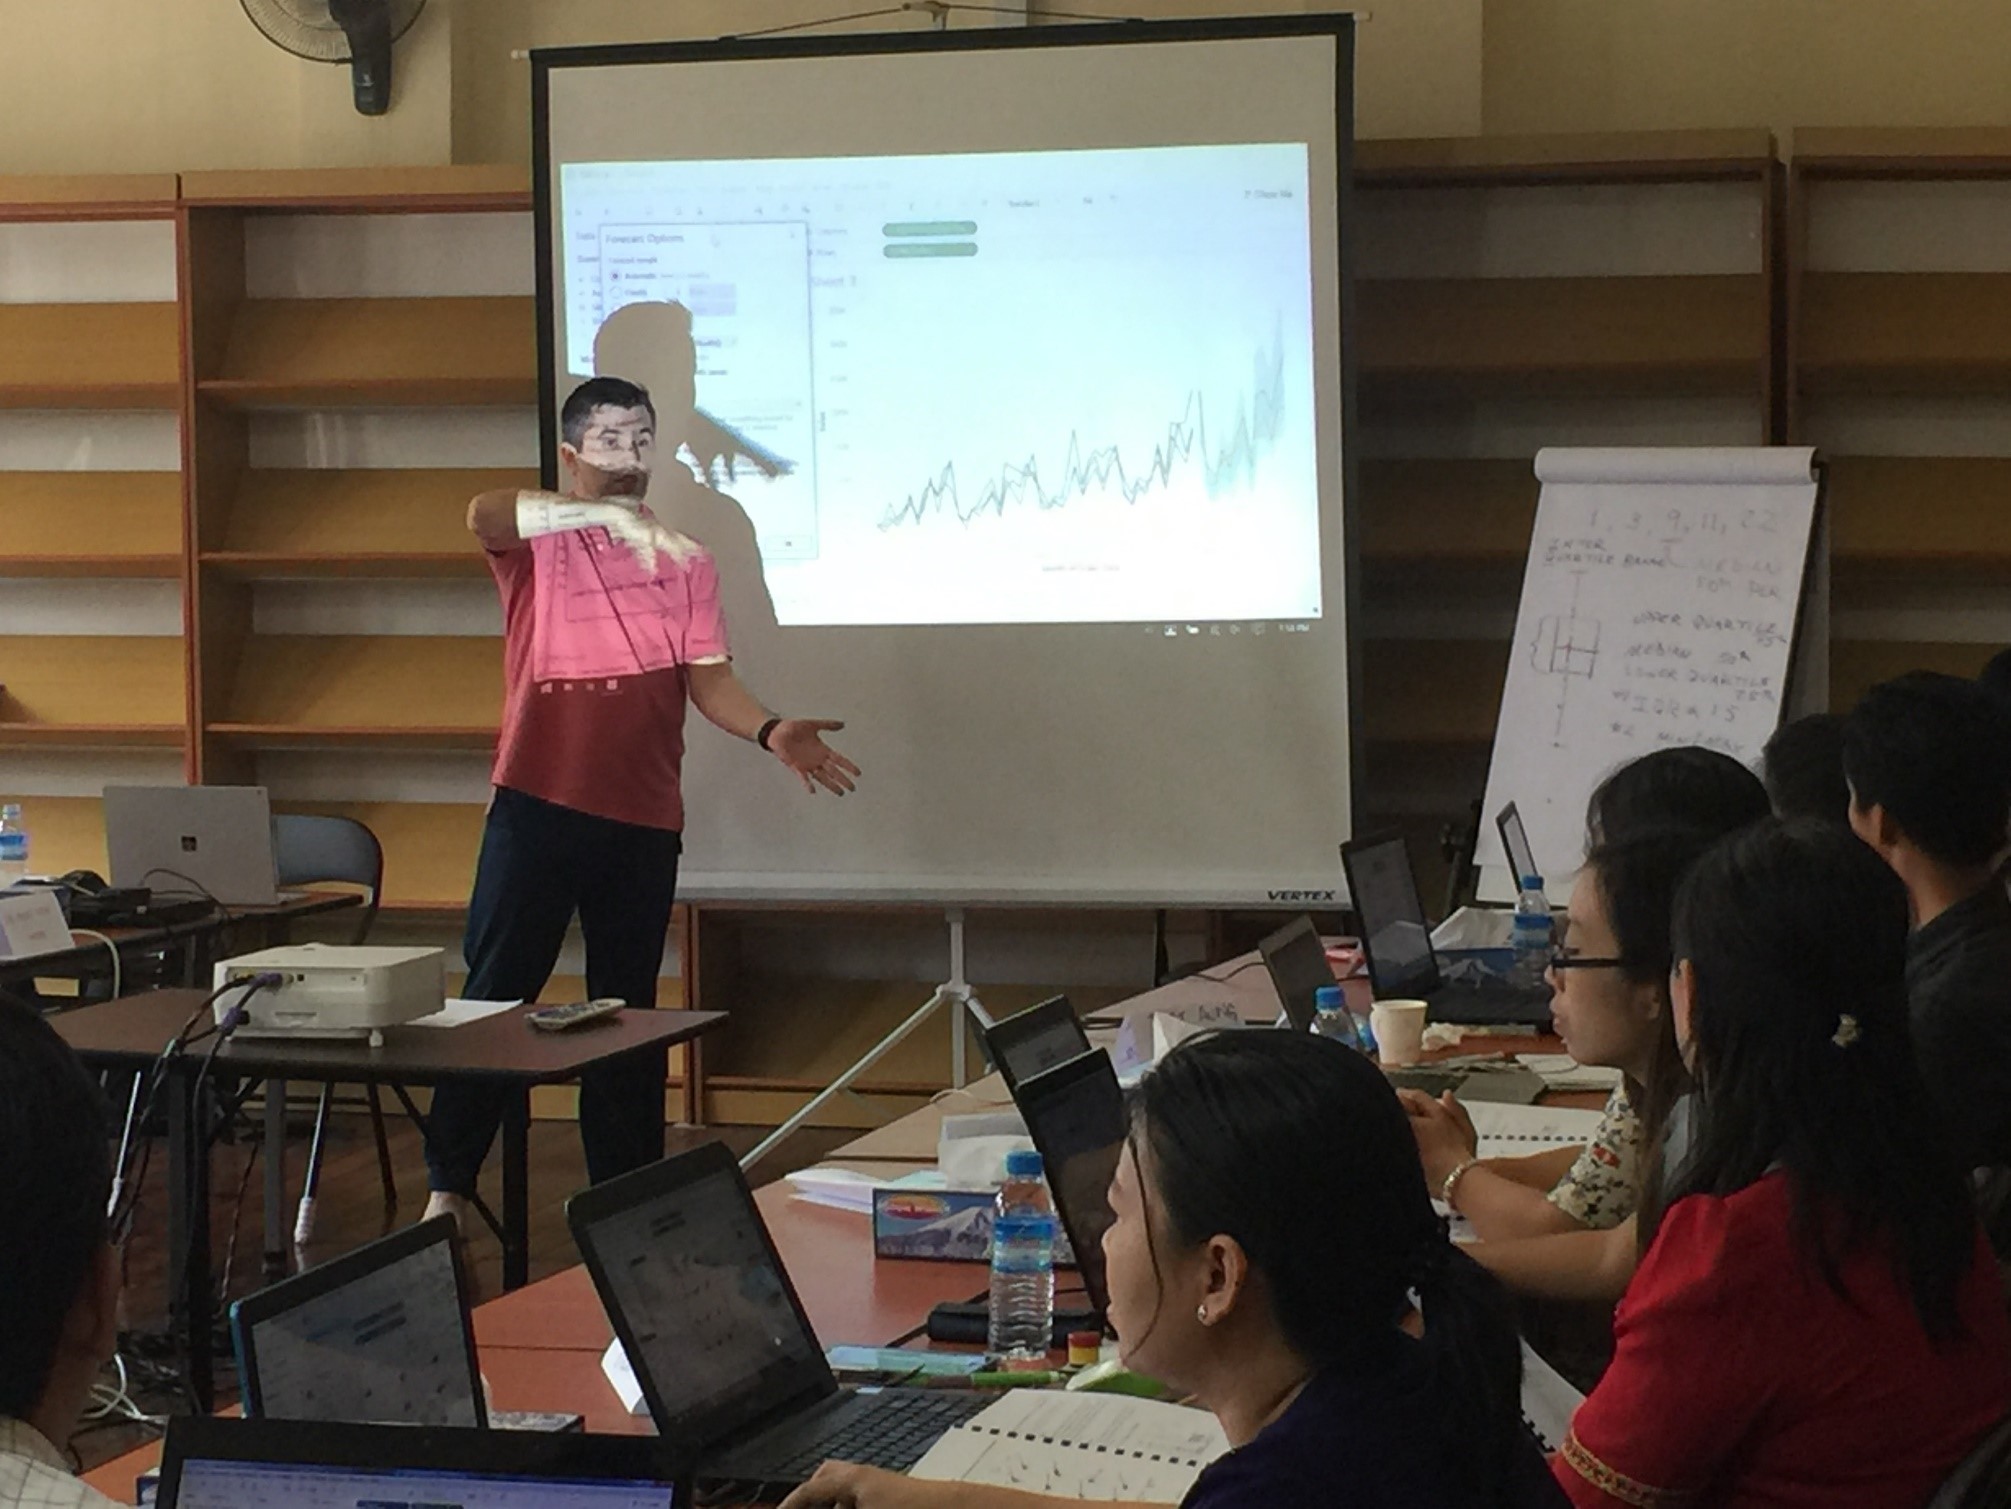
In April 2017, I was approached by the Tableau Foundation to volunteer my Tableau skills to teach data literacy and Tableau Desktop to government agencies in Myanmar (formerly Burma) with the hope of empowering them with good information to benefit the country. The initiative was called Data for Democracy. This was a careful decision I made with the leadership of InterWorks and my family as there are parts of Myanmar that weren’t very safe at that time. I understood that there were rebels and insurgents in the hills. I was assured Yangon was quite safe. And it was.

Above: Teaching my class as part of the Data for Democracy initiative.
Data for Democracy in Myanmar
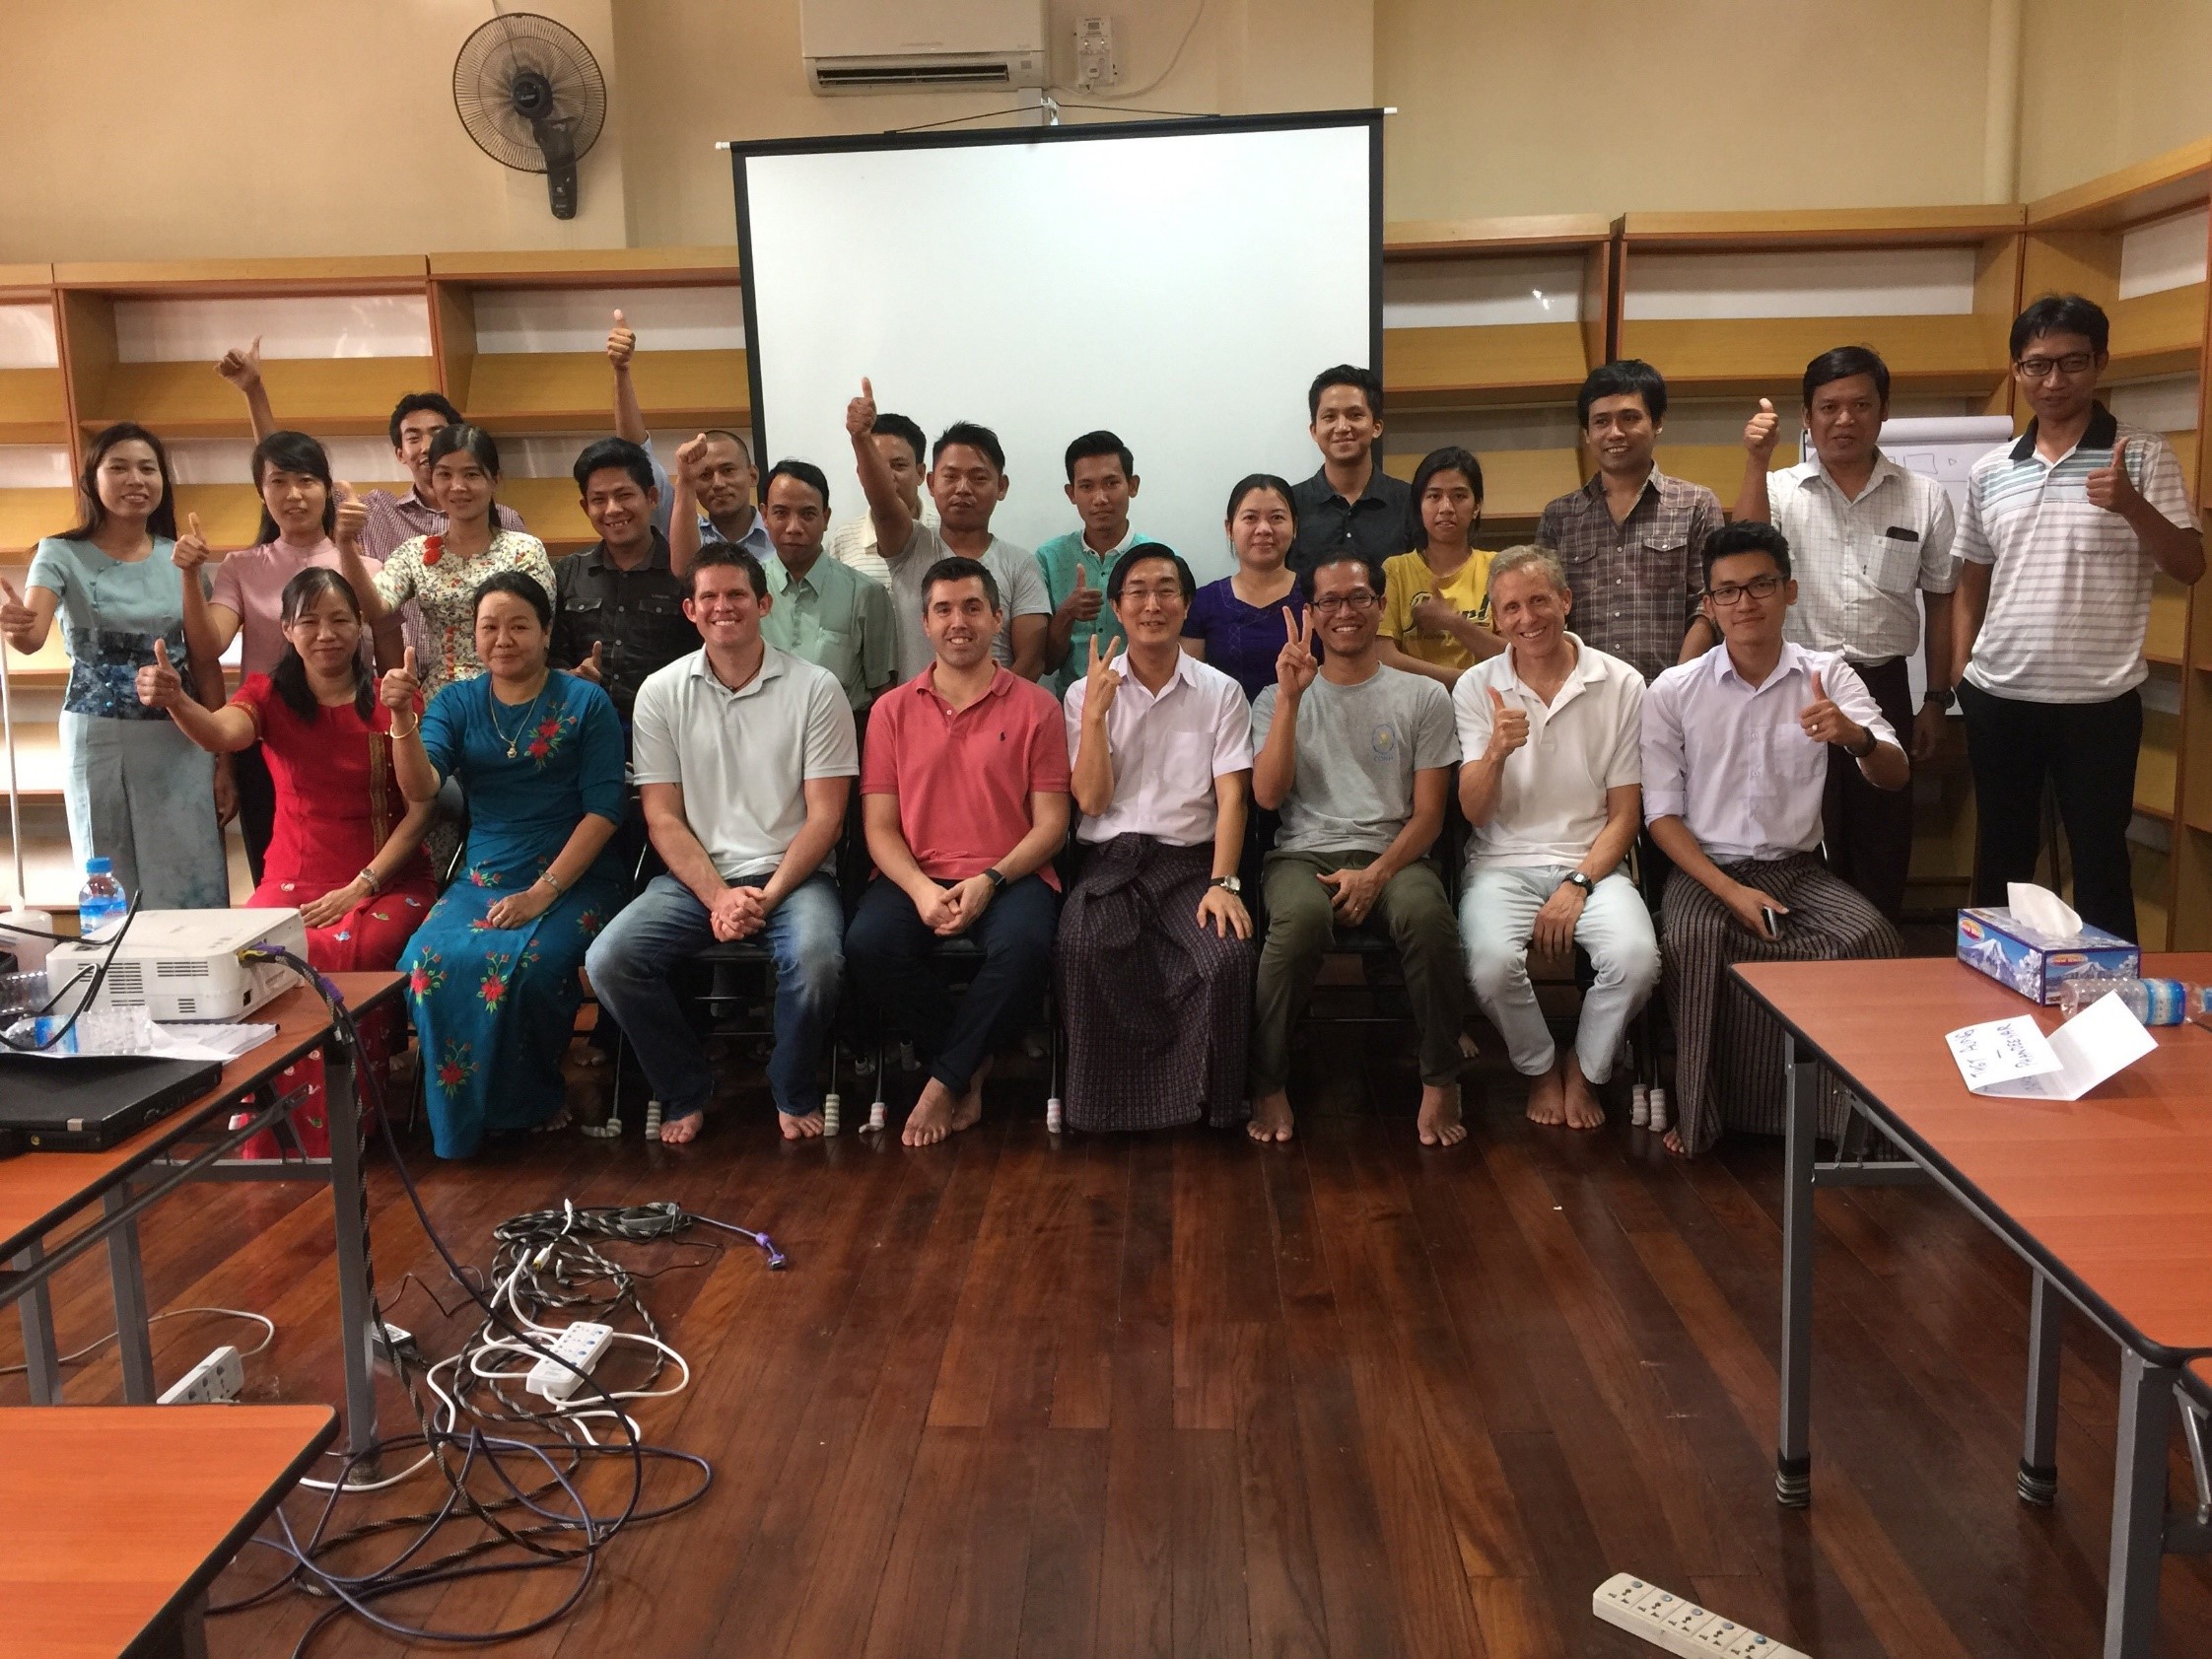
Over the course of the next two days, I taught 25 students from different public agencies and NGOs on advanced Tableau techniques. We were hosted by the Myanmar Book Centre. To assist with the students’ learning, I tailored our lessons to utilize Burmese census data. Here are all of the organizations that attended with their data objectives:
- Ministry of Information: responsible for all government ministries’ data
- Union Civil Service Board: responsible for training all Myanmar civil servants
- Mandalay City Development Committee: responsible for city planning and civic projects
- Center for Diversity & National Harmony: studying the ethnic and religious conflicts in Myanmar
- Myanmar Information Management Unit: establishing a national data culture and infrastructure
- Myanmar Book Aid & Preservation Foundation: creating and supporting a network of national libraries (100+)
- Phandeeyar Data Lab: private firm working on open-data initiatives
There were challenges during training. Least among these, I’d never taught a class barefoot before. The organizers insisted that it was fine for me to wear my shoes, but I wanted to respect local traditions, so I removed them. The class was very eager and enthusiastic to learn, perfect hosts for their Aussie/American trainer.

Above: My students and me (barefoot per the local tradition) during our Tableau training.
The country itself is also very beautiful and surprisingly still untouched by the droves of Western tourists, unlike other Southeast Asian countries. An Aussie like me walking through the city streets of Yangon was a curiosity. Beautiful people, scenic views, and amazing food. What wasn’t to love?
A few months later in August 2017, I learned that the trouble in the outlying areas of Myanmar had turned decidedly grim. The Rohingya, a stateless Muslim minority, were being forcibly moved out of the country by the Myanmar military through what appeared to be any means necessary, including intimidation, violence, rape and murder. The stories I read were horrifying, far too cruel to repeat here.
A Data Viz for Social Good
The United Nations has classified it as a genocide. Independent fact-finders have reported that more than 10,000 people have been killed, including women and children. More than 700,000 have been displaced, many fleeing for their lives to Bangladesh. So, this brings us back to the data visualization. My sincere hope is that the organizations that attended our week-long course are doing whatever possible to save lives and protect the defenseless.
If you find yourself moved by the stories of any of the people suffering in these modern genocides, I would encourage you to use the links in the dashboard to find a way to help that best suits your ability.

