
However strange it may seem at the surface, converting from a higher-education music instructor to a data geek was fairly seamless. Consider this: For as many years as I was teaching, I was gathering data. Tons of data. This included student attendance, grades, rubrics, advisement, evaluations, concert reviews and music analysis.
With Tableau, I am able to go back and reveal this data in ways I had never imagined before.
My first rediscovery project examines my own faculty evaluation survey results.
The Bad
At the end of every semester, the students were “required” to complete a short survey evaluating the course and the instructor. This is pretty standard fare. The students fill out the form (or not), then take it to the Department office. The results were then aggregated by an office (of which I cannot remember the name) and sent back to the professors months later in PDF format.
Simple. Easy to read. Pretty worthless.
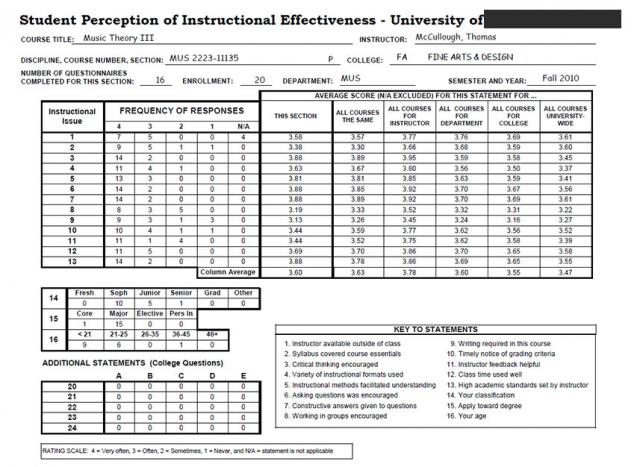
Fig. 1 – PDF survey results.
While the numbers make sense, I have no indication or comparison against my other courses within the semester or from year to year.
In order to bring this data to life, I first had to look at this result data in a different way. A Tableau way. To best consume the data, a good bit of compiling and reshaping was required.
The Better
Using Excel, the Tableau reshaper tool and a bit of time, I was able to position the survey results in a manner that would best be picked up by Tableau.
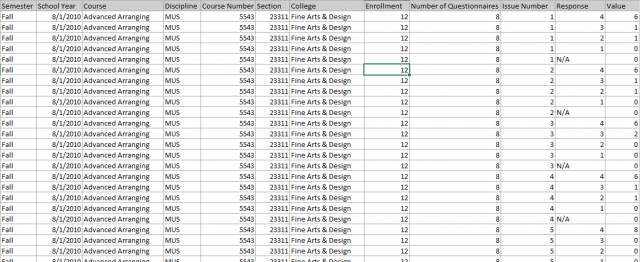
Fig. 2 – Reshaped survey data in Excel.
With the data reshaped and hooked into Tableau, it was pretty easy to duplicate the PDF survey results.
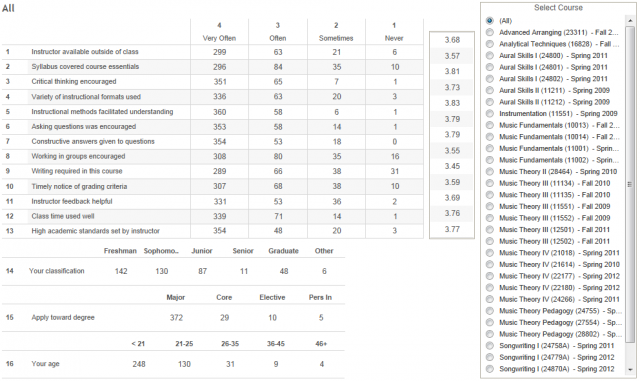
Fig. 3 – Replication of the survey PDF result in Tableau. Click to interact.
Piece of cake! Already, and with zero visualizations, I can interact with the results, comparing classes and years. Of course, this is only the first phase for Tableau.
Given that the data I received was already aggregated, I had a bit less flexibility with my end results. However, there is still plenty to see.
Now we get to sing with the data.
The Beautiful
Utilizing simple heat maps, highlight tables and dashboard filter actions, I turned the original PDF view into a slightly more visual experience. With the addition of actions, I am better able to compare courses, years, see trends, etc.
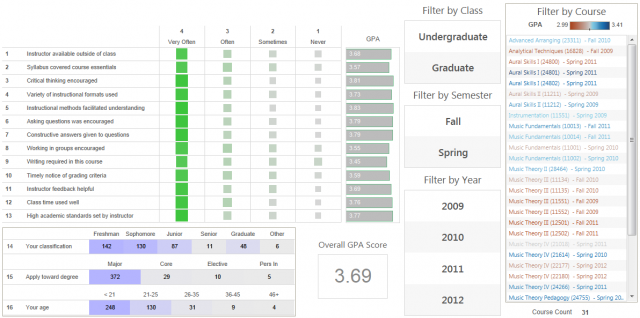
Fig. 4 – A slightly better view with heat-map, bar-charts, highlight table and dashboard filter actions. Click image to interact.
I am still only re-creating the original report at this point. I need to build dashboards that allow me to analyze the data.
The Analysis
I want to take the visualizations further so I can make better decisions based on data. With Tableau distribution charts, the box plot, multiple-mark chart and the Likert Scale (Thanks Steve Wexler and Joe Mako!), I can now analyze the truth in the data!
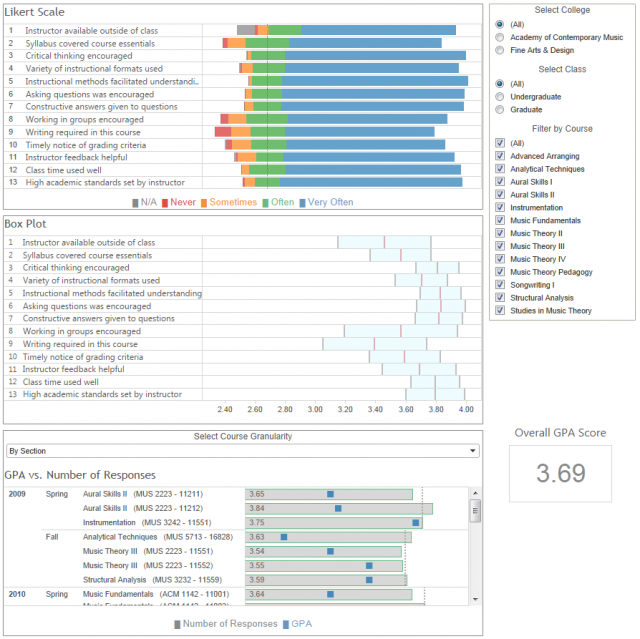
Fig. 5 – Tableau 8 dashboard showing three higher-level analyses of the original report.
Conclusion?
I have only started finding stories in this data. (First, my students loved me! :D)
Oh, what I would have given to have a tool like this when I was still teaching.
For over ten years, my place in the world was to educate students. With the help of Tableau, perhaps the task my new career sets upon me is to educate the educators.