During a recent project, I received an interesting question:
“Can we swap what dimension is displayed in a stacked bar chart based on a filter being applied?”
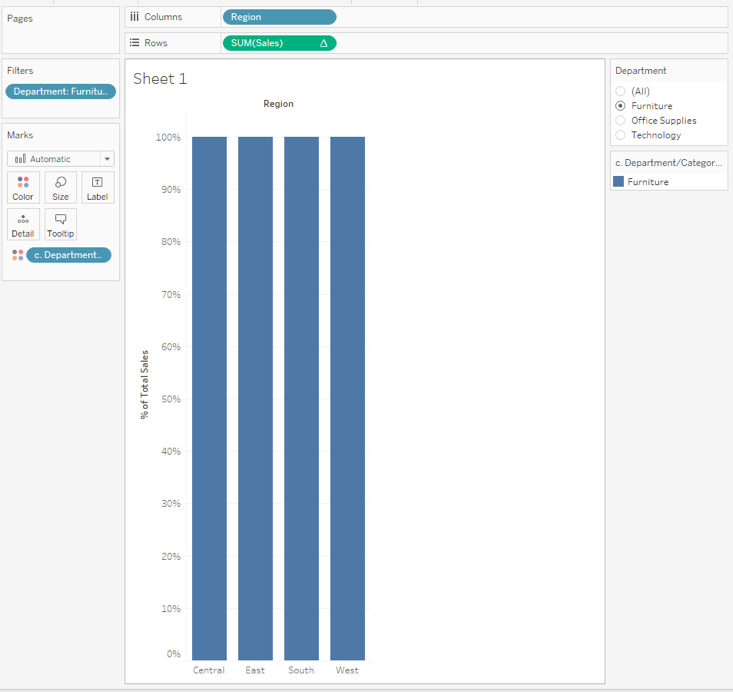
I’ve decided it would be easier for me to answer this question by showing you how to do it with the Superstore data. Below, we have a stacked bar chart displaying percent of total sales by departments within regions:

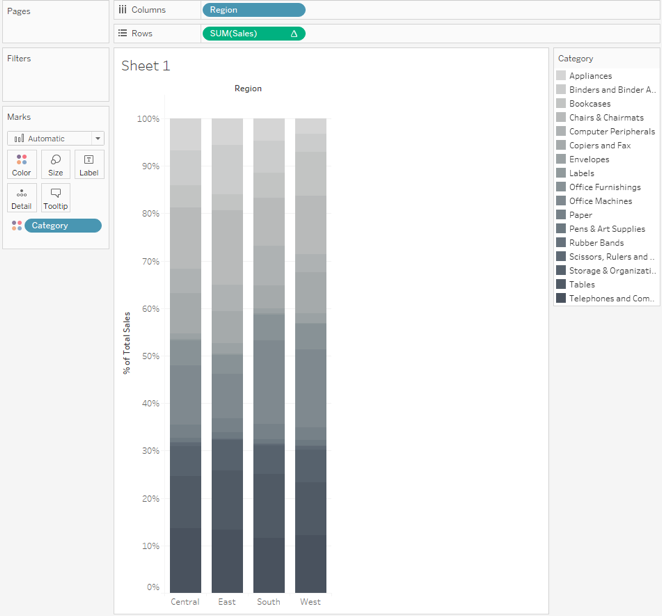
This looks clean enough and reasonably informative. Now, if we replace Department with Category, we get the following mess of a visualization:
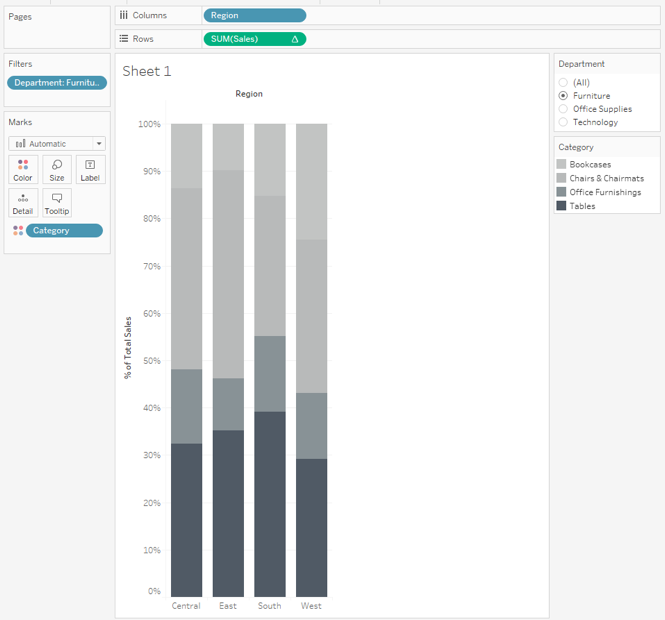
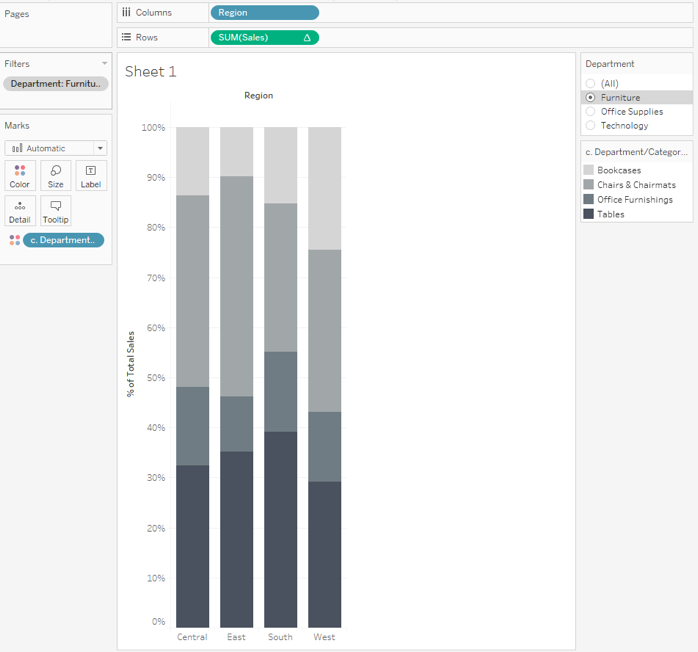
Because Department and Category are hierarchical and mutually exclusive, when the visualization is filtered by Department we get something much more manageable:
The client wanted to show the bars broken down by department when All is selected. Plus, they wanted to show the categories that belong to a department when filtered by that same department.
Complexity vs. Efficiency
So, the long, non-efficient way to do this would be to swap-out worksheets in a dashboard using a parameter. This is fine, but overly complicated when there is a quick, efficient solution available using a level of detail (LOD) expression and a context filter!
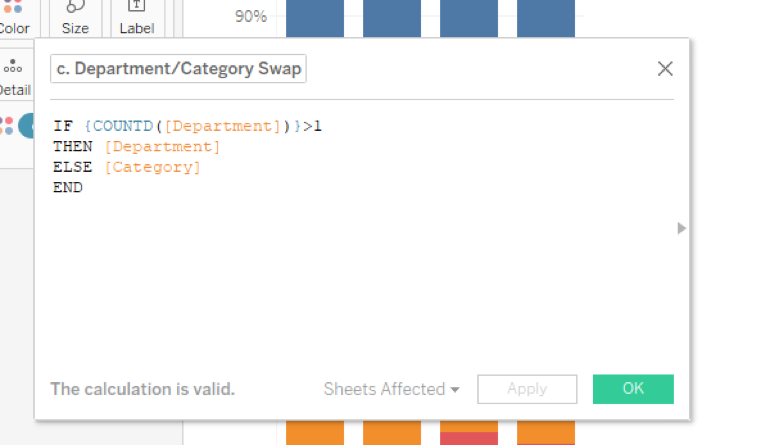
We are trying to build a calculation based on more than one distinct department displayed in the level of detail view. When you show All departments, the COUNTD([Department]) will be >1 and return Department. Otherwise, it will be =1 and return Category when filtered.
The obvious issue here is the limitation non-aggregated dimension returns in an aggregate statement. However, by using a globally fixed LOD statement wrapped around the aggregate statement of COUNTD([Department]), we can skirt this issue:
Now, you would think we could place this calculated field on Color on the Marks card, filter our department and return our categories related to that department, right? Unfortunately, that will not work as you can see below:
So, what is going on here and why are we only seeing a single department returned rather than its categories? This is due to the standard order of operations within Tableau:
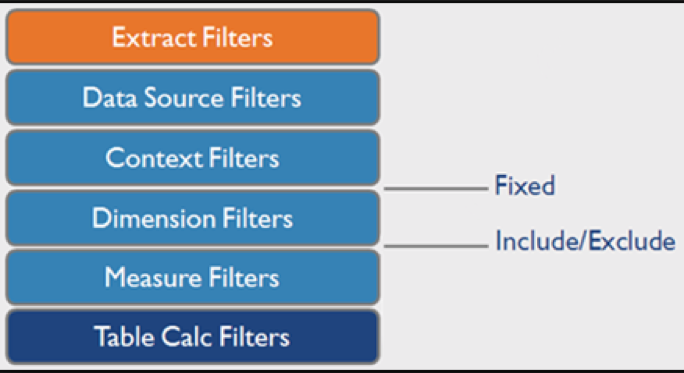
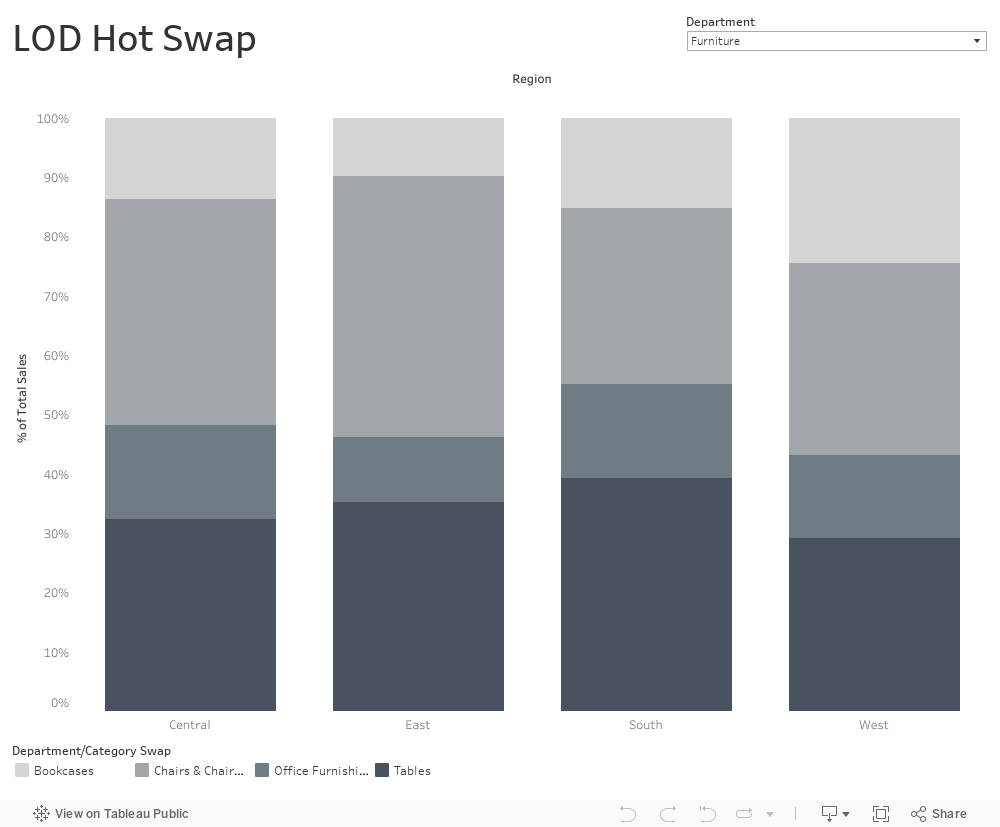
Remember that fixed LOD expressions ignore all filtering by default. However, it will not ignore a filter added to Context! If we add the Department filter to Context, the visualization will now function as desired. When All is selected, we can see sales is broken down by department:

And when we select a single department, we get its associated categories:
And there you have it! Efficiency and magic produced through LODs! You can see the final viz below.