The most common calculations I make in Tableau are date-related. I’ve made hundreds of them with variations for year-over-year, month-over-month, rolling date ranges and a long list of customizations. Some of our most popular blog posts at InterWorks are those teaching people how to handle this kind of date math. Frankly, a need this common should be easier. Well, now it is!
The template described below contains common date-based options and calculations. It simplifies your workflow, letting you cut and paste all the logic you need. Customizing those options takes a few simple steps.
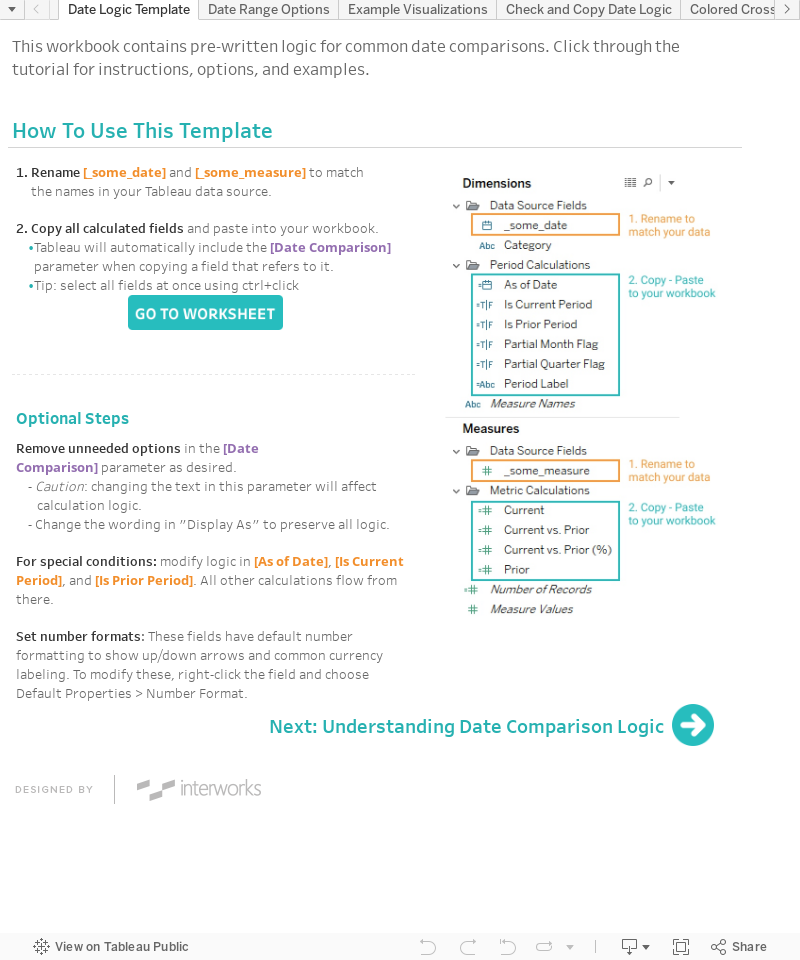
Using the Template
- Download it from Tableau Public (which may be updated periodically), or click on the file at the bottom of this post.
- Open the workbook in Tableau Desktop, and start on the tab named Date Logic Template.
- Read the procedures there, then click Go to Worksheet to access the data source with the calculations you need. This worksheet also lets you inspect the result of each calculation and parameter option day by day.
- To further understand the options and how to use them, click through the tabs for detailed logic explanations and instructions on building the example visualizations.
Performance Considerations
Astute observers will see that this template uses a lot of parameter-based row-level calculations. These can negatively affect performance, especially on larger datasets. If you experience poor response times with your data, you can remove the parameter references and create separate calculations specific to each time range. That approach lets you materialize the calculation result in a Tableau extract.
Further Reference
For more in-depth explanation and variations on date calculations, see these posts:
- Advance with Assist: Filtering Select Dates with DATETRUNC
- Advance with Assist: NOW and TODAY Functions in Tableau
- Period Comparison with Set Actions in Tableau
- The Ultimate Guide to Year-over-Year Comparisons in Tableau
- Date Comparisons in Tableau Made Easy
- Easy Year-over-Year Comparisons in Tableau
- Date Calculations in Tableau
If none of these resources speak to your specific need, we’re here to help! Contact our experts for customized support.