One of the most frequent tasks you might come across when working with Tableau is comparing data over time. Any KPI that is measured needs to be put into some kind of context to make it more tangible and give a feeling of perspective. “Our sales are at one million euros” is different from “Our sales have increased by 80% from one million to 1.8 million euros.” The latter example tells you whether the number you are looking at is good or bad when considering previous periods.
Although Tableau is great at giving users control over which range of dates they want to see with relative date filters, date range filters and all the other options out there, it lacks out-of-the-box functionality for year-over-year (YoY) comparisons that go further than simply comparing one full year to another full year. This has to be done with the help of some calculations.
More Flexibility with Time Comparisons
There are several ways to do year-over-year comparisons in Tableau, and once you have mastered them all, you will have the right method to apply in any situation. Furthermore, these comparisons can also be applied to different periods, like month-over-month or last month compared to last month in the previous year.
Lastly, I want to reassure you that you won’t have to learn all the formulas mentioned here by heart, as I have built a date comparison repository you can download and from which you can copy and paste calculations into your own data source. Just replace the date field I have used in the calculation with the date field in your workbook, and you are good to go.
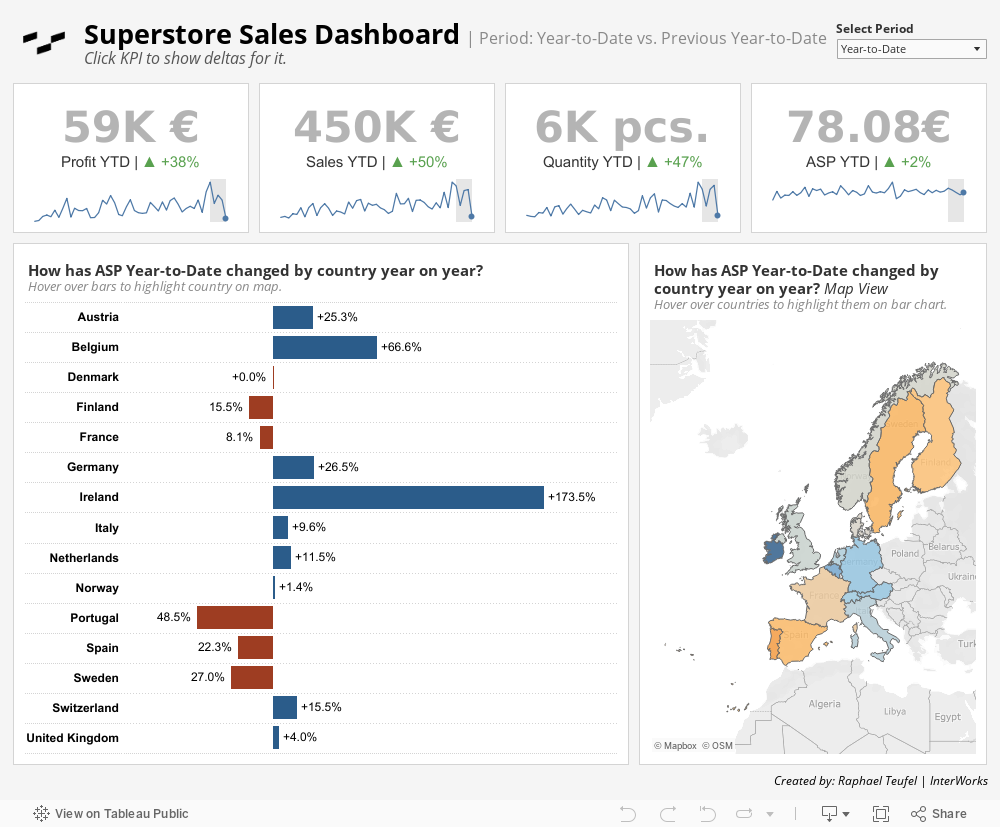
All of my examples use the same setup: I will compare the current year’s sales to the previous year’s sales in the Superstore Sample Database by Country. I hope this makes it easy for you to check the results and recreate them in your own copy of Tableau.
Let’s get started.
Year-over-Year Comparisons with Table Calculations
This is probably the easiest way to compare this year’s numbers against those of last year. However, if we want to compare the current year with any year prior, we need to make sure that we are looking at the same time period in both.
If we were just to use a date field and compare the two years, we would not be looking at the same kind of information. Because the previous year has already finished, we are looking at 12 months’ worth of sales, whereas the current year is not yet over (unless you are reading this on December 31st at 23:59 – if so, leave your computer and watch the fireworks). Therefore, we cannot compare the two.
Here are the steps necessary to compare equivalent periods year over year:
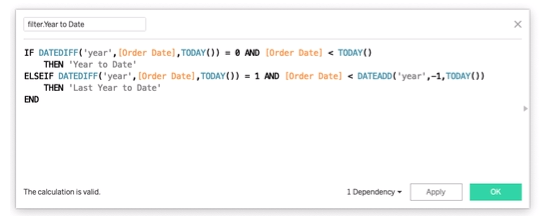
1. Create a Year to Date filter calculated field.
The Year to Date filter looks at the Order Date in each row of your data and evaluates whether it is in the Year to Date period, in the Last Year to Date period or in neither of the two:
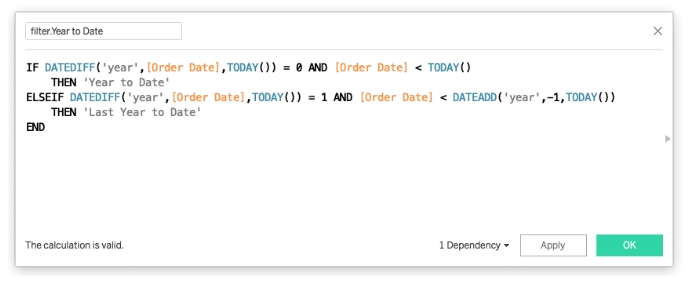
The functions used to evaluate the dates are DATEDIFF and DATEADD.
2. Hint: In order to check if the date calculations are working, I like to create a table with Month/Year of the date on Rows. Then, I place my date calculation on Text to see which month falls into which category.
3. Drag the Year to Date filter into your view, along with your KPI (in our case, that is Sales):
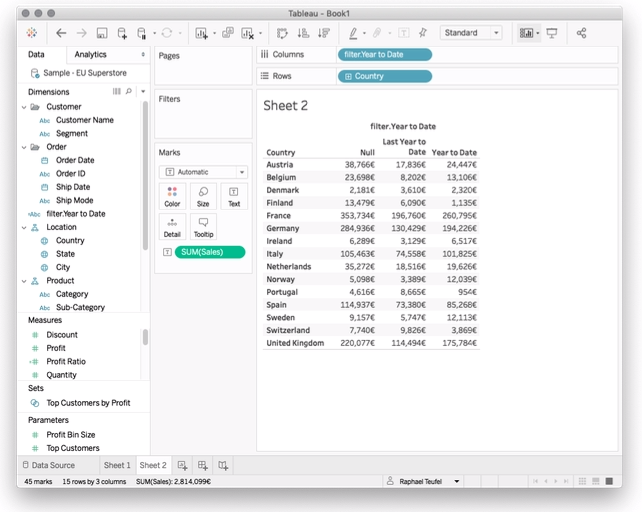
4. Filter out the null values by right-clicking the Null column header and choosing Exclude.
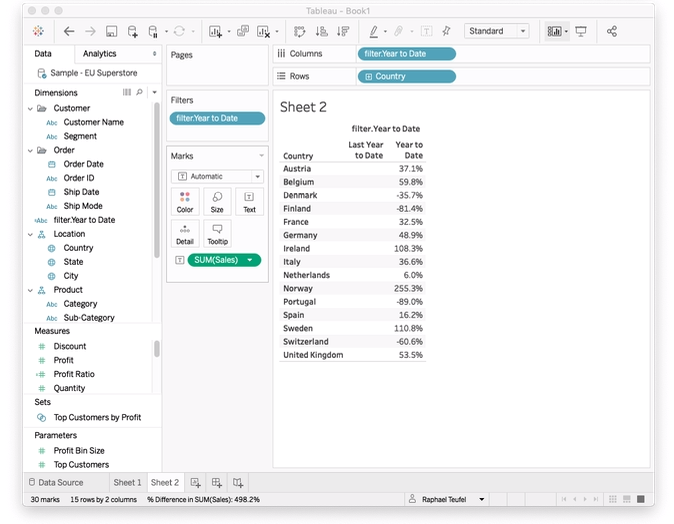
5. Right-click the measure—for us, SUM(Sales)–and select Quick Table Calculation and then Percent Difference:
6. You can make the view a little prettier and more insightful by showing it as a bar chart, hiding the Last Year to Date column and adding labels to the bars:
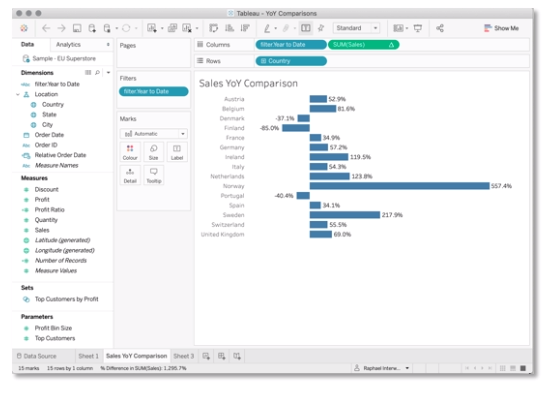
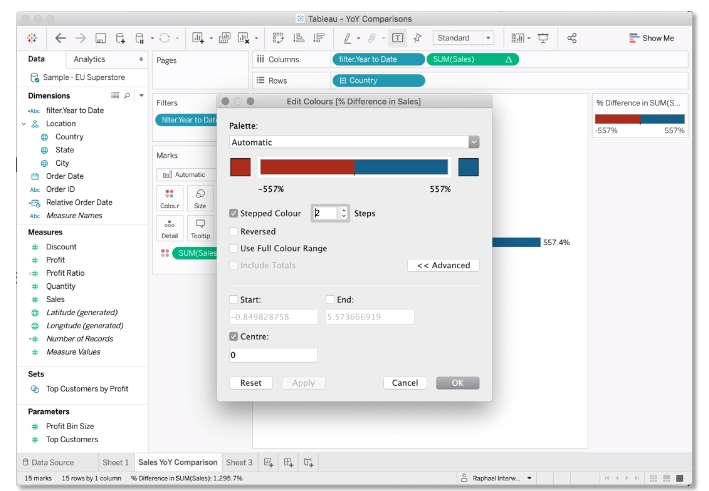
7. Lastly, we can use the YoY calculation field (Table Calculation) to colour our bars accordingly – blue for positive change and orange/red for negative change – by placing the YoY calculation measure on Colour. In order to keep this clean, I will use a Stepped Colour range with 2 Steps and 0 as the Centre:
Year-over-Year Calculations with Calculated Fields
In case you’d like to do more advanced or complex calculations, or just store your YoY calculations in a field that can then be used like any other measure, this approach might work quite well for you.
In essence, rather than aggregating measures and then using table calculations to calculate YoY changes, this approach solved everything inside the calculated field, and this is how it is done:
1. Step 1 is the same as in the previous approach: Create a dimension that you can use to filter Year to Date and Last Year to Date:
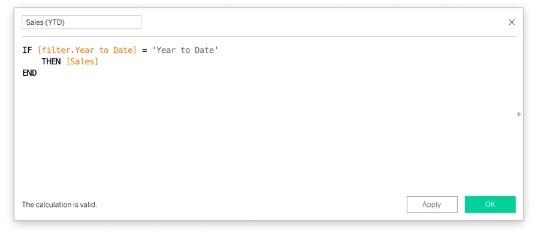
2. Next, we create a calculated field that will give us the current year’s sales:
3. We repeat step 2 for the previous year to create a second field [Sales (LYTD)].
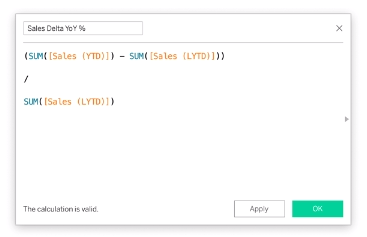
4. Now, let’s calculate the percent difference between this year’s and last year’s sales. Keep in mind that we haven’t aggregated the measures yet. Hence, we need to make sure we do this in the calculation of percent change. Otherwise, the delta is calculated at Row level and then summarised, which does not make sense in most cases. So, here is how the YoY delta is calculated:
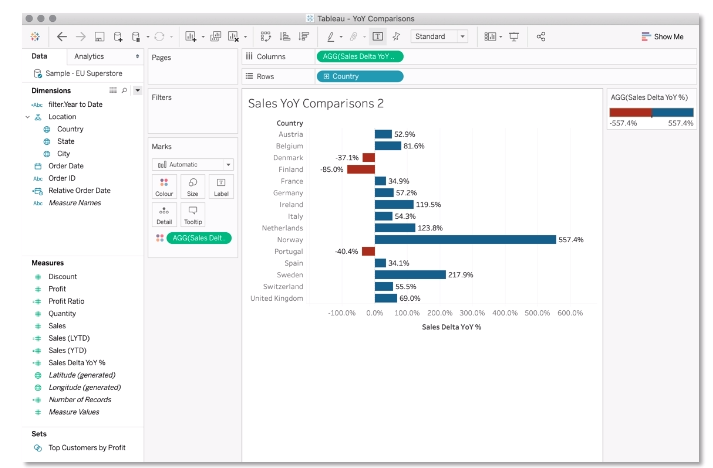
5. Lastly, we can build the visualisation again. However, this time, there is no need for filters and hiding columns:
Year-over-Year Comparisons Next Level: Giving the User the Choice
If we want our YoY comparisons to be less static and give the user a selection of date ranges or periods to choose from, we can make our dashboards way more powerful as they can now serve several purposes: answering questions of how we are doing NOW (e.g. this week), as well as looking into the past to answer the question of how we got here.
In order to create a YoY date filter that is driven by a user selection, three things are needed:
- A parameter to make a selection
- A date filter (as has been created in the previous examples)
- Calculated fields that return the current period’s and previous period’s data, as well as fields to calculate YoY deltas
Let’s get started.
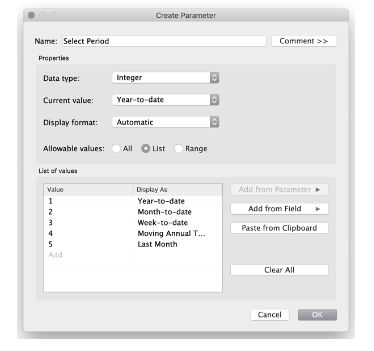
1. We first create a parameter that contains all possible date selectors needed for the dashboard. I generally go with the following, but feel free to add or change as many as you want:
-
- Year-to-date
- Month-to-date
- Week-to-date
- Moving Annual Total
- Last Month
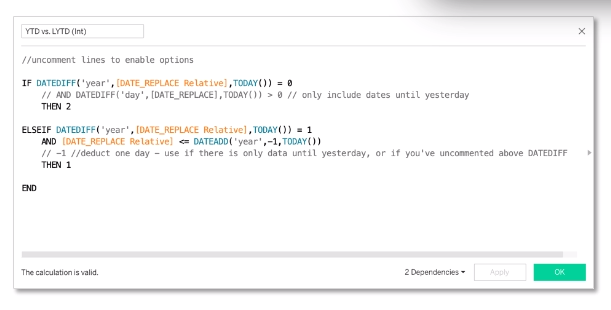
2. Next, a calculated field is created that changes the dates it filters based on the parameter selection. To make this possible, the aforementioned date filter needs to be adjusted slightly.
Because there will be different time period filtered, if they are named, e.g. “Year to date” or “Week to date”, the filter would look different for each parameter selection. This makes it really difficult to use the filter in a calculation since its value changes, and you would need to accommodate for any possible value the date filter might return. Therefore, I will just call the current period 2 and the previous period 1. This has the positive effect of the previous period always being shown first in a list or in columns:
Note: This is how your date calculations should look to be used in the parameter-driven date filter.
The flexible period field:
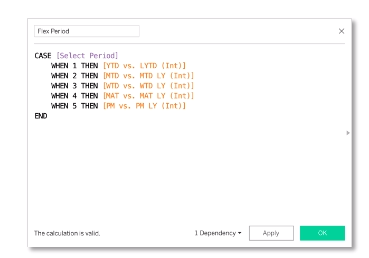
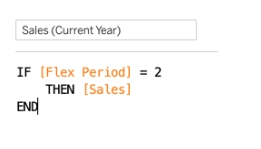
3. The last step is to include the Flex Period field in the calculations just like before:
You can find the detailed calculations in the attached workbook.
I hope this was a good overview for you on how year-over-year calculations can be done quite easily in Tableau. It doesn’t stop here: you can tweak all the calculations to your liking. Ways to do this include looking only at completed months or making your delta values more visually appealing by applying conditional formatting to them.