
Last month, I graduated from an MBA at Strathclyde Business School. The experience was deep, vast and mind-opening. I learned an epic amount about the business landscape, including almost anything you can think of from marketing to finance—and yes, data, too!
However, like the rest of my class (made up of professionals doing the course part-time while making the next move in their careers), I spent way too much time producing pretty average charts … not to mention the frustrated hours I wasted in wanting to throw my laptop out of the window because of Excel. I think we all believed there was no alternative and couldn’t even imagine that there would be (except for some engineering types who swapped the pains of Excel for those of Matlab).
But we were wrong!
An Introduction to Tableau
Since recently starting a new job at InterWorks, I have been falling deeper and deeper in love with Tableau. Maybe you, like me, had never heard of it, or perhaps you’re luckier than me and have been familiar with it for some time. It is so intuitive, interactive and well-designed. Not only does it effortlessly produce beautiful charts that would have doubtless added marks to my assignments, but it also would have blown away my colleagues, professors and project clients during countless presentations.
So, in light of my new revelation in data visualisation, I thought I would go back and rework one of my university projects to see the impact Tableau would have had. You be the judge.
Data Makeover with Tableau
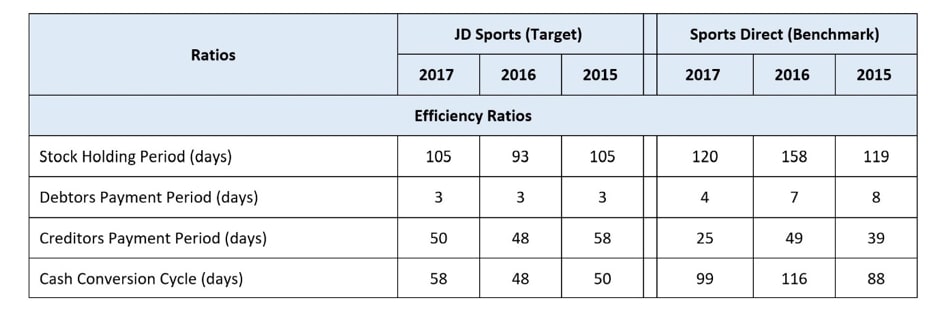
Above: The original data from the project that compares efficiency ratios
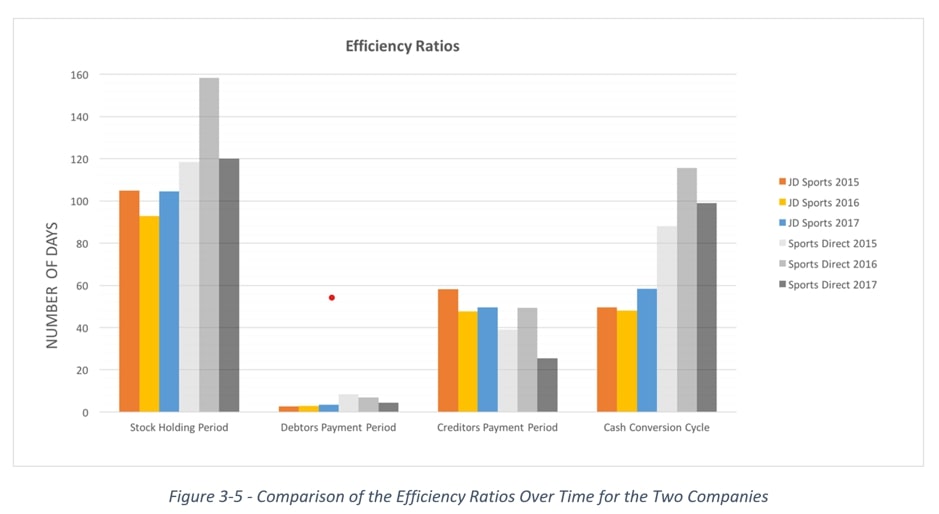
With this data, this is the best chart we could come up with at the time using Excel:
However, here is what I came up with in Tableau:
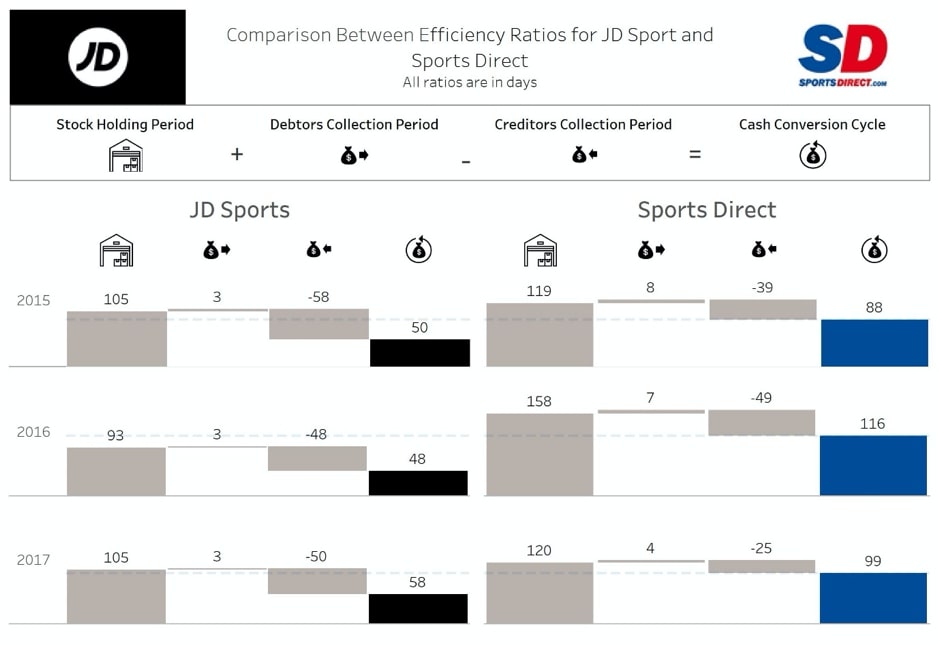
This is called a waterfall chart, and my fellow InterWorker Nelson has written a blog that takes a closer look at this chart form. I have adapted it to represent how parts can add and subtract to make a final number. Check back soon for the next part of this blog for the step-by-step process of how to do this!
Don’t take my word for it, Tableau is offering free student licences, check it out here.