
The Drawing Tool has been incorporated into CBI Studio by InterWorks. Explore CBI Studio to see what’s new.
When it comes to Tableau, I have something of a soft spot for the mapping functionality in all its glorious forms. Maybe I was a pirate with treasure to hide in a previous life, or maybe some intrepid explorer. Either way, I seem to delight in finding new and interesting ways to plant an X on a map.
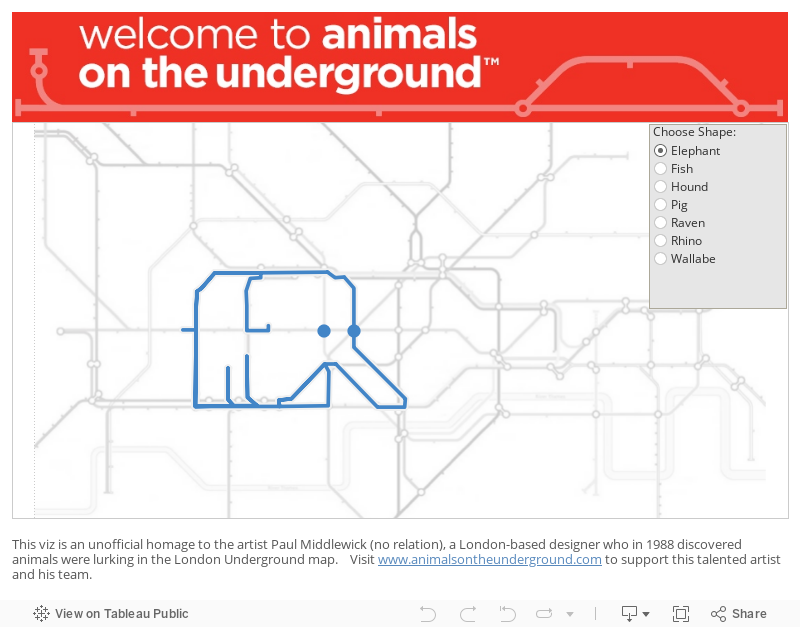
Recently, I had a client ask me rather sheepishly if it was possible to put an X on a fictional map. I just smiled and said “absolutely.” I’ll save them their blushes and instead share how I paid homage to world famous artist Paul Middlewick (no relation) when I recreated his “Animals in the Underground” art to demonstrate just exactly how this is done.
First, Acquire Your Map
First and foremost, you’ll need your fictional map. It could be a something like Tolkien’s map of Middle Earth, or it could be something a little more grounded like a building or site schematic. I’m using the London Underground map, and I’ve chosen to de-emphasise the various colours and present this as a simple greyscale representation. I also sourced a map minus any text labels. This allows me to superimpose my homage without any background clutter.
Before we start plotting anything on the map, we should work out what proportion of your finished dashboard the map will represent, since you’ll be overlaying points or polygons using the X and Y pixel locations on your map. The easiest way to do this is to set up your dashboard layout, placing an image component onto your dashboard canvas that shows the map at exact size. If the map is too big or small for the area you have allocated, then use an art program like Microsoft Paint or even PowerPoint to resize your image to the appropriate size. Make a note of the height and width of your image in pixels, as you’ll need this later.
Using Drawing Tool for Tableau
Next, you’ll need to visit InterWorks’ Drawing Tool for Tableau – a free little tool we have for exactly this purpose. You can drag and drop your image from Windows File Explorer onto the Drawing Tool. Then, you need to choose whether you want to overlay polygons, lines or dots onto your map.
This video outlines how to use the Drawing Tool: Drawing Polygons with PowerTools Drawing Tool.
Regardless of whether you’re mapping points, lines or polygons, what you’ll end up with is point data that can be copied in CSV or table format and established as a data source.
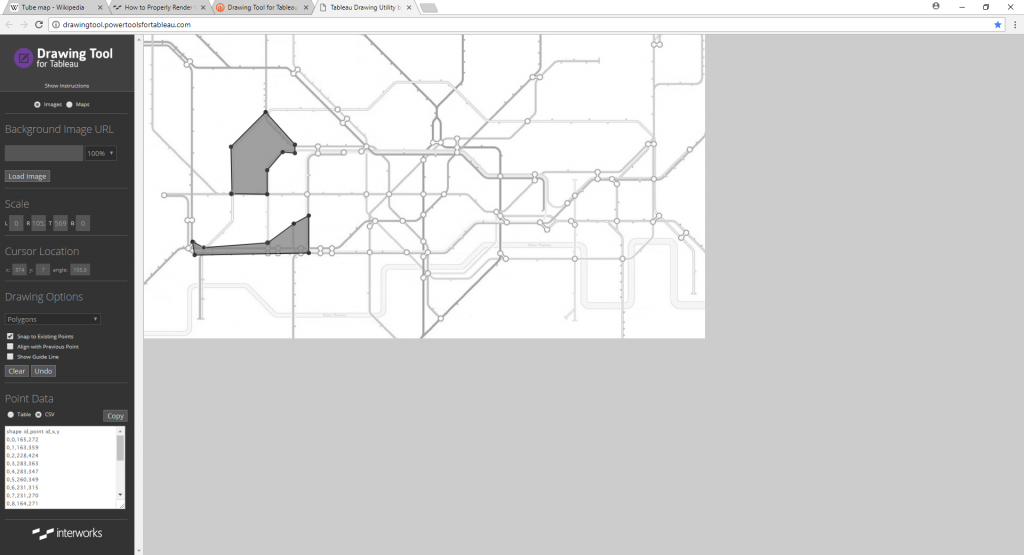
Above: As you draw your map shapes, the point data is added. Copy this out as either a CSV or Excel table to start using it as a data source in Tableau.
Bringing the Data into Tableau
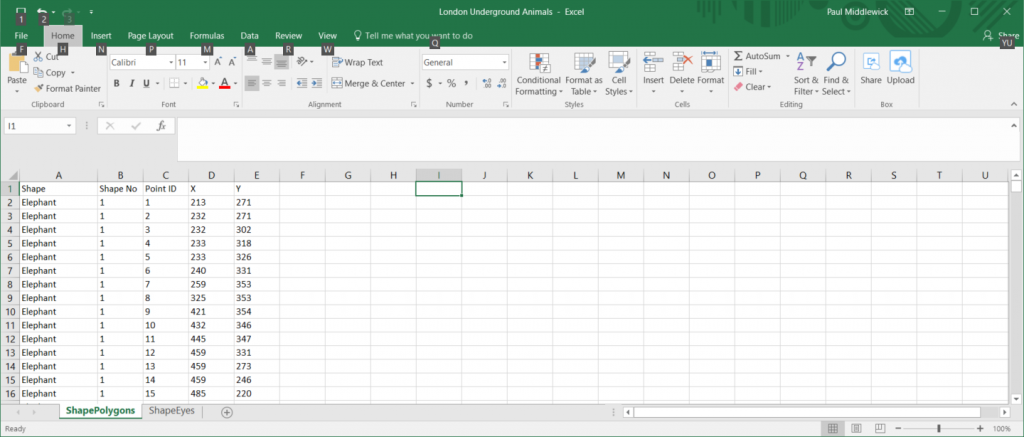
I always choose to copy this data out as a table and paste it into Microsoft Excel. This enables me to enhance the data with additional columns. It is then ready to use with Tableau directly or with an ETL tool to load into my data repository. In my case, I’ve created two separate Excel tabs: one containing the line data for the shape of each animal and another containing point data for the location of their eyes. This is then joined in Tableau.
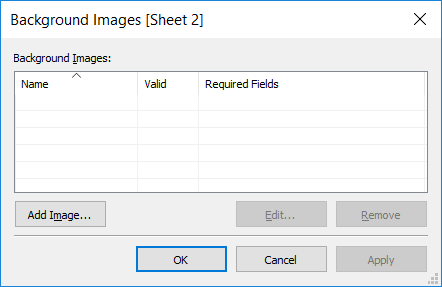
We then need to tell Tableau that we’re including a background image on our map. Go to the Maps menu and select Background Images. You’ll be presented with this screen:
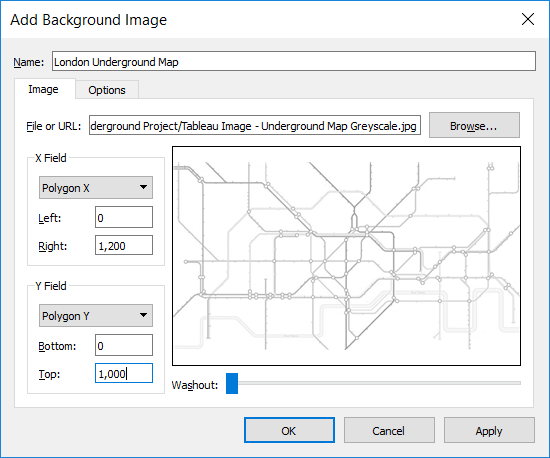
- Click the Add Image button and browse and select your image
- Select the data field with the X coordinate location
- Repeat for the field with the Y coordinate location
- Enter the right and top pixel counts of your image, so if you have an image that is 1200 wide by 1000 pixels tall, your setup would look like this:
Now that Tableau knows there is a background image, lets present it and overlay our data:
- Add your X coordinate data field to the Columns shelf
- Add your Y coordinate data field to the Rows shelf
- Add your PointID and ShapeNo fields to the Details shelf
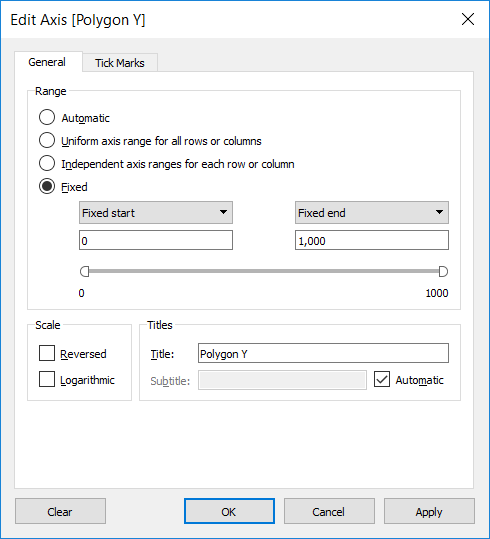
- Edit both your X and Y axis and use the fixed scale option to ensure the entire image is always shown, like this:
Change your marks type to Line if drawing lines, or polygon if drawing polygons, and your shape should appear on the image:
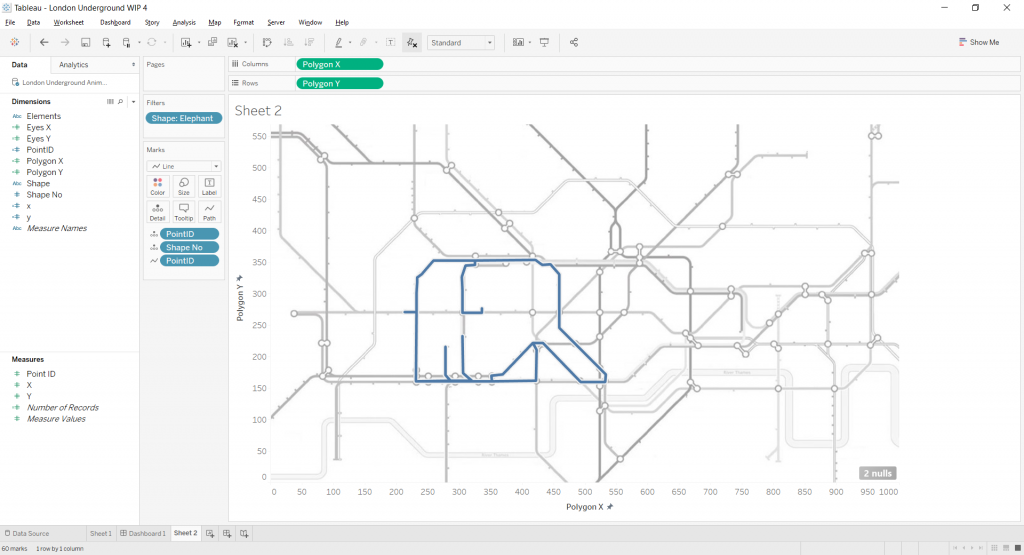
Above: In this image, I also have a filter on shape, as my data source includes the outlines for multiple shapes.
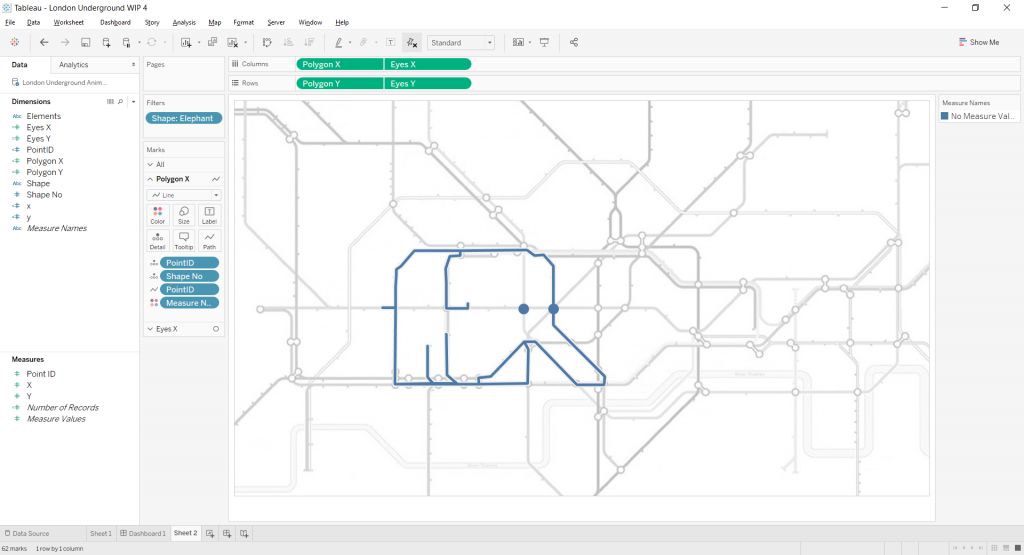
Adding the eyes in my viz or other mapping data in your own viz can be accomplished by using a dual-axis map.
- I added the additional X and Y dimensions from my Eyes datasource to the Rows and Columns shelves
- I made the chart dual axis by clicking on the new pills and selecting Dual Axis from the menu
- I synchronised the secondary X and Y axes
- Because my second set of data is point data, I changed the mark type to Circle
- Hide your X and Y axes and “voila!”
Below is the final Tableau visualisation. Please feel free to download this workbook for a look at how it was put together. If you like what you see, then please visit the Animals in the Underground and support Paul’s & Co’s work.
If you have any questions or mapping scenarios, I’d love to hear from you. Take a look at my Tableau Public gallery and www.interworks.com\viz-gallery for other great examples.