
So, Here’s the “Why”
In Tableau, we are easily able to slice and dice the data according to our dimensions thanks to the default manner in which Tableau aggregates the data on our behalf. Therefore, I can simply add any measure and trust the view is appropriate at that level; from an overview, down to the finest level of detail, Tableau aggregates accordingly. But what happens when we have aggregate data, and we need to re-aggregate?
For instance, what if I want to categorize and then summarize my sales data at a higher level than what currently exists in my data? As indicated in the picture below, my sales data is actually down to the item level for each customers’ purchase.
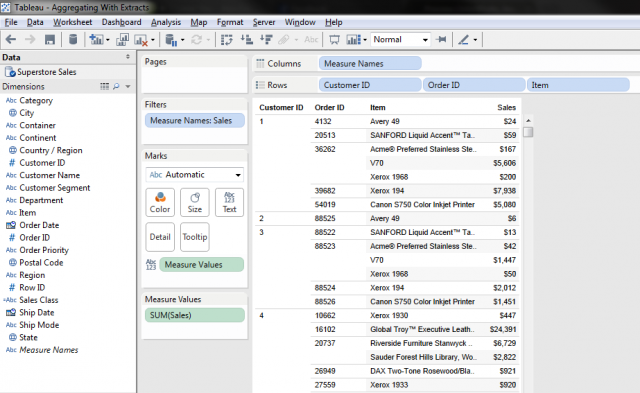
Let’s say I would like to classify purchasers based on the overall amount they have spent rather than by each individual transaction. I don’t currently have any dimension in the data set that categorizes these sales, but there are a few ways I can create a solution in Tableau.
I could create a conditional filter, or perhaps a series of sets for each one of these categories, but each would only allow me to view one category at a time. Most likely, I would build a custom calculation to create a new dimension in Tableau. I decided to create the following calculated field.
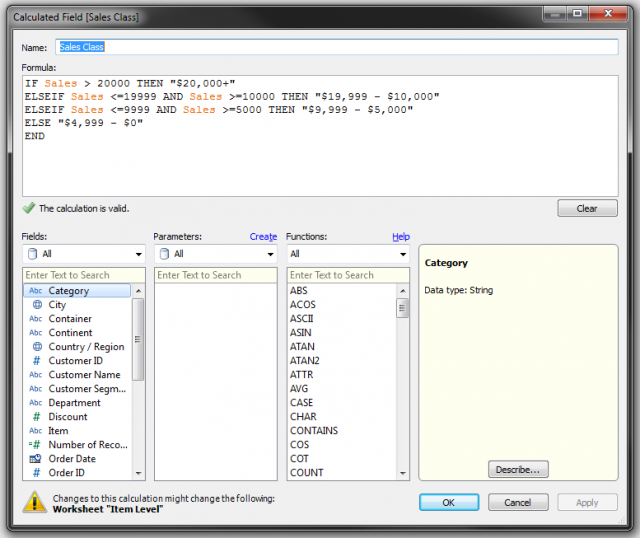
The following calculation gives me the result I’m looking for; or so I think. This calculation allows me to view the sales classification against the entire data set to see the proportion of all categories at one time, but I wouldn’t be able to view a customer level summary with this calculation because it is performing at the row level, which is per each item sold (added color for emphasis of applied calculation).
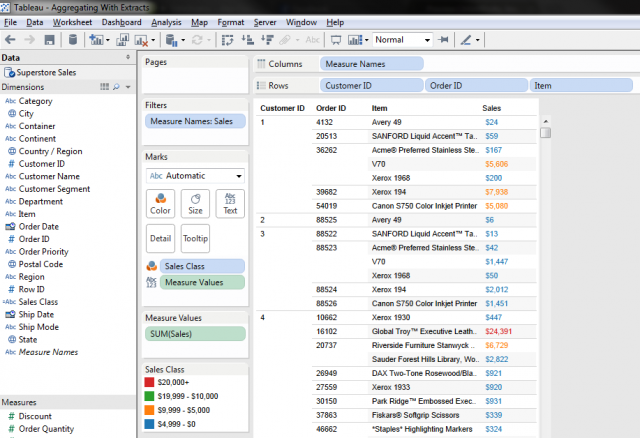
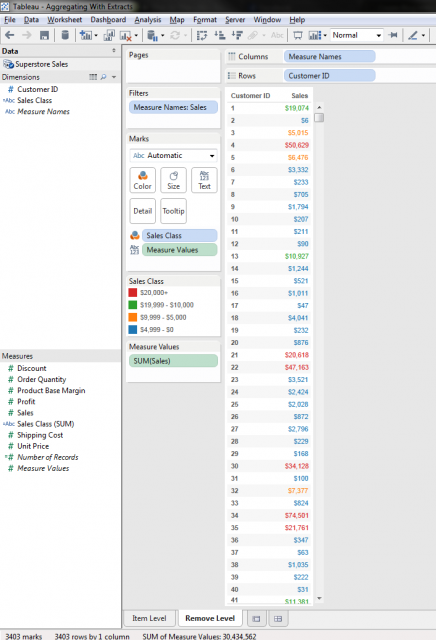
Although I can view the classification for each item that was sold, I’m interested in what my customer’s total spending level is. For example, if you view Customer #1, the overall sales total just over $19k, but according to our calculation, the sales classification is being made for each item that Customer #1 has purchased, sometimes multiple items per order. “Just remove the Item and Order levels,” you say. Let’s see what happens as a result.
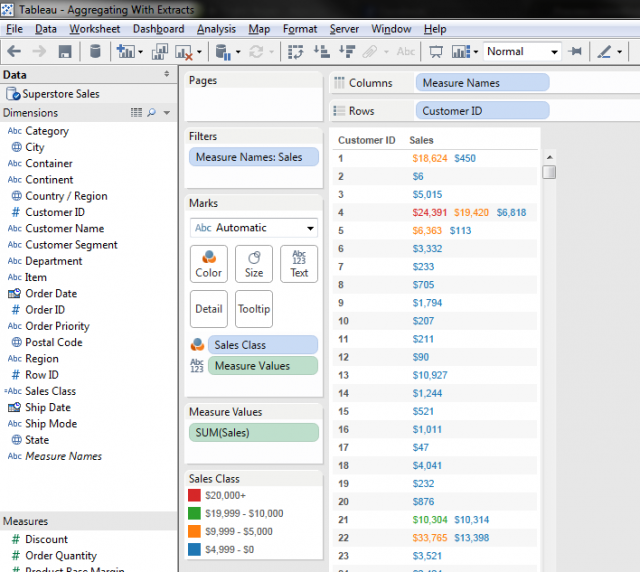
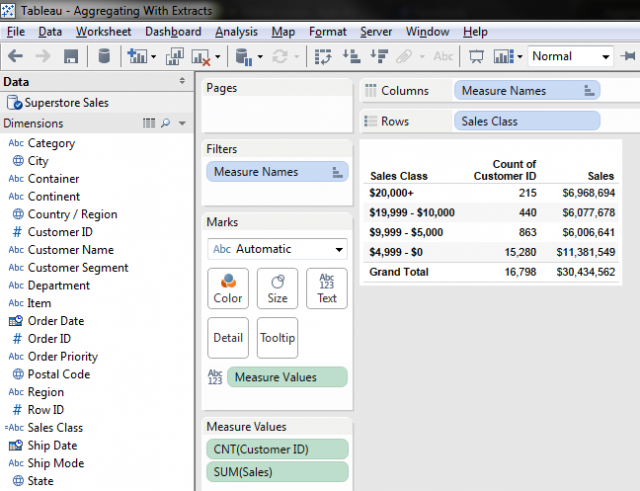
Thankfully, and unfortunately in this case, Tableau is still properly applying our row level calculation according to each item every customer has purchased. So, why is there only two entries, and why is one entry over $18k and colored orange according to the $9,999 – $5,000 range? If you look carefully at the previous screen shot, Tableau has summed up all like classifications. We had three items for Customer #1, each item in the $9,999 – $5,000 range, totaling $18,624. The rest were all items at or below the $4,999 threshold. Not exactly the result we intended. The calculation is unable to roll up according to the Customer level. But wait…here’s the great news. We can once again utilize the power of extracts to help for this scenario!
So, here’s the “HOW”…
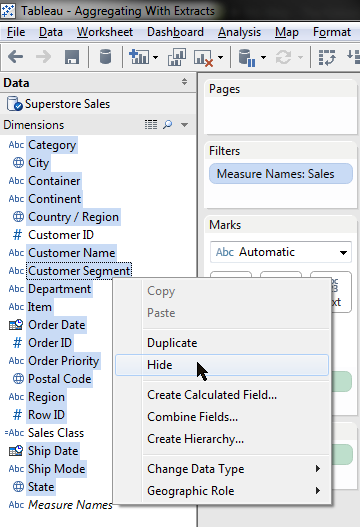
In order to fix this, we can create an extract and aggregate the data according to the level that we’re interested in (I hope now you’re now saying to yourself, “So that’s what that check box is for”). First, we simply hide all of the levels of detail that will interfere, or be of finer grain, than the level we are interested in, which happens to be Customer ID. Therefore, if we hide the Item and Order ID, Tableau will aggregate the sales to a higher level, allowing us to see sales by customer (I am hiding all of the unnecessary dimensions for simplicity of the example).
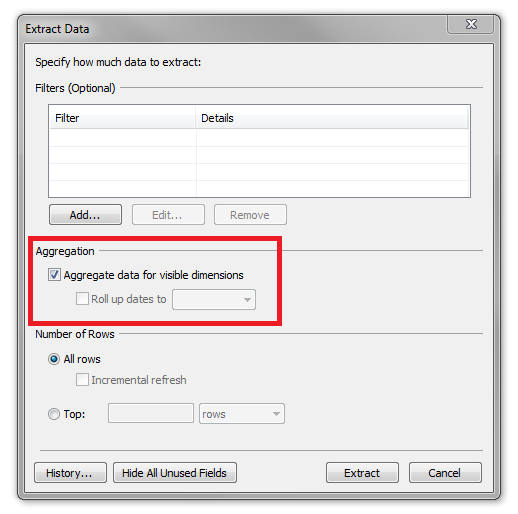
From this point, we can create our Extract, making sure to “Aggregate data for visible dimensions.”
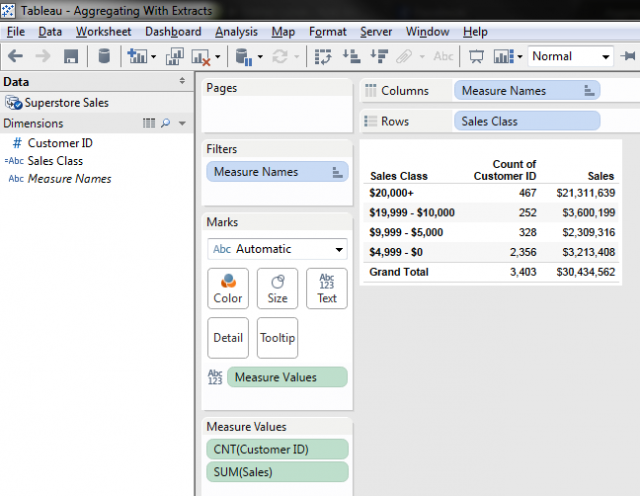
Now, we can see our calculation applied to the Customer level.
Now that our calculation is being applied in the manner in which we were hoping, we can use it more functionally across the data set to see a summary of our customers (below TOP) versus the Item level (below BOTTOM) which skews our summary results and show us every record (item) instead of looking at our customers.
Please feel free to comment or email with any questions and/or suggestions on this post. Happy extracting!