
I jumped at the chance to play with the first beta of Tableau 10. The theme I recognize the most centers around one thing – less clicks to get to answers more quickly.
- Tableau got a makeover
- The world of clean visualizations
- Connect to more data
- Filter across data sets
- Click to create new areas
- Cross database joins
Tableau Got A Makeover
First up was a pleasant SURPRISE…
Tableau got a makeover! I’m loving the slick new look and feel. From a design perspective, Tableau’s keeping up with times and is following the trend of a clean and crisp interface. The difference between blue and green pills (or active fields, if we’re being fancy) is more obvious than ever.
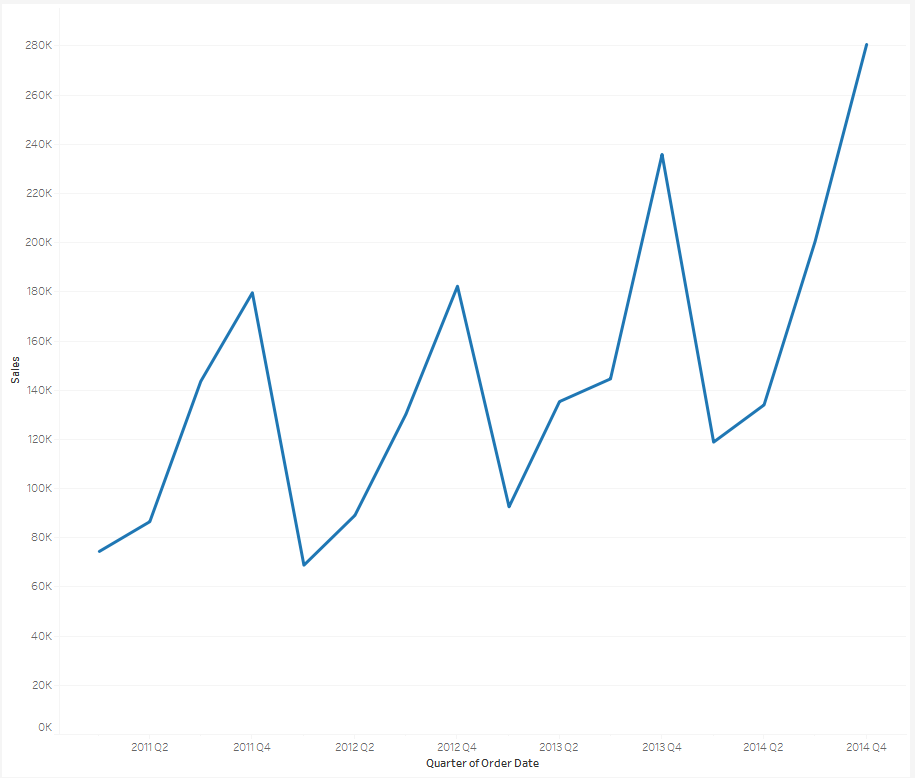
The World Of Clean Visualizations
The user interface wasn’t the only thing with an enhancement. When working with client views, we try to instill the “Less is More” idea. A best practice for visualizations is to remove non-data ink – any extra pixels that aren’t helping to tell your story. Tableau’s new “Smooth” default visualizations eliminate most of the tedious steps required in cleaning up a visualization. This will save SO much time in the sometimes-difficult-to-conquer formatting menu. You can see in the time series below that the vertical grid lines are removed and the axes are faded. This allows the reference points to fade away and focus only on the seasonal pattern of our Sales.
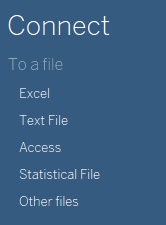
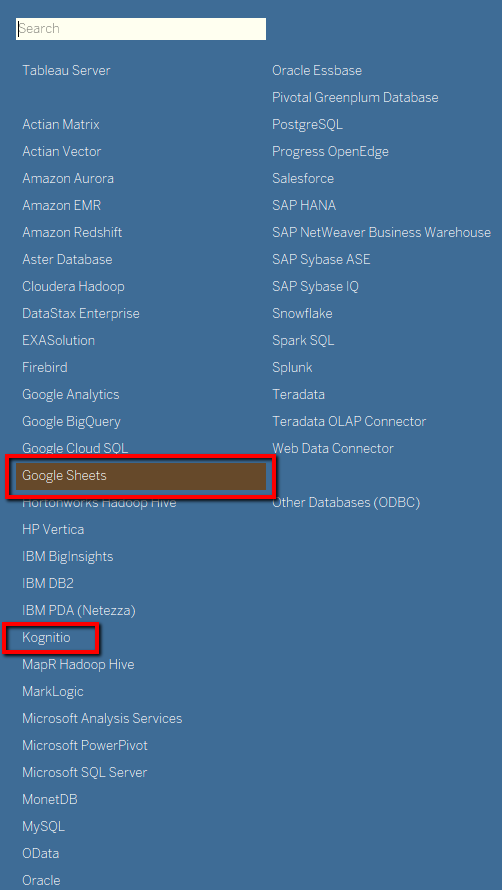
Connect To More Data
Want more data? Tableau continues to give us new connectors with Google Sheets and Kognitio. Direct connections to the answers you need – faster than ever!
Filter Across Data Sets
“Analytics at the speed of thought!” was a key phrase I remember hearing in the Tableausphere, but there are still a few times I run across a feature and think, “hmm, this could be done in less clicks”.
Imagine a scenario where you have two separate data sources with Zip Code level detail. As you analyze this data, you’d like to drill down into a specific zip code. However, we’ve been taught that a quick filter only applies to its original data source. Bummer. Historically, this meant we’d have to create a dashboard action or parameter to filter across both sources at once. Too many clicks.
NOT ANY MORE!
As I built out my two maps, I could choose to use my quick filter for “All related data sources”. I was so excited to use this new feature and BOOM!
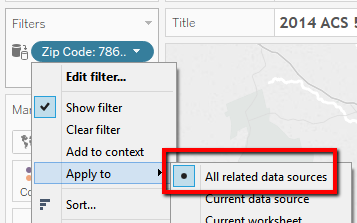
It didn’t work. 🙁
After a bit of investigation I realized that the field I was using for my quick filter was not named exactly the same in each data set (Zip vs. Zip Code). Similar to the hiccup we experience in Data Blending, I figured it was worth a shot to try creating a custom relationship between the two fields. A few steps after Data-> Edit Relationships and BAM!
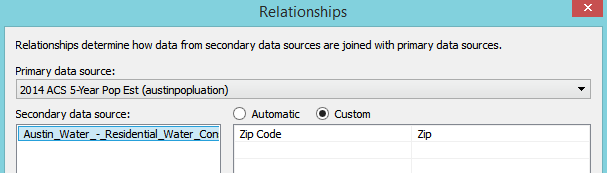
It works!
Filtering across data sets will eliminate many unnecessary clicks/workarounds/hacks that were required to look at data together. As Tableau is so forgiving with its unlimited undo button, we should never be afraid that adding new data to enhance the story will cause HOURS of extra work. Cross data source filters make this more of a reality than ever.
Click To Create New Areas
Speaking of maps…many times to represent the total amount in a geographic region, we relied on custom polygons that may have required outside tools or extra data prep.
NOT ANY MORE!
As I travel around the country people commonly ask WHERE in Louisiana I’m from. Geographically, it’s pretty central but culturally the area is known as Acadiana (or land of the Cajuns). I set out to find an estimated population for everyone living in Acadiana in 2014. In my original map I was able to find the population per Parish, but what if I wanted to see the total population for a group of Parishes?
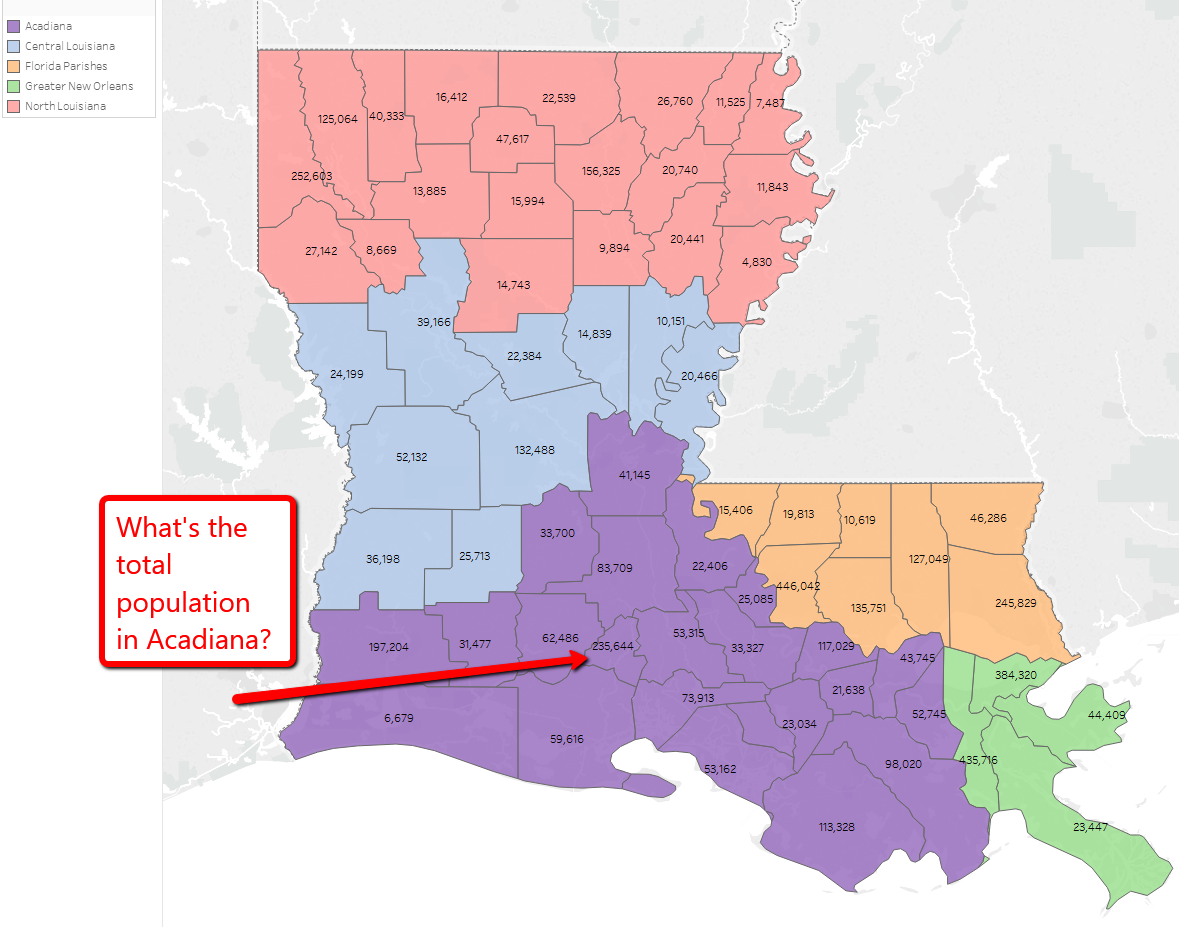
Tableau has given us the ability to create quick, custom areas. Simply make geographic groups in your view, then remove the original geographic field from the Marks card.
TA-DA! We turned 22 parishes into Acadiana ! Now go there and eat some tasty food – seriously!
Cross Database Joins
Bye-Bye Data Blending?
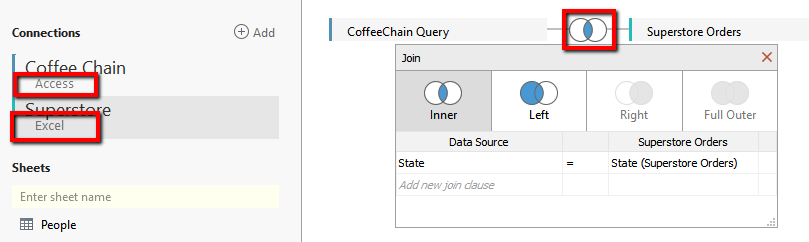
This is the feature I was most excited about at the TC15 conference in Vegas! With the opportunity to join data from different sources, Tableau’s helping us to find answers quicker. Primary v. Secondary sources? Forget about it.
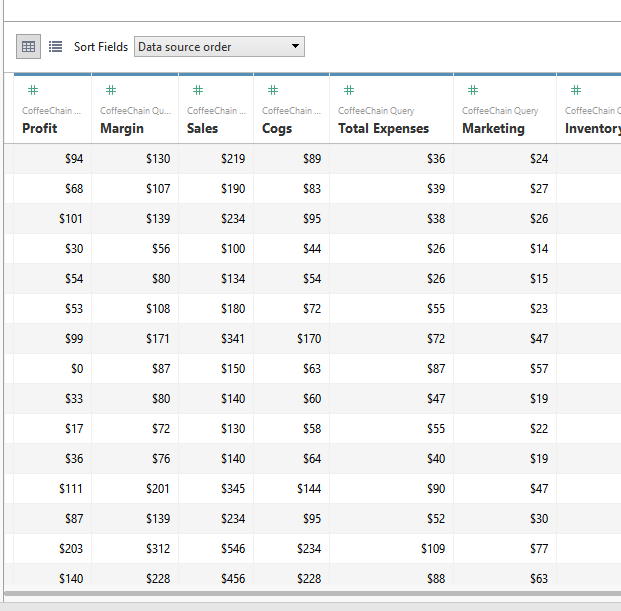
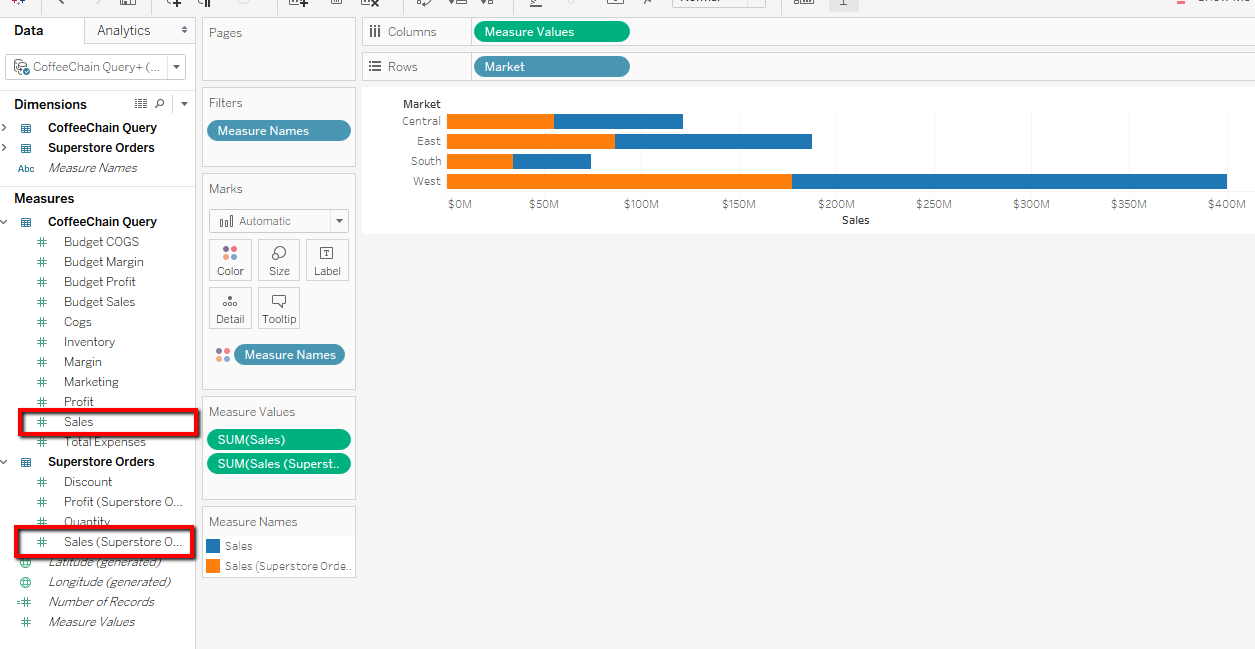
It’s now easy vizzing to combine Sales values from two separate files.
So why the maybe? Well…it doesn’t seem super fast and it doesn’t join sources which are “extract-only”. Yet. But remember, this is just the FIRST beta. We’re excited to see the speed of this feature increase with new releases and it will prove to be a highly valuable addition to the tool.
Final Thoughts
Overall, I’m extremely pleased with the enhancements to Tableau Desktop in Beta10. I’m looking forward to its release and can’t wait to share new features with everyone. Want to get started? Join the Tableau 10 Beta Program and improve the product by giving real feedback on quality and any concerns you may have.