Some of my best memories have been had on the ski slopes! My brother, Matt, and I are unique in loving the kind of terrain most people loathe – moguls. We both love the feeling of hitting our rhythm in and out of densely packed bumps. Although we love to ski moguls, what might be even more important than the terrain is the snow!
I’ve heard that eskimos have many words for snow… well the number of words used to describe snow by skiers probably rivals that of eskimos! “Fluffy,” “champagne,” “hard pack,” “hero snow,” “mashed potatoes,” “mush,” “hot pow” and “wind pack” are just a few of hundreds of descriptors for different snow conditions. But only one word describes the snowfall in Tahoe this past January: EPIC. January saw the largest snowfall in recent memory, so (with a hat tip to James Wright) what you see below is the story of this epic snowfall.
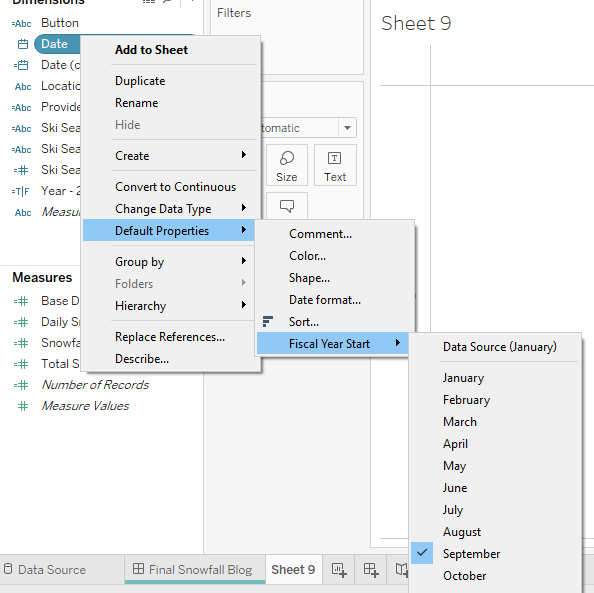
Setting the ‘Fiscal Year Start’ in Tableau
I pulled all the data from http://www.onthesnow.com/. They have a great database of daily snow, seasonal totals and base depth for the last nine years. I chose three of my favorite resorts to compare and built an Excel file with each ski resort’s data.
Onthesnow.com organized their snow data by calendar year, but I wanted to show data organized by ski season (running fall-spring). Instead of writing a calculated field to re-categorize dates, I just used Tableau’s handy fiscal year reassignment option to define the start of the ski season. I picked September, since no year saw snow earlier than September.

After reassigning fiscal year, it was pretty simple to tell the awesome story of Tahoe’s big snow! Enjoy!

