
When talking about data-driven culture deployment and Tableau user adoption, there are many components that can contribute to the overall process and help make it successful. One of these components is educating users. Many of us at InterWorks are certified Tableau trainers, and we are constantly looking into how we can help our students learn new tools faster. Tableau is a very creative tool, so it’s no surprise that its users are also very creative. They have interesting ideas about user adoption and a passion for enabling people in their organizations to make smart decisions in fast, interactive and effective ways.
Recently, I was lucky to have a chance to talk with Paul Conlon, People Analytics Expert at Swiss Re. Paul previously worked at UBS Bank. In this interview, he shares his experience of the HR department’s Tableau rollout, and I recommend checking out the workbook he created for internal trainings.

Above: Paul Conlon of Swiss Re
Q: Paul, tell us about your Tableau journey.
Paul: I was always into data and analytics, but a couple of years ago, I was looking for something different. I’m a very visual person: I like to see data, plus my hobby is photography. When I found Tableau, I was instantly amazed at how fast the process went from installing the software to importing and analysing the data. Not only could I answer my business questions, but I could also tell a story visually and make it interactive for the user. It was very easy to persuade our management to start using the tool within HR at UBS, and I’ve been using it ever since.
Q: How long has your team been using Tableau?
Paul: I know that the usage of Tableau within Swiss Re is much greater, but I will be talking from my own HR perspective. Our team has been using Tableau now for about 16 months, and I joined around 12 months ago. I think we are still in an early stage of adoption, and our aim is to reduce the number of basic reporting requests while introducing people to a more interactive, self-service approach, where they are empowered to do the basic analysis for themselves. With Tableau we have the opportunity to do that, which allows our team to concentrate on more in-depth analysis or move into areas such as predictive analytics.
Q: Can you briefly describe your Tableau ecosystem?
Paul: We have Tableau Desktop, and we have several sites on Tableau Server where we publish our reports. The key dashboards are available through an internal information portal. We primarily use Oracle database or Excel files as a data source.
Q: What is the ratio of people consuming content vs. people creating content?
Paul: Our team is comprised of 11 people across the world. Reports and analysis are created primarily for the HR community while some dashboards are available to a wider audience of business users.
Q: How have you created a journey for user adoption? What actions were taken?
Paul: For our first major Tableau release (Workforce Dashboard), we did a series of activities from group training sessions to blog posts, as well as the creation of a short video to explain the key features and functionality of the dashboard. To help continue adoption, we will now introduce a series of ongoing workshops with Q&A that have a more interactive and personal approach. We will do these in person where possible, although we will have to use a webinar for certain locations.
We will use this approach for all major releases going forward, whereas smaller pieces of analysis are often promoted through email and personal training.
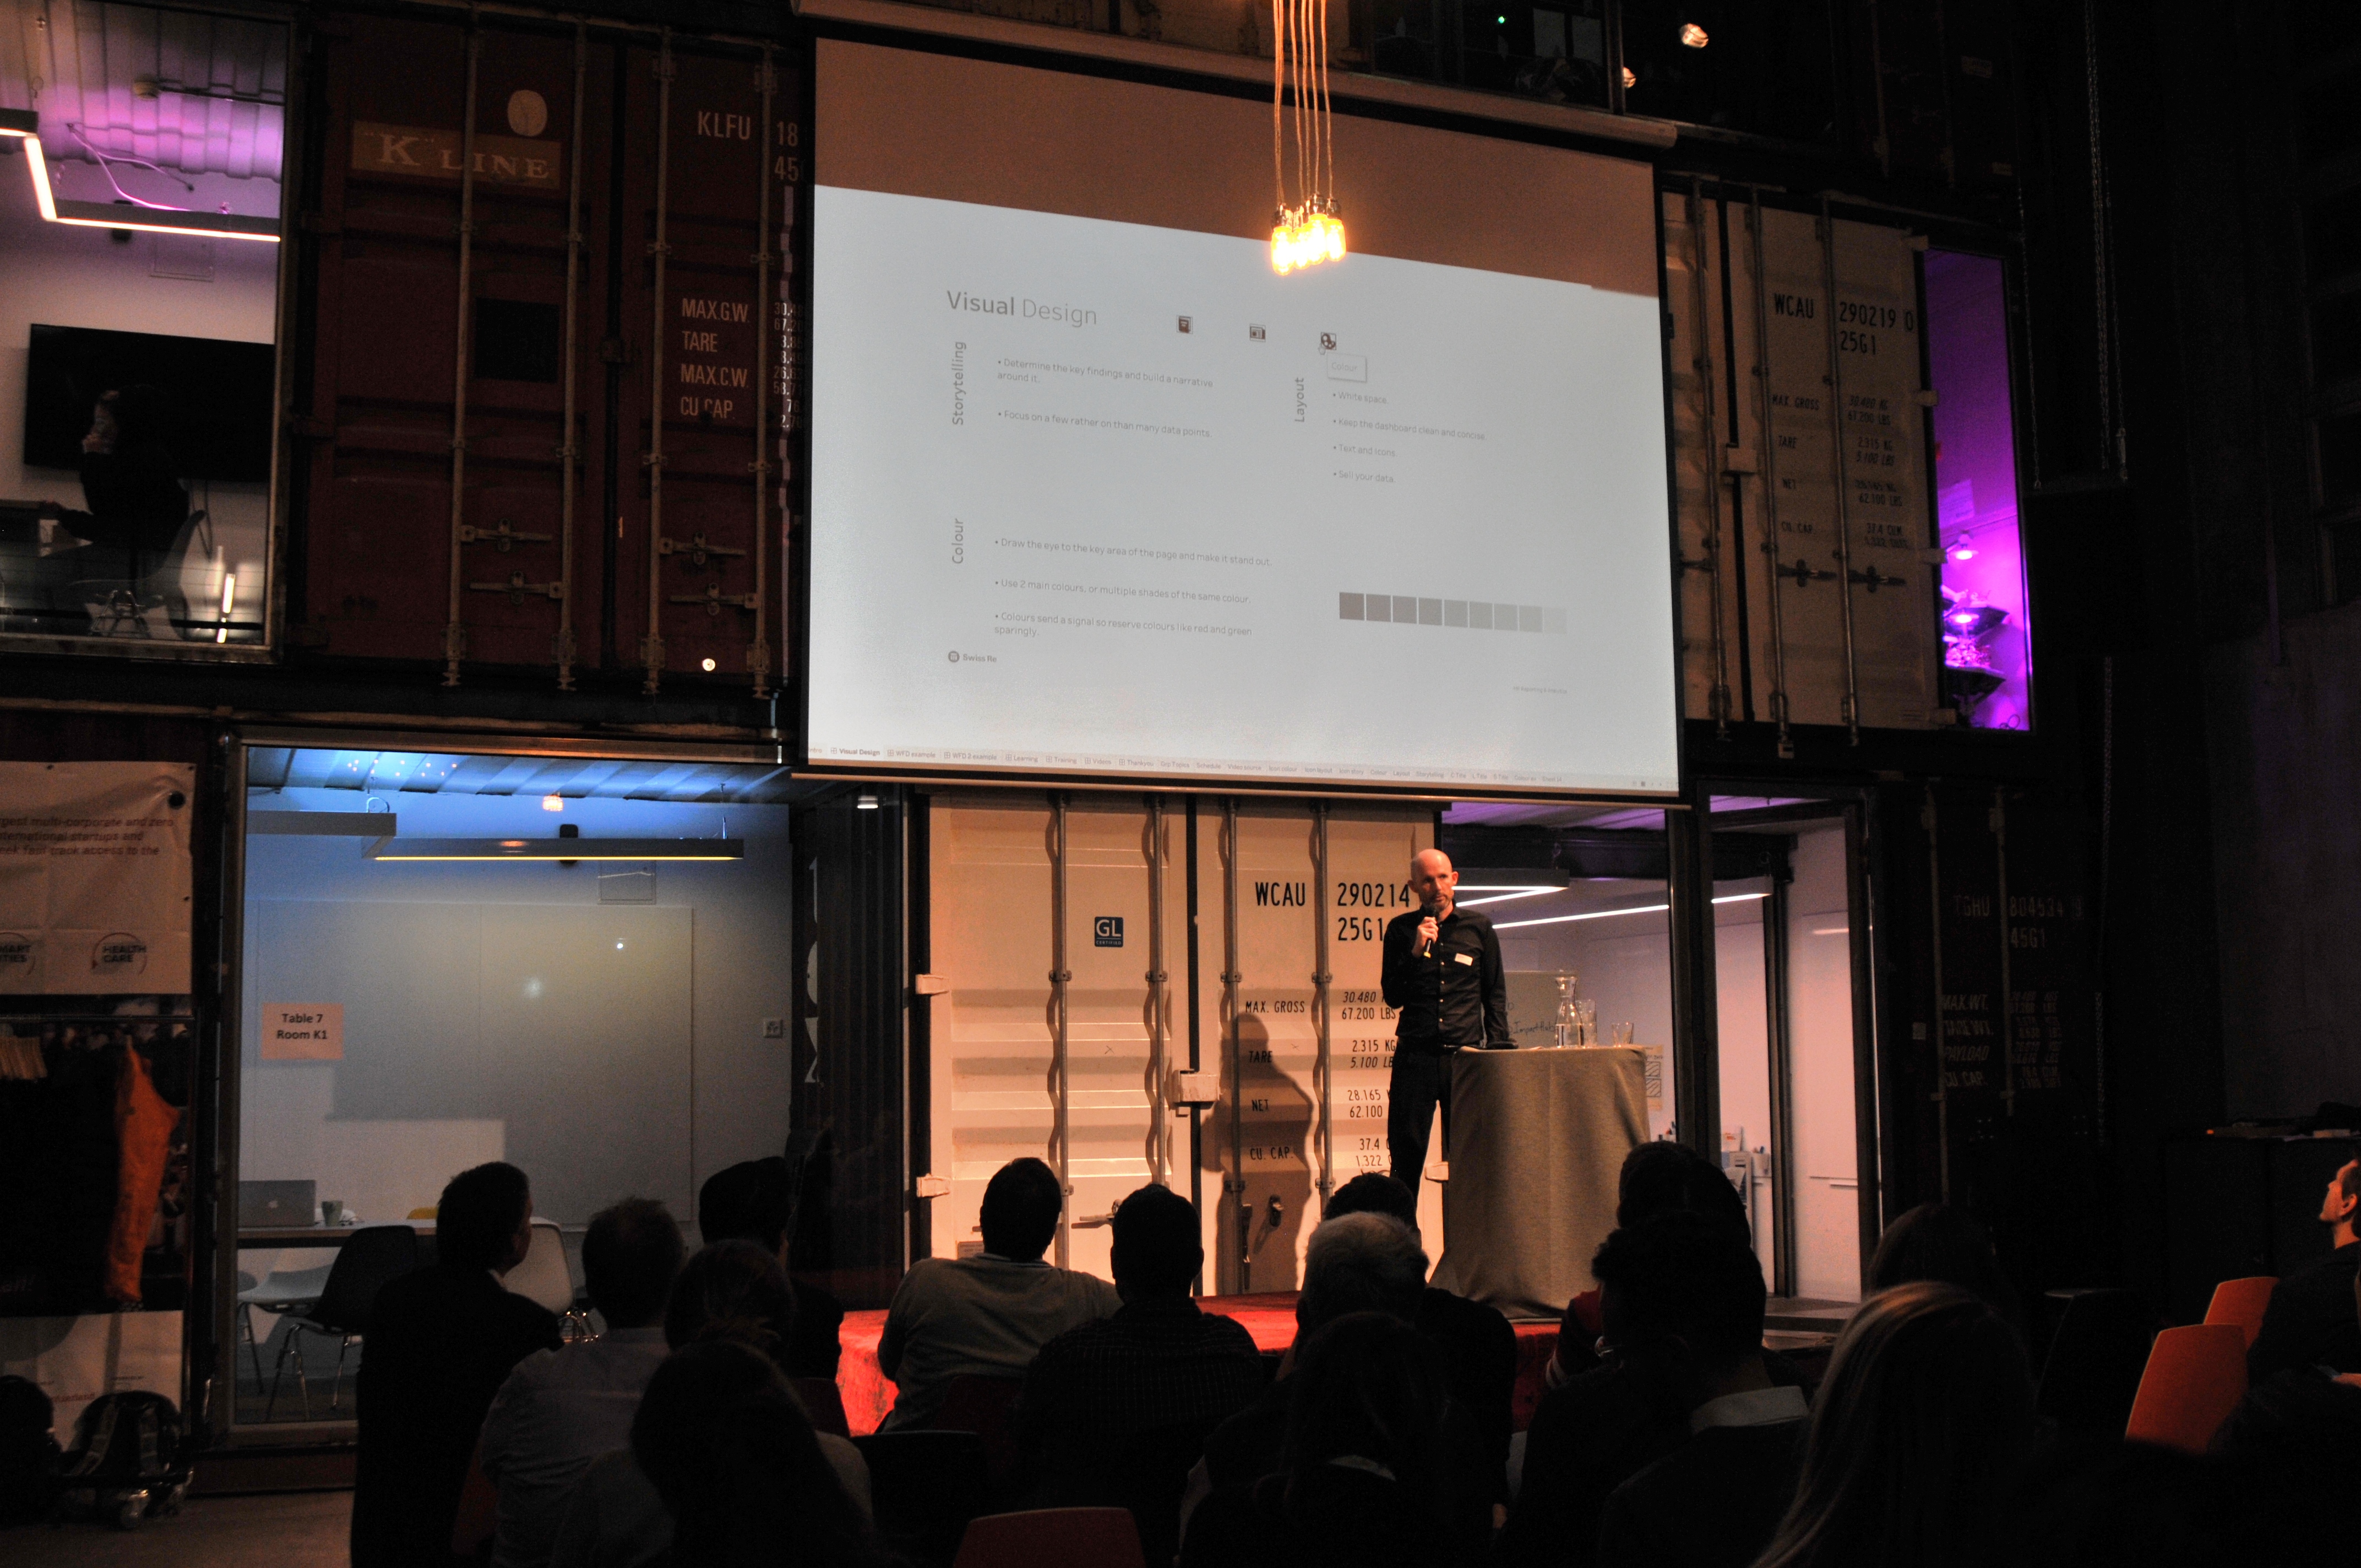
Above: Paul leading a group discussion over Tableau
Q: Can you describe the trainings that you do internally?
Paul: I like learning by doing, which was relatively easy with Tableau’s great videos and the amazing community on the internet, so I’m self-taught. However, I know there are many ways to learn, so I thought about how I could make the learning process more focused. For me, there are two key areas that are important for training: data should be relevant, and it should be interactive for the trainees.
Therefore, I built a dashboard to help facilitate the training sessions and showcase what can be done in Tableau. I set out a timeline of lessons by using a lollipop chart to highlight what would be taught, the tasks that should be done, and I included any additional videos or helpful links. As we covered a lesson, I would demonstrate the topic in the dashboard itself so that users could always come back to it to see how it was built. The workbook then became a history of all the topics we had learnt while including relevant Swiss Re data, which allowed team members to better relate to and understand the data.
Once I had given a lesson, I would allow around an hour for the team to do the relevant tasks and ask any questions. One key lesson I learnt is that people are reluctant to ask questions in a big group, so I would often dial out of the session once I had set the task, allowing team members to privately call or chat me. This resulted in many more questions.
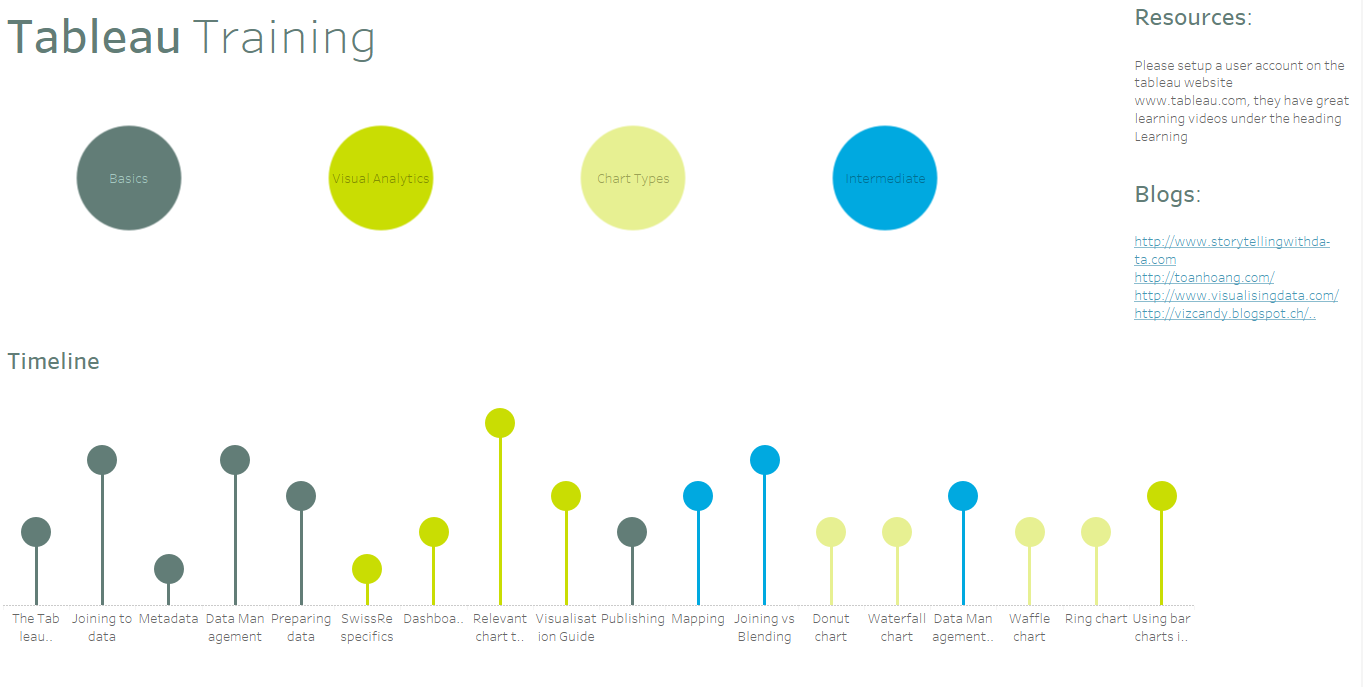
Above: A screenshot from Paul’s training workbook. You can find the template here.
Q: What was your biggest surprise in your Tableau user adoption journey?
Paul: It goes both ways. On the positive side, there are lots of people who enjoy it. It makes their life so much easier, and you can see them get excited about the tool. The negative side is just the opposite: people don’t really want change and are reluctant to take on something new. It just takes time.
Q: What types of skills did you find were important?
Paul: I think to be creative and to be open to change. Think of something in a different way, not just with bar charts or tables. That’s the biggest thing—creativity, I would say.
Want to Know More About Tableau User Adoption?
If you are interested to hear more about the Tableau user adoption journey at Swiss Re, here is the presentation by Paul Conlon from Tableau Conference 2018 in London. Plus, feel free to check out these additional resources:
- PYD52 –Interview with Jim de Clercq, Analytics Production Lead on User Adoption
- Building Tableau Community: Lessons from ABN AMRO
- 10 Ways to Drive End-User Adoption of Tableau – Part 1
- 10 Ways to Drive End-User Adoption of Tableau – Part 2
- Deploying Modern Analytics in a Traditional Environment
- 3 Reasons to Attend Your Local Tableau User Group