
Tableau user adoption is a common topic not only internally at InterWorks but also throughout the community. You can find many interesting blogs, videos, podcasts and discussions about it. User adoption has many aspects, including building Centres of Excellence, building community and scaling, sharing best practices and so on. We started to collect interviews in the form of blogs and podcasts, which we plan to release here in the coming months.
Today, I want to share an interview with Marleen Meier (Quantitative Risk Analyst) and Kristi Blaisdell (Regulatory Reporting Analyst) from ABN AMRO. They will tell their story about building Tableau Community in their organization.

Above: Kristi Blaisdell (left) and Marleen Meier (right).
Q: Let’s start at the beginning. What was your Tableau journey like?
Marleen: It all started two years ago. I was working on a project in which I changed the layout of our risk reports. A prototype had been built in Excel, but we needed a tool that was suitable to handle huge amounts of data, like 16 Mio trades a day. My colleagues from the U.S. told me about Tableau and on the same evening, I downloaded the free trial. With my reporting prototype 2.0 in Tableau, I went back to my boss and convinced him that I would need a licence.
After that, I started using Tableau for data checks as well as for risk analysis – tasks I usually did in Excel or with the help of SQL, querying directly on the database. After that, I went to the Tableau Conference. Within three days, I learned so much and met so many other enthusiasts that ever since I am kind of an ambassador within ABN AMRO Clearing. I successfully built a proof of concept and implemented Tableau, followed by many presentations and hands-on trainings.
Together with Kristi, we created a Centre of Excellence and internal user group meetings, conferences, webinars, certificates, etc. The list is long, but the bottom line is that I just love working with the tool and sharing this positivity with my colleagues.
Kristi: My journey with Tableau started in the U.S. when my team was looking for a tool to assist us in analytics and dashboarding. Tableau was one of the top tools in a laundry list of analytics tools. During our proof of concept, I used Tableau to assist me in turning our Client ETF (Exchange Traded Fund) data into insight, assisting us with regulatory questions and sharing more in-depth information with the regulators. Together with four other colleagues, we created a foundation for a Centre of Excellence, where we both learned from one another and challenged each other.
When I moved to ABN AMRO headquarters in the Netherlands, I was enthusiastic to bring Tableau here as well. After participating in the European POC, we finally got Tableau (yes!). From that point, I was one of the co-founders of the Tableau user group (with Marleen) within ABN AMRO Clearing. I have given trainings and presentations to colleagues and joined all the excitement at the 2018 Tableau Conference in Europe. Tableau has allowed me to bring my job to a new level by providing insight into our data, and getting the privilege of working with the tool has been so much fun (who says that about an analytics tool?).
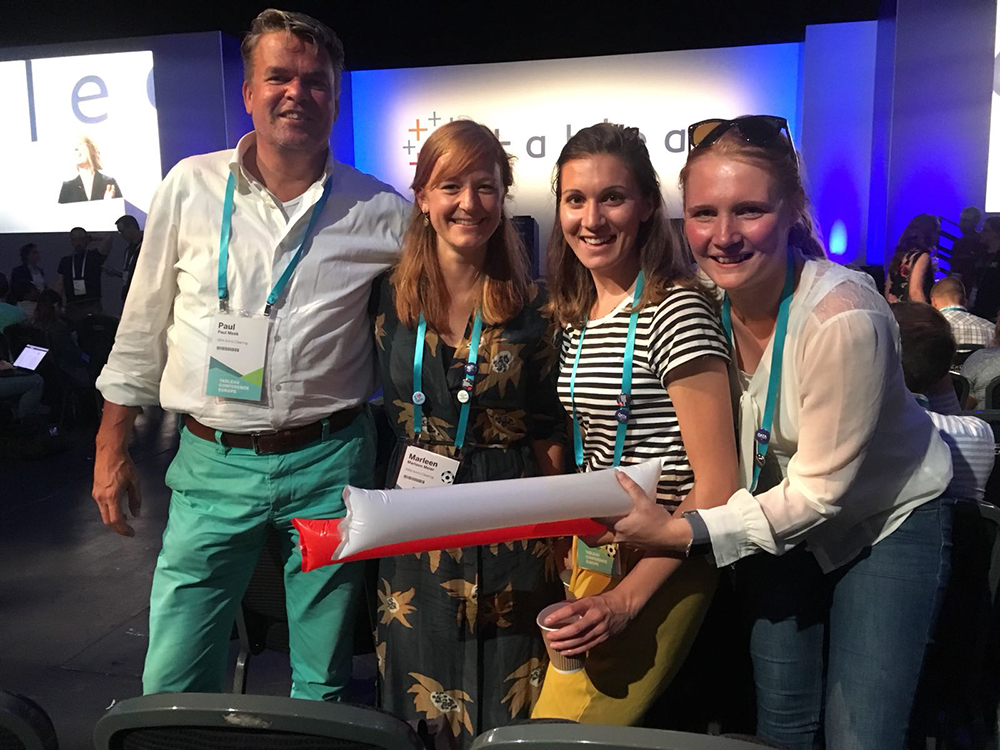
Above: The ABN AMRO team at TC18 Europe in London.
Q: How have you created a journey for Tableau user adoption? What actions have you done?
Kristi: We started by inviting a Tableau expert who gave us a short intro to Tableau. After, we created a POC where, over the course of two weeks, people from each department participated in solving their problems and challenges in Tableau. Ensuring most departments were involved increased the level of awareness around Tableau.
After the POC, Marleen and I organized internal community meetings. The first few sessions were more about Tableau in general (the use of ABN colors, connecting to ABN’s data, etc.). We also asked all parties to watch the online videos from Tableau to gain more insight without having to explain the general items. We also created a wiki for the community to ask questions internally. We posted articles, blogs and other useful items we had found – tips and tricks and simpler items that people were having a hard time with.
We created bi-weekly, two-hour sessions where someone would showcase their work, ask questions and get feedback or advice. Since we were all from different departments, the different dynamics were helpful in ensuring someone else could understand their dashboard.
Q: What was the most challenging part in building community?
Marleen: It is difficult to get people to take the time to learn or use the tool. This is either because they don’t get the time from their managers and are too busy with day-to-day business to handle it or it’s hard for them to change from something known to the unknown – leaving the comfort zone. So, from one to the next meeting, it might be that some participants didn’t open Tableau for a month. Then, of course, we can’t book any progress. But I also think we expected too much. Not everyone shares our excitement, so we have to give it a bit more time, be more patient and never give up.
Q: Which actions have you found were the most successful?
Marleen and Kristi:
- Meetups within the company! While it may be hard to round up everyone and meet, it helps people get committed to the tool. Also, showcasing someone’s work sparks others to re-evaluate the things they are doing and see how Tableau can simplify their work
- A blog that we wrote on the intranet that got a lot of people interested who previously didn’t know much about the tool
- Giving Tableau presentations/workshops to other departments with their own data, like ad hoc dashboard building together with the audience
Q: Do you organize workshops or other events to embrace user adoption?
Marleen and Kristi: Yes, as mentioned before, we have the monthly user group meetings where we discuss the status of Tableau adoption within the Clearing. We show dashboards of participants and share blogs, vlogs, webinar, tips and tricks or similar resources. We also encourage people to meet bi-weekly with groups of two-four people to discuss questions, give and receive feedback on dashboards, etc.
Earlier this year, we invited Andy Kriebel who presented his journey on becoming a Tableau Zen Master. We are soon going to have a three-day workshop called “From Idea to Product.” We are also hosting the Netherlands Tableau User Group in September. The invitation is now available here. Join LinkedIn group or community forum to be notified about future events.
Q: How do you measure the success of the user adoption?
Marleen and Kristi:
- Feedback surveys
- Clicks/views on a dashboard on Tableau Server
- How many licenses are being used
- Number of dashboards created in production
- Feedback from colleagues
Q: Which activities would you recommend to people who are just starting with Tableau?
Marleen: Watch online videos and webinars. I personally think that the videos from the Tableau website and the conferences are especially helpful. But if you are less of a self-starter, I recommend attending online or in-class trainings where you can have your hands on the tool. For example, I took the Visual Analytics course, which is great if you want to create visual best practices and outstanding dashboards. It is also really good if you are planning to get the Tableau Professional Certificate.
Next, questions from other people really helped me learn a lot! The data you work with every day is easy to manipulate, but a great challenge/motivation is to help answer your colleagues’ questions or those from other Tableau users on the online forum. Last but not least, I participated in many Makeover Mondays, which had a similar effect. Unknown data helped me to be more creative, to step out of my “tunnel” vision and explore the tool from different angles.
Kristi: I took the Desktop III – Advanced Calculations during the Tableau Conference in London 2018! I found the course extremely helpful as each time you learn a new “skill,” you are then asked to do a small exercise. This helped me to fully understand what the instructor was telling us to do. The instructors were also great in answering any questions you had or explaining information in different ways. What a great experience it is to be able to have a full-day, “hands-on” training session!
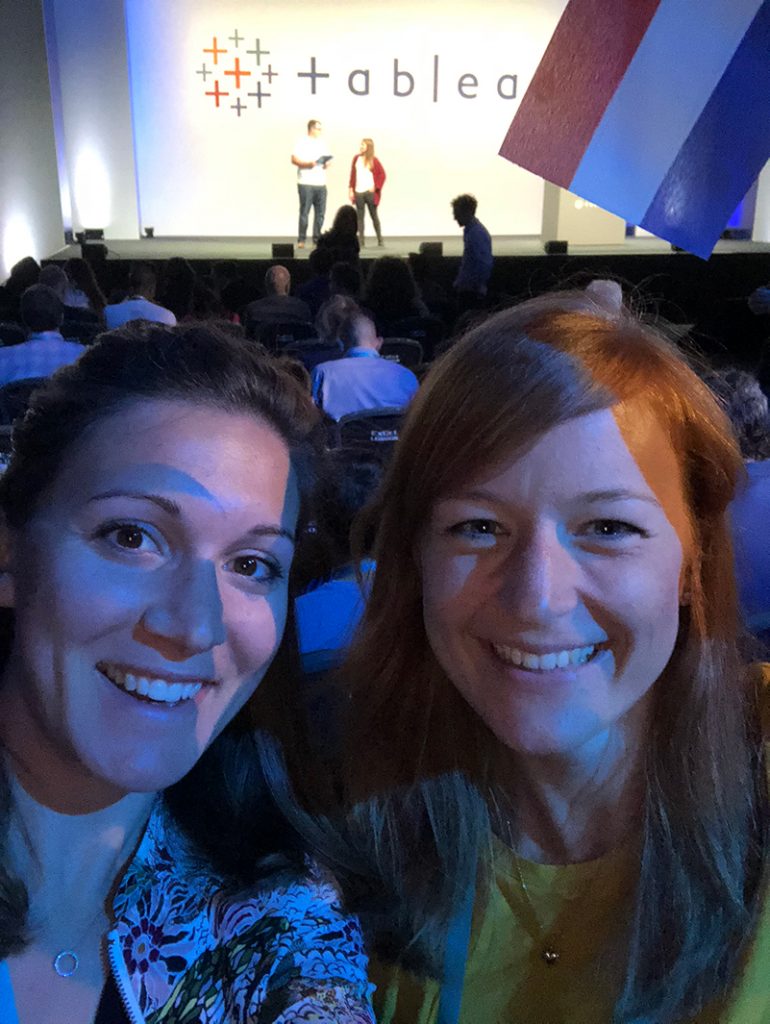
Above: Kristi (left) and Marleen (right) at TC18 Europe in London.
Want to Know More About Tableau User Adoption?
Check out these resources: