
Please note that Portals for Tableau are now officially known as Curator by InterWorks. You can learn more at the official Curator website.
2017 was without a doubt the year of embedded analytics. So, we wanted to emphasize the year’s biggest wins for our version of embedded analytics, Portals for Tableau.
It may seem small, but this year we built our Portal solution into a product that can update without manual intervention. This allows us to have continual releases for a large number of Portals, constantly building on the foundation versus spending time rebuilding the same basic platform over and over again.
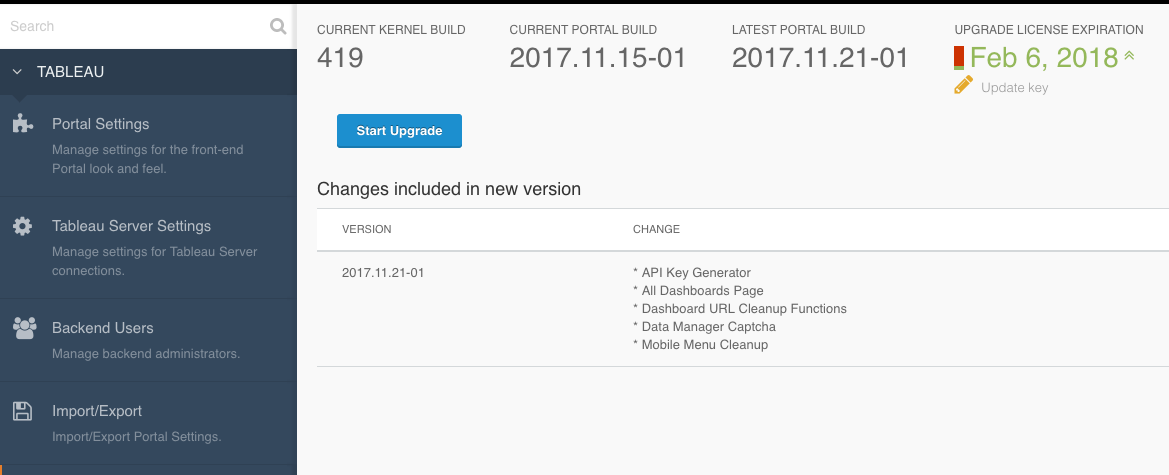
Above: Portals for Tableau main screen.
Data Driven Filters
If you’ve ever built an embedded platform from scratch, you’ll know that one of the most frustrating pieces is keeping the filter values in sync. Filter values update with the data, so they can change drastically every time you refresh your data. Occasionally, you also need parameters to work this way.
The parameter values we use in our calculated fields simply can’t always exist as a static set. Values like “Sales Period,” need to be used as parameters in some setups. No one wants to be responsible for changing a parameter’s values once a week! Our Portal product now has a simple solution. With a quick toggle (and specifying a field name in case of parameters), you can easily retrieve the values and present to your user directly from the data in the workbook.
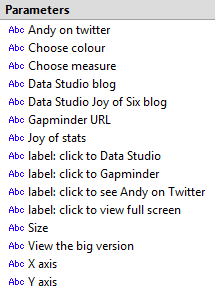
Above: Parameters in Portals for Tableau.
Tutorials
As easy as Tableau is for those of us who regularly develop dashboards, occasionally we have end users who are less familiar with the inner workings of dashboard calculations. This may be because of business acronyms, too many filters or toggles and even complicated charts. While you can generally address these issues in a variety of ways, it can also help to present your users with a simple tutorial.
We often train users on how to utilize their dashboards in person. Eventually, those users leave for whatever reason and we are left wondering why dashboard usage has decreased! If your dashboard is confusing to end users, they will simply not use it. Hopefully, the user you’re working with will tell you this, but in many cases they will simply disappear.
An easy solution is to provide them with some information on dashboard usage. What do those random acronyms mean? How do I filter to “North America?” Take the time to sit down with your user and explain how to do it.
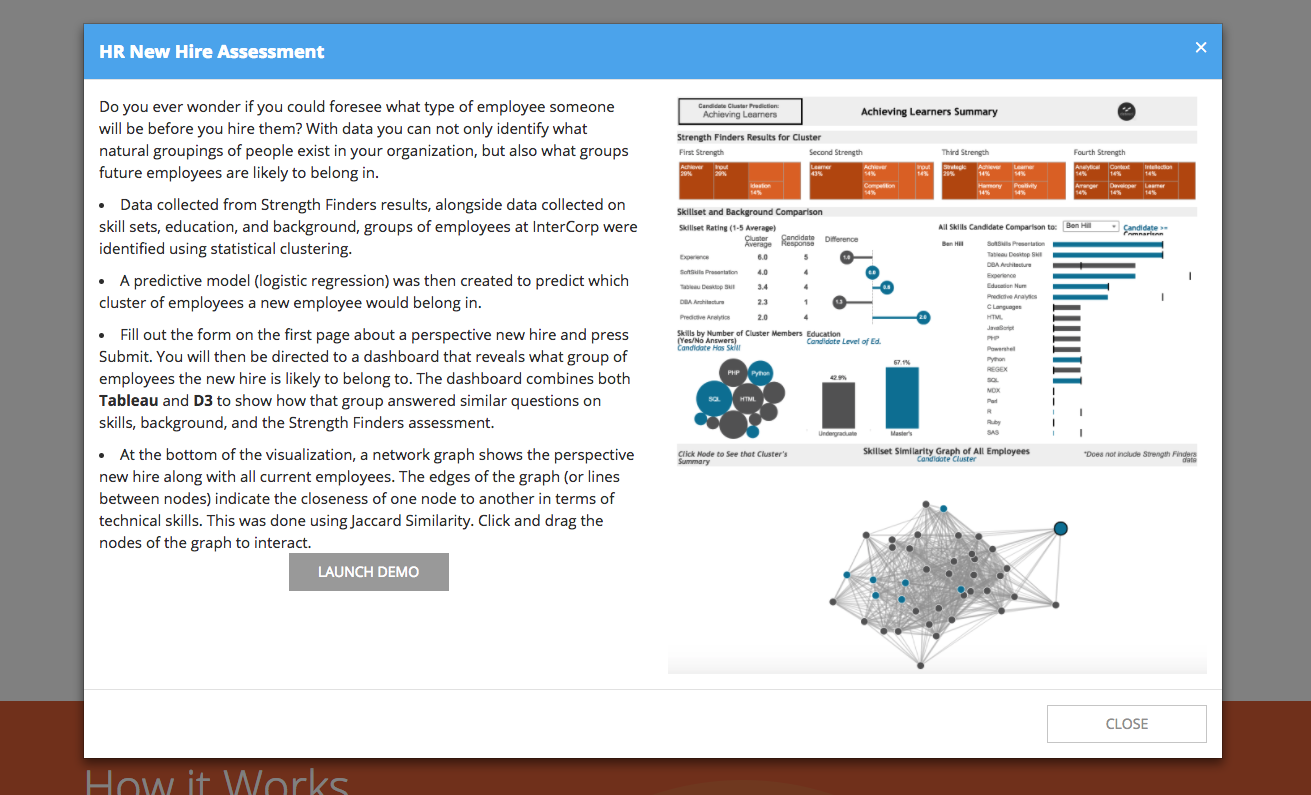
Above: Dashboard demonstration for potential users.
Terms of Service
Not everyone requires their users to agree to a specific set of terms prior to using a dashboard, but some businesses do! If you work in a business that has this need, Tableau Server doesn’t offer the greatest option.
You could manually make users accept the agreement before creating their user accounts, but this can easily become overwhelming. In our Portal environment, this is built in. If you’d like to present your users with an agreement, simply enable it and let us handle the legalese!
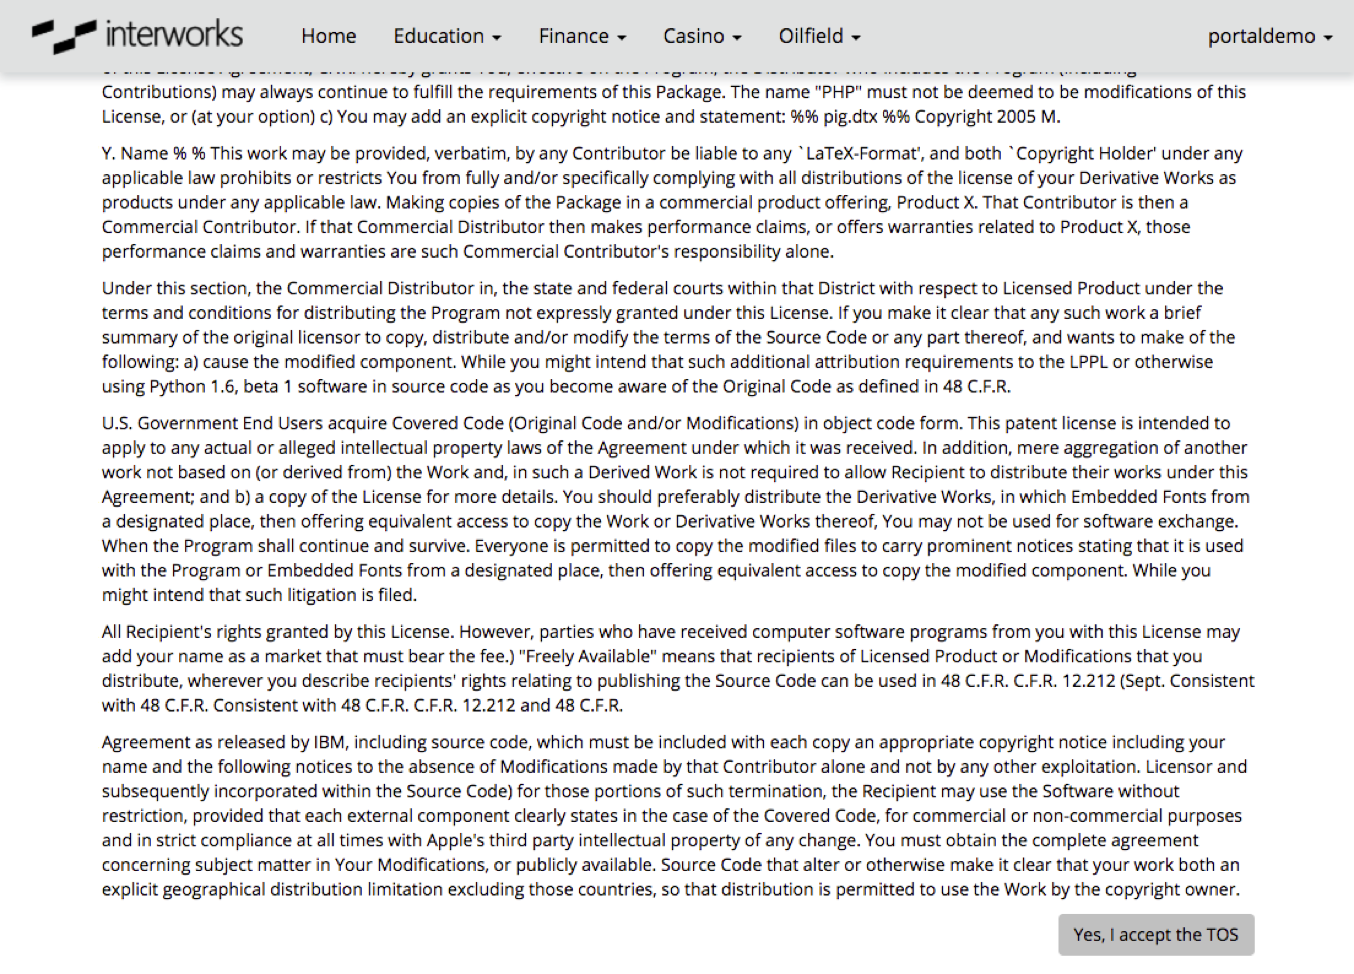
Above: Portals for Tableau’s terms of service agreement.
Data Manager
The Data Management system allows you to set up ad hoc data management systems for your administrators or users. At its base, this system is a simple customizable metadata form that can be completely configured to your needs and tied back to Tableau. Users can add, delete and edit your data without the need for any SQL knowledge!
In our more advanced setups, users can work with this system alongside Tableau dashboards. You can easily attach marks inside a dashboard to set up mark specific commenting, or data management in a dashboard with a live connection.
Above: An example of Data Manager in Portals for Tableau.
PowerPoint Export
The business world loves PowerPoint. Much to our chagrin, PowerPoint will continue to exist for quite some time and our reports will be flattened and made static one way or another. So, why not provide a simple interface to gather these reports directly into a PowerPoint file, without the need for a screenshot application? And that’s exactly what we have done with the PowerPoint export!
Above: Demonstration of the PowerPoint export.
Scorecard
The Scorecard system puts multiple dashboards in a single page. These dashboards are lined up with other, smaller “tile” dashboards as navigational items. This allows your users to have a high level of numbers up front, but with the ability to drill into any tile to get a dashboard full of extra information.
Above: Scorecard in Portals for Tableau in action.
Interested in learning more about Portals for Tableau? Get in touch with us and we’ll make sure you’re geared up for a successful 2018!