
The world of tech is always changing and evolving, and to be successful in the industry, professionals must continue to learn, grow and develop their skills and approaches to the challenges they face. With so many different design elements and data variables in the work of communicating data, the possibilities for visualization are nearly limitless, and the difference between a strong, polished dashboard and one that’s too busy or a bit unfocused can be stark.
Below, some consultants share early dashboards they created, as well as more recent dashboards that convey the growth they’ve undergone in their data journey. We hope their takeaways are helpful to you in your own analytics process.
Mavis Liu
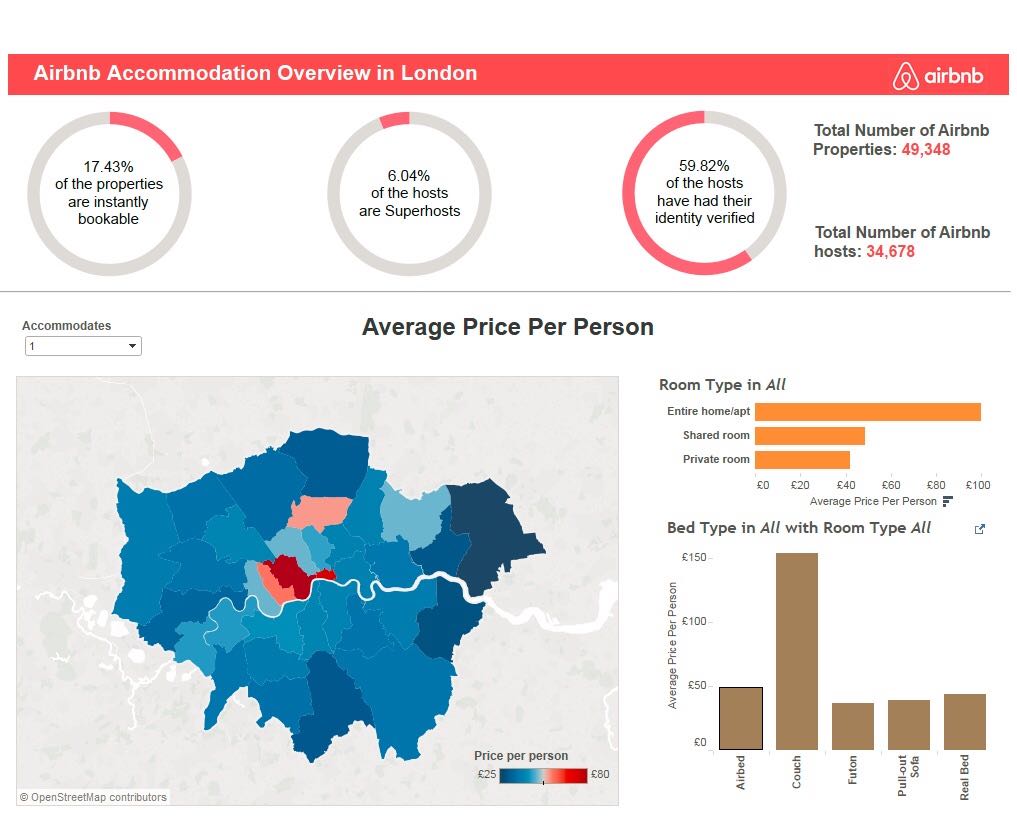
The above AirBnb dashboard is one I presented to InterWorks in the last stage of the interview process. At that point, I was still new to Tableau and blended in a dataset to create polygon shapes. This created a map of the London Boroughs, which I used to look at the average price per person, per night. I then chose a few more areas to analyse, such as room type and bed type. I also created a second dashboard that included filters to give users more control in analysing the data.
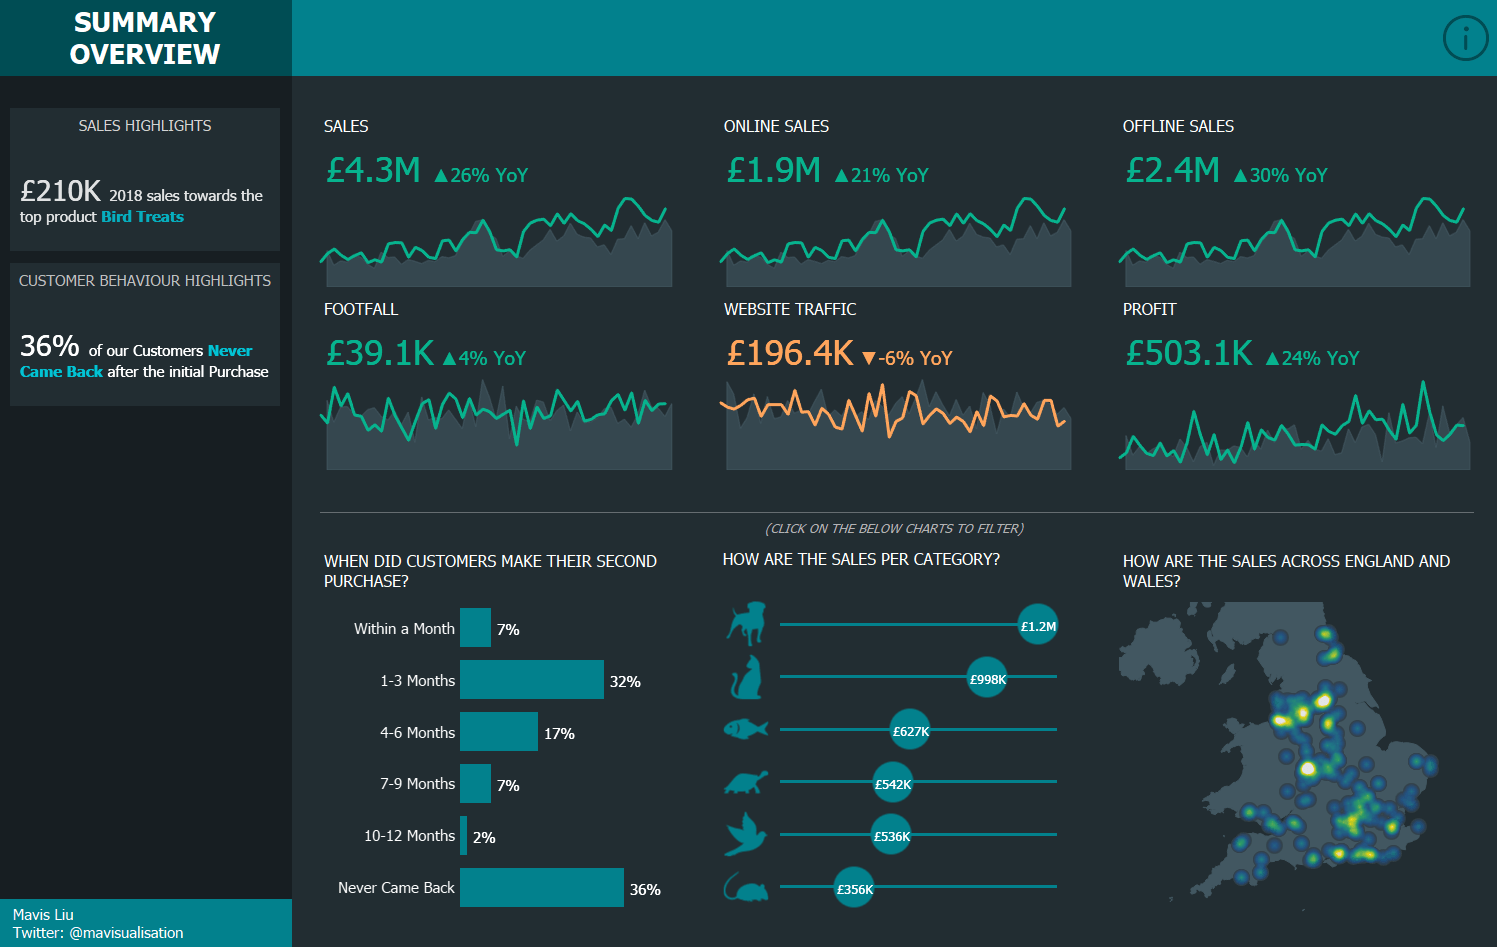
The one above is one of my latest dashboards that I built as a proof of concept for a client (the data is based on Global Superstore but with a few things changed). This was for an exec-level view, and I focused on some key metrics and then some interesting areas, like customer retention.
What I’ve Learned
I have learnt a lot in the past few years of using Tableau, but the key things I learnt have been:
- Using layout containers. In the first set of dashboards, I used floating items for everything because I didn’t really know how to use layout containers. So I think the first dashboard has elements that are misaligned. My latest dashboards use layout containers, which help align everything well.
- Cleaning up the look and feel of dashboards. Some ways to do this are to remove the axis if everything is already labeled. Formatting is key, so removing borders and extra lines really cleans up the overall look. Another good way is to roll up the numbers to millions or thousands and reduce the number of decimal places so that you have less clutter on the screen. I think it’s best to clean up everything you can, including tooltips.
- Focus on what is important to the end user. As this was an exec-level view, I designed this to be pretty high level with additional components that could be of interest to leadership.
- Utilise useful and new features of Tableau. In my latest dashboard, I used Viz in Tooltip and a density map as ways to give the users more information and a different way of displaying data.
- Learning from others. The above KPI design for year-over-year is what I learned from Adam E. McCann. I always look for inspiration on Tableau Public and the Makeover Monday challenges. On top of this, I share works in progress with my colleagues, and I know they’ll throw constructive feedback over to me.
In general, I have learnt so much, and now one of my focus areas is to make dashboards that are appealing to end users! This will promote the use of Tableau reports and get the users to be more engaged.
Dave Sirey
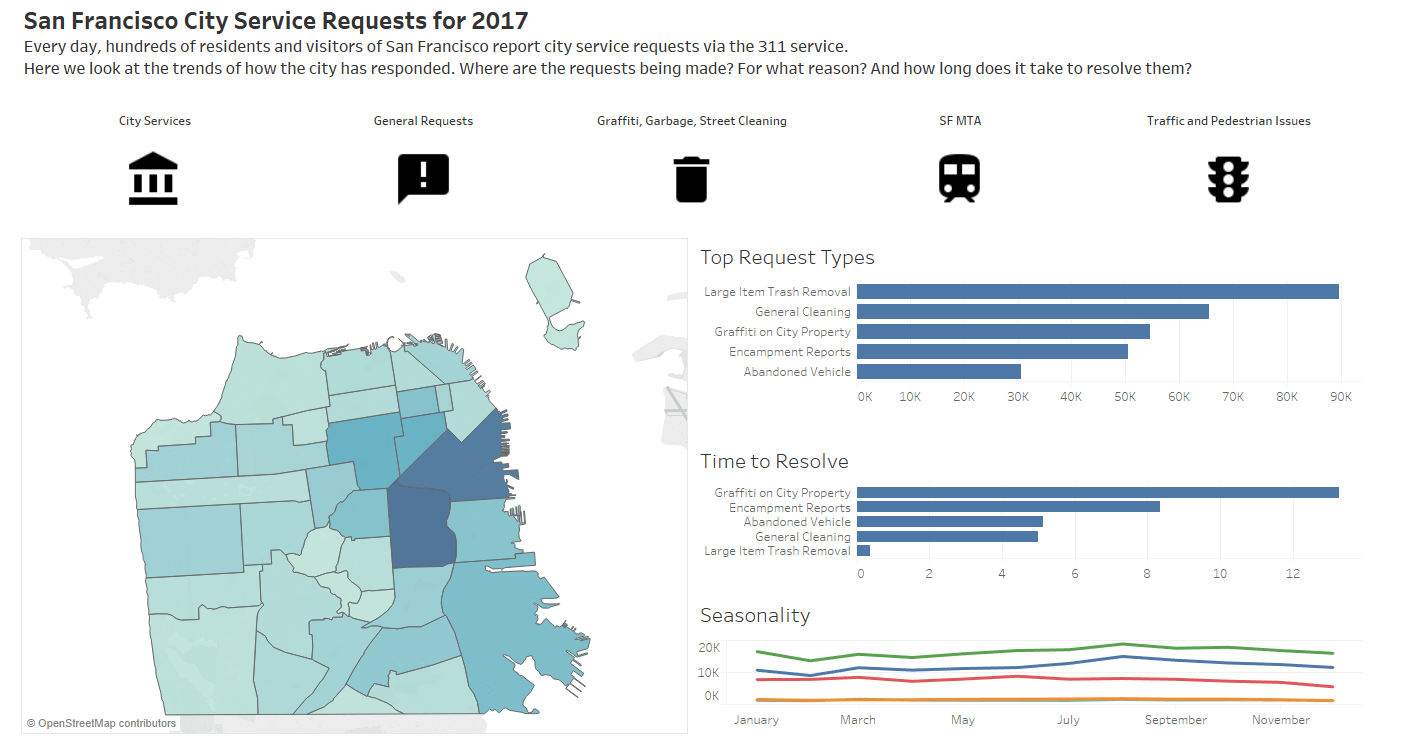
The above dashboard looked at city service requests in San Francisco and was completed during my onboarding term at InterWorks. After researching several visualizations, I found a few characteristics I liked and incorporated them (such as using icons as filters). However, in this stage of my work, I was not thinking strategically about the story I was trying to tell or how my visualization choices supported that effort.
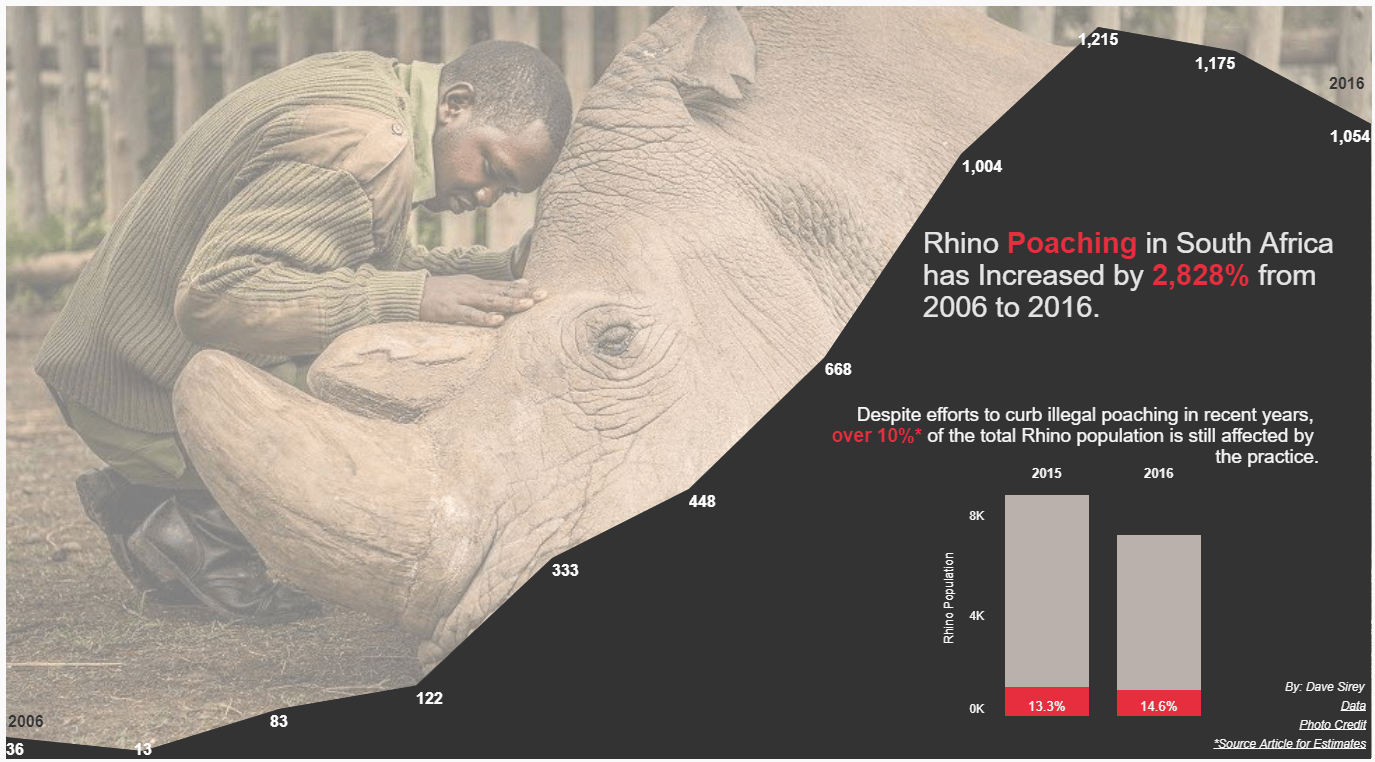
This second dashboard was created during a Makeover Monday challenge. The dataset was very simple, which also created a challenge: “How to make a robust visualization out of a small, two-field dataset.” Given the topic of rhino poaching, I tried to create a dashboard that gave viewers a sense of the seriousness of the problem, along with presenting the data.
What I’ve Learned
Since my first dashboard, I have learned about the power of simplicity and efficiency. One of the hardest parts of building dashboards is limiting the number of visualizations per dashboard. Our organizations have a wealth of data to process, but our brains can only process so much at a given time. I try to keep things as simple and efficient as possible. Aside from limiting the number of visuals on a dashboard, this also means stripping away unnecessary ink such as gridlines, axis labels, borders, etc.
I’m also reminded of a client who outlined her requirements of a dashboard to include “[…] and it should be pretty! I have to stare at it all day!” Since getting that feedback, I always try to think of ways to incorporate the theme of the dashboard in its design.
Kendra Allenspach
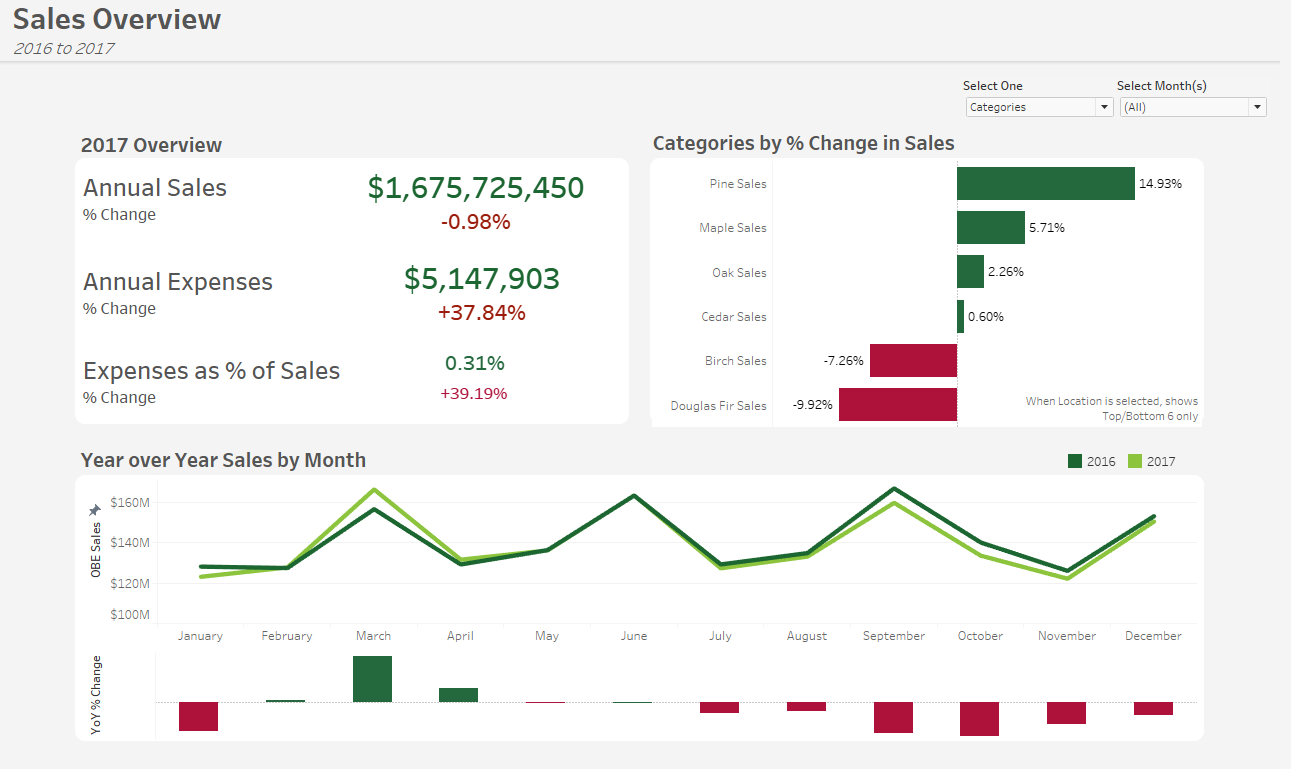
The above viz is really about quick-glance analytics. It was designed as a proof of concept for a client looking to analyze their sales and expenses across categories and time. The goal was to give users a quick glance at key metrics, as well as some flexibility to evaluate different dimensions over time.
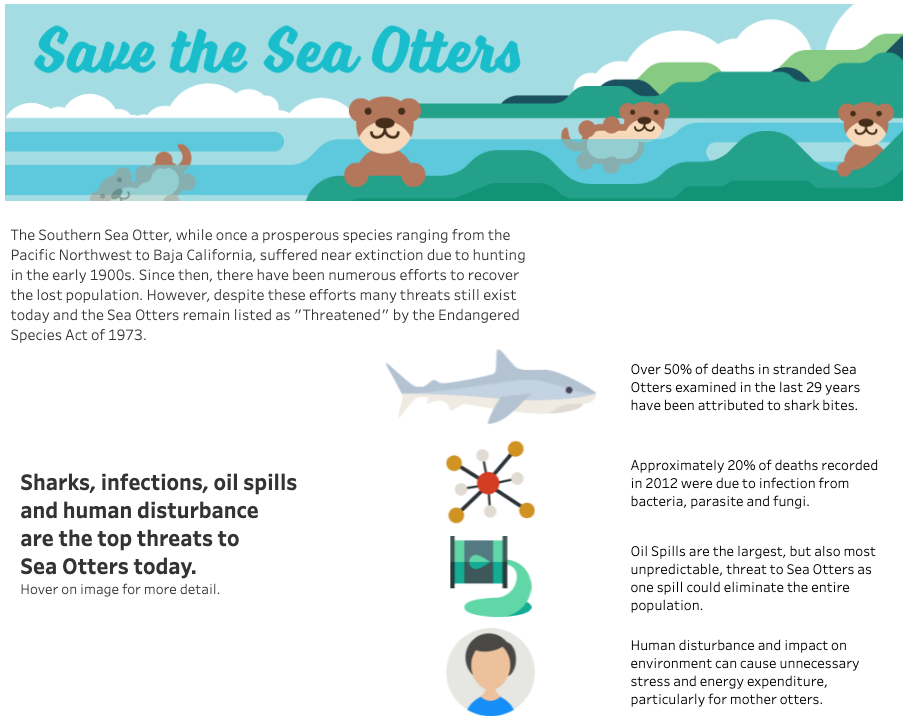
The goal of this second dashboard was to tell the user a story about sea otter conservation in California using data gathered over the years. The viz walks users through the history of sea otter conservation and guides them to understand current conservation efforts in place to save the species.
What I’ve Learned
When I first started with Tableau, I wanted to provide total flexibility and interactivity to the user to drill down into many metrics at once. But what I learned was that this methodology didn’t always lead to consumable insights for making informed business decisions. Instead, the goal of visual analytics is to take the user through a data story. With some thoughtful planning and testing with stakeholders, I now make sure to understand the questions being asked and the insights users are looking to gain from analyzing their data. By telling a story with the data, and taking the user through a guided framework, you’re sure to have a more engaged user and more insightful analysis.
Doing Dashboards Better
There are countless ways to create a dashboard and communicate insights effectively, but the biggest takeaway from these consultants’ work over the last several years can be boiled down to one principle: consider the end user first and foremost. Their specific needs must supersede personal preferences or the excitement of new features. Know your audience, the questions they really need answered, and create a beautiful visualization that tells their story clearly, accurately and intuitively.
Are you looking for support in crafting your own data narrative? We’d love to help. Reach out to our team, and let’s start the conversation.