
This blog post is Human-Centered Content: Written by humans for humans.
I recently heard someone say:
Excel is where failed migrations go.
I had to chuckle a bit, but of course, there is truth in it. Platform migrations that don’t work well lead to shadow analytics. Which is especially hurtful when it’s the data tool that was migrated.
In my professional life, I’ve seen a bunch of tool migrations, be it to Tableau, to Power BI, to Sigma, but also to Snowflake, to Databricks and others. If there is one common factor among all of them, it’s that there is always some surprise that was not factored in before. And often, things get way more expensive than initially planned or than necessary.
I cannot promise to avoid surprises, but I can help with the planning. That’s what this first article is about: Shine a light on the many factors we should consider when making a migration decision. Naturally, that includes costs, and the upcoming third article of this mini-series is dedicated to exactly that. You won’t see numbers there, I cannot take that part away from you. Pricing calculators usually have a half life of three months. But you will see all the thought buckets you need to consider.
The fourth part of this series will then go into the unknown unknowns. Seven layers of them, to be precise. For me, those are the most interesting ones as they are often glossed over and vendors usually shy away from mentioning them at all. (For good reason, I might add.) That includes: SQL flavours, misleading tool demos, governance and security issues, the human layer, surviving problems, validation phases, compliance topics, triage, and many more. After each of the seven unknowns, you will find a checklist with questions you need to ask.
So, let’s get into it. We start easy: what people usually consider, when they are facing a migration decision. That can be a data platform, an analytics tool, a governance solution, or just moving away from spreadsheets.
Reading on we’ll discuss in this article:
- The Four Checks that Always Happen
- Money
- Feature Parity
- Attachment
- Bias
- Fuel
- Ecosystem Gravity
- The Shortlist
- A Note on Excel & Spreadsheets (for Analytics Migrations)
- Checklist
The Four Checks that Always Happen
Check #1: Money
Migrations are either driven by the intent to grow revenue (faster, better decisions, stable operational flows, employee motivation) or to save costs. Naturally, every migration is checked on what will it actually cost in the future.
The hard truth right upfront: Getting the actual costs is tricky, and vendors usually don’t make it simple. The main issue we see is decision makers or decision preppers comparing wrong numbers. Example: Current costs, based on a super heavy discount from two years ago, compared with the list prices of a potential replacement tool. Or the other way round.
We talk about all the cost drivers in Part 3.
Check #2: Feature Parity
What can the new tool or platform do that our current one cannot, and that we have never thought to do? And what is it incapable of? If the migration is not (just) about cost reduction, then features and capabilities are the main driver for those, who use that tool on a daily basis. This is mostly pushed by engineers, analysts, tool admins and other personas.
The good news: This field is easy to research. The internet is full of comparison tables, feature lists and recommendations. All that is usually pretty comprehensive and is updated regularly. AI certainly helps, also with screening those lists and comparing ourselves.
Most of those lists or tables lack one thing, though: Paradigm comparisons. That one is a bit abstract but basically means: If we see the item “custom calculations” in both tool’s feature lists, it might still mean very different things. Calculated fields in Tableau behave very different from DAX calculations in Power BI, or the calculated column approach in Sigma.
Same idea one layer down: Redshift’s materialized views and Databricks’ Delta Live Tables both promise “automated refresh,” but the failure modes and cost behavior are not interchangeable.
We dive a bit deeper into some of that in Part 4.
Check #3: Attachment (Emotional, Cultural)
It’s rarely named, always present and usually the reason the research started. Quite often also the reason why the research ends before it should. Preferring the tool we know or being excited about the one we don’t have yet is not a character flaw. The attachment belongs in the decision we make, if we want it to or not.
There are two sides to this:
Bias
Years of skill-building make the current tool feel more capable than it is. We have built our own comfort zone. Our organization has developed workarounds for the weaknesses it has, so those weaknesses have become invisible. Instead, we see all the weaknesses of the new tool and nothing else. Weaknesses all around.
Of course that works the other way round, too, with something I call novelty attachment: The new tool gets judged by a demo and our roadmap, the old one by its worst Monday. Side note: Vendor demos never contain your data quality.
Either way, to a certain extend that inertia is driving decisions.
If we want to surface that bias, these two options work quite well:
- The choose-again test: If you had neither tool today and evaluated both from scratch, would you pick the one you already have? If yes, do a double check on if you need to migrate. If no, how much of that is based on shiny demos?
- The symmetry test: List what irritates you about the current tool. For each item find the equivalent irritation in the target tool. If you cannot name the new tool’s version of the problem, you might need to do more research.
Fuel
Attachment is a resource. Migration success is mostly an adoption problem. Enthusiasm converts into adoption: Champions, evangelists, power users – they persist through the productivity dip of any migration.
That means the best tool on paper can lose to a slightly weaker tool with committed backers. Attachment to the current tool is real information, too: It represents tacit knowledge and a working community.
If we make a decision that treats all of this as noise, we will measures our engine and ignore our fuel tank. Without fuel me might as well walk, which in my train of thoughts is the pendant to using a spreadsheet.
Three things to be aware of:
- Emotions are a factor, not the decider. Finish the factual evaluation first, then let attachment weigh in. Any emotion is a legitimate factor that needs to be part of the decision. The emotion must not be the decision, though.
- Check whose emotion we are talking about. I’ve seen heads of BI being fan of a new tool, while the base of data engineers only shook their heads. And I’ve seen analysts promoting a tool, just because they knew it from a previous job, while everyone else was quite happy with what they had. Attachment is only fuel, if the people hold it, who actually adopt the tool later. (We go deeper into this in Part 3.5.)
- The tired tie. That phrase stands for a pattern I’ve seen: A tool evaluation can be a daunting project. And we need to put in quite some effort to cross the T’s, dot the I’s, and paint a picture that makes sense and that convinces others and us. At some point, it can get overwhelming (a lot of complexity or we get afraid of what we might not have thought of yet) and a research fatigue emerges. Then, emotional attachment becomes a tempting decision helper. The facts don’t clearly favour either option, “we have enough” is uttered and the emotions take over.
The last one we can get out of, if we check the checklists. Ideally, we have an answer to every checklist question, or we have defined a sensible threshold for answered evaluation questions. Until that threshold is met, emotional attachment arguments are prohibited.
Check #4 (the Outlier): Ecosystem Gravity
This check lives a bit outside of the active decision making, which is the reason why I call it an outlier.
It sits underneath the other ones and unlike them, nobody actually checks it. It arrives pre-decided. It shows up as a:
- “We are a Microsoft shop” (defaulting to Azure, Fabric, Power BI)
- “We work in the Google framework” (defaulting to BigQuery, Looker, Data Studio)
- “We have an AWS infrastructure” (defaulting to Redshift, maybe Athena)
Ecosystem gravity is legitimate. Integration, contracts, vendor management, they all have real value. But it deserves to be weighed, not just obeyed. And it has two habits worth knowing:
It disguises itself as a cost saver. The most prominent example would be Power BI that is part of the Microsoft Suite. The actual costs accrue, when it comes to extract sizes and scheduling, and of course to credit costs, if Power BI is pointed at Azure. It can still be less expensive than another solution, but it depends on our setup.
It shrinks the shortlist of tools before the evaluation even begins.
The probably biggest misconception around ecosystems is: “I cannot use different tools like Snowflake when I’m on Azure or in the MS universe.” You can. Snowflake or Databricks on Azure works perfectly fine.
The Shortlist
A major mistake that happens with tool evaluations is a shortlist of two contenders. This is especially true for migrations driven by cost saving: We hear about a tool being less expensive and then evaluate that. In the end, there is a decision to either keep tool A, that we already have, or move to the evaluated tool B.
The problem: Tools C and D are never considered, although one of them might be a better fit:
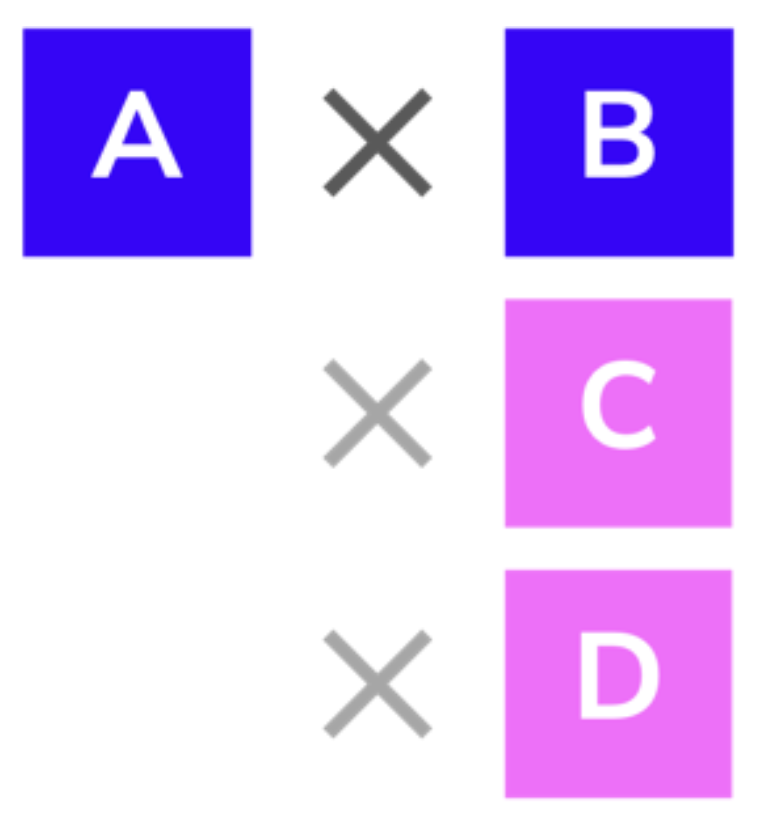
The remedy is cheap. We do two things:
- We have one deliberate widening round before evaluating. This takes 10 minutes with a good enough AI model nowadays, or 30 minutes with manual research. Pull a current market overview (for example Gartner’s Magic Quadrant for BI or Data), add one or two contenders that sound like a possible fit and give every tool their due time for consideration.
- We ask around. A tool or platform’s reputation is immensely important. Not just in terms of quality and productivity, but also because the community is wider and more proficient. Meaning that we can find content, ask for advice and find best practice and worst practice examples out there. Who do we ask? Proficient users, who know the specific tool already, or we seek help from outside (advice, consulting).
With every migration we have some unavoidable costs. So, discovering a better tool post-migration is not ideal.
A Note on Excel and Spreadsheets (for Analytics Migrations)
The most common starting point for migration ideas isn’t tool X, Y or Z. It’s Excel. By any honest definition, spreadsheets are the most used BI tool in the world. My colleagues and I don’t really like calling it a BI tool, but for all intents and purposes, business intelligence is still derived from Excel, and that – per definition – makes it a BI tool. I will add that this holds truer for the European market than others, but still, spreadsheets are everywhere.
There are reasons for that: The generation discovering Excel in the 90’s has been in their professional life for decades now. They have decades of experience to show and are proud of the skills they have accumulated. Rightly so.
The main reason though is that spreadsheets have a very simple concept. It’s datapoints in cells, across columns and rows. There’s not much more to it. All other BI tools are table based, not cell based, and that alone makes for a major mind shift when migrating away from spreadsheets.
So, three points of consideration for you!
- The spreadsheet expert who becomes the BI platform’s power user is the single best predictor of a successful tool introduction/migration. If it works for them, it will work for everybody else. (A bold claim, I know.)
- Excel/Google Spreadsheets looks free. If the argument for Power BI is that it is cheap within the Microsoft universe, then for Excel it is the same argument but multiplied. (Analogue with Looker and Spreadsheets in the Google universe.) The real cost with Excel or spreadsheets is not the tool costs, though. It’s version chaos, single-person dependencies, silent formula errors, no lineage, no governed access control. In other words: All the precursors for “successful” shadow analytics. These are all costs that never show on any invoice.
- Excel/spreadsheets never fully leaves, so we should plan its role instead of its decommission or funeral. I’ve heard people (including myself) tell customers to abolish Excel so often, that looking back I’m doubting my own sanity then. Spreadsheets are here to stay. The goal is to incorporate them into the workflows and not let them dominate the workflows. They can add substantial value to an analytics suite. We need to define the boundaries, if we don’t, shadow analytics will define them for us.
Checklist
The questions to answer before anyone shouts “Tool Evaluation!”
Pro tip: Write the answers down. Don’t do it alone. Treat the checklist as preparation document.
- What problem should the migration solve, and is the tool actually the root cause?
- Who chose the shortlist, on what grounds and what structurally different option was never in the room?
- How much of our direction is ecosystem gravity, and have we priced that assumption instead of obeying it?
- Does our preference survive the choose-again test and the symmetry test? And if we’re calling the facts “balanced,” did we finish the evaluation or abandon it?
- Whose attachment are we counting on for adoption, and whose are we up against?
- If we do nothing for 24 months, what happens? What does not happen? And how expensive is that?

