
This blog post is Human-Centered Content: Written by humans for humans.
In a previous blog post following this series about AI, I talked about Ask Sigma, a new AI powered tool that aims to turning dashboards into smart assistants that behave like real data analysts. However, these features come with real costs. Beyond just dollars, companies need to consider token consumption, the sources being queried, the users generating requests and the databases most frequently accessed. Understanding these factors is crucial for managing budgets, optimizing usage and ensuring transparency across your organization. In this post, we’ll explain how to set up a dashboard that allows us to track Ask Sigma’s usage and expenditure metrics.
Keep in Mind Accountability
A few words here must be told about the security, logs and audits. By default, the log entries about Ask Sigma usage are not collected in any type of record unless it is so determined by the company. This is something to remember when you decide to enable Ask Sigma in your organization. Thus, as soon as you enable Ask Sigma, if you care about expenditure, do not forget to install the usage dashboard as well!
Now, the data collected is very explicit and includes names, full text questions and far more for information. For this reason, it’s recommended to maintain a dedicated schema solely for this purpose and grant access only to system administrators or managers who require that information for their decision-making.
Install the Backbone Database
There are a few technical requirements to check before starting. In simple terms, whoever wants to install this feature must have an administrative account both in Sigma so as (or at least) write access to its data warehouse. We assume that your Sigma environment is already functional, it is connected to either Snowflake, Databricks or BigQuery and it has AI enabled (Check my post about how to make your Sigma instance AI ready).
The steps are actually very simple. We will create the respective database and schema and connect Sigma to that source. Then, Sigma will run the scripts to create the views to make the dashboard functional.
Following there is the code for Snowflake but if your organization uses Databricks or BigQuery I am sure you will know how to do the same there. Either way a link to the code for those platforms is available here.
- Create a dedicated database and schema to store Ask Sigma logs. I would suggest keeping all Sigma-related data in a single database but separate the schemas according to their purpose:
CREATE DATABASE IF NOT EXISTS My_Database_Name;

CREATE SCHEMA IF NOT EXISTS My_Database_Name.My_Ask_Schema;
- Grant access to the user that Sigma uses to connect to the data warehouse:
GRANT USAGE ON DATABASE My_Database_Name TO ROLE Sigma_Data_Reader;

GRANT USAGE ON SCHEMA My_Database_Name.My_Ask_Schema TO ROLE Sigma_Data_Reader;

GRANT CREATE TABLE, CREATE VIEW ON SCHEMA My_Database_Name.My_Ask_Schema TO ROLE Sigma_Data_Reader;
Enable the Ask Sigma Usage Dashboard
The next steps are performed in the Sigma administration settings panel. Under AI Settings, there is a form to enable the Ask Sigma usage dashboard (see screenshot below). If you get a SQL-related error, that means your database or schema does not have the write access enabled to allow Sigma to run the script.
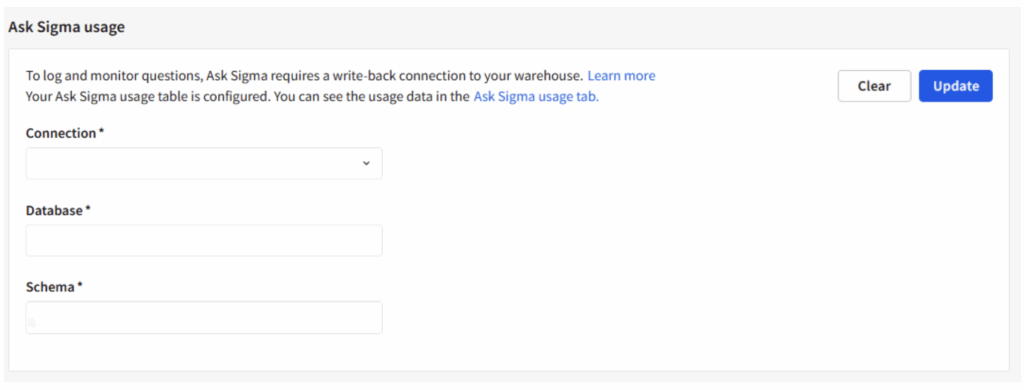
Above: The form to set up the connection to the database that will store the usage logs. Once you click “Update,” Sigma will run the appropriate script to create the necessary views.
Then, in the end, how much is Ask Sigma costing me?
You can get an idea about how the final dashboard looks like from the recording below. You will see how Sigma keeps track of the users, questions, the most-used sources and the overall performance.
However, the actual piece of information that tells the costs associated is the total number of tokens each prompt consumes, and the token expenditure depends on the LLM model your company has chosen to enable in Sigma.
For example, ChatGPT counts about one token for every four characters of text. The nice part is they only charge per million tokens, so most prompts and replies end up costing just a tiny fraction of a cent. (The official explanation from ChatGPT’s website is here). This means that the cost depends fully on the LLM model your company has chosen, and not on Sigma itself because it acts as a very efficient middleman that addresses all your AI-related operations to your preferred AI provider (more information in my blog: How to make your Sigma environment AI-Ready).
Well, that’s the nutshell version of how to track both the performance and costs of your Ask Sigma wizard. If you’re still curious about how tokens are computed in real time, I invite you to explore my sample dashboard, “How Much Does My AI-Powered Dashboard Cost?” which is about to be published in our Viz gallery very soon. There, you can see tokens and dollars being calculated after every click and watch your AI spend unfold live.
The best part is that beyond just tracking costs, Ask Sigma brings the power of AI directly into your decision-making process, turning raw data into clear insights and saving you hours of manual work. It’s fast, intuitive, and built to help you focus on what matters most: making smarter, data-driven choices. I look forward to getting your ideas about it!