
Last year, I took a look at the Summer 2022 transfer window for the top five leagues in Europe. The main takeaway was that Premier League clubs are pulling away from the rest of Europe when it comes to their spending power.
But has this trend continued a year on? I’ve once again used Tableau to analyse the spending of clubs in Europe to see if there are any interesting stories that come out of the data.
A Quick Explanation
The data sources used for this analysis are the Guardian Transfer Window trackers. I have only included deals where a club paid a disclosed fee for a permanent transfer of a player. The top five European leagues are classed as the English Premier League (England), La Liga (Spain), Serie A (Italy), Bundesliga (Germany) & Ligue 1 (France).
Within European football, there are two windows per season where you can sign players: The summer transfer window, which runs between June and the end of August, and the January transfer window, which just runs throughout the month of January
The 2023 Transfer Window Visualized
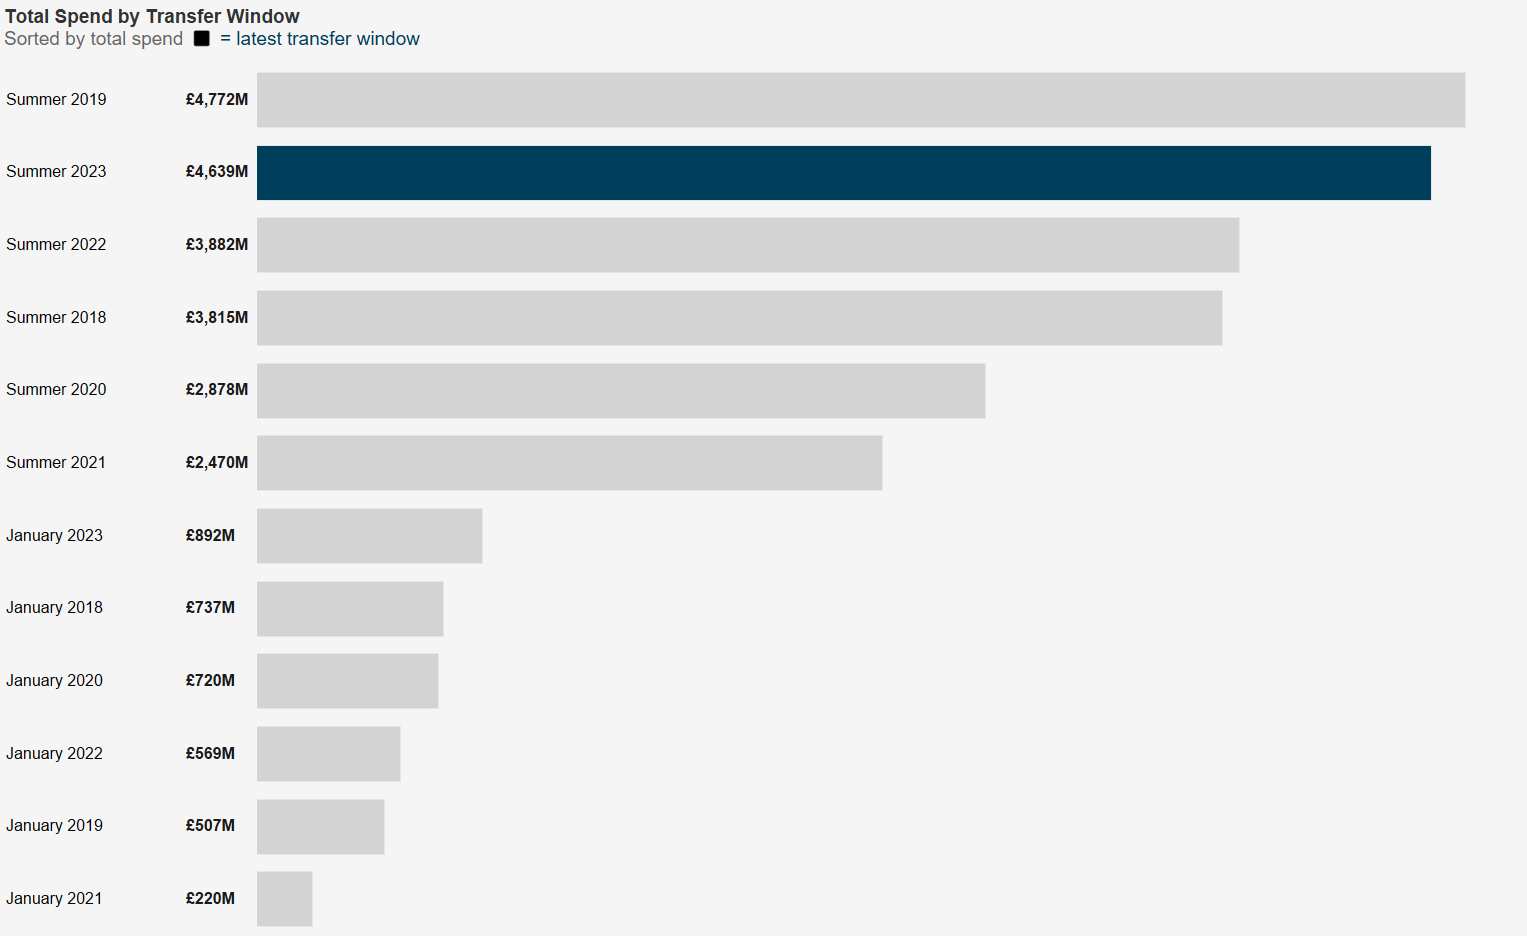
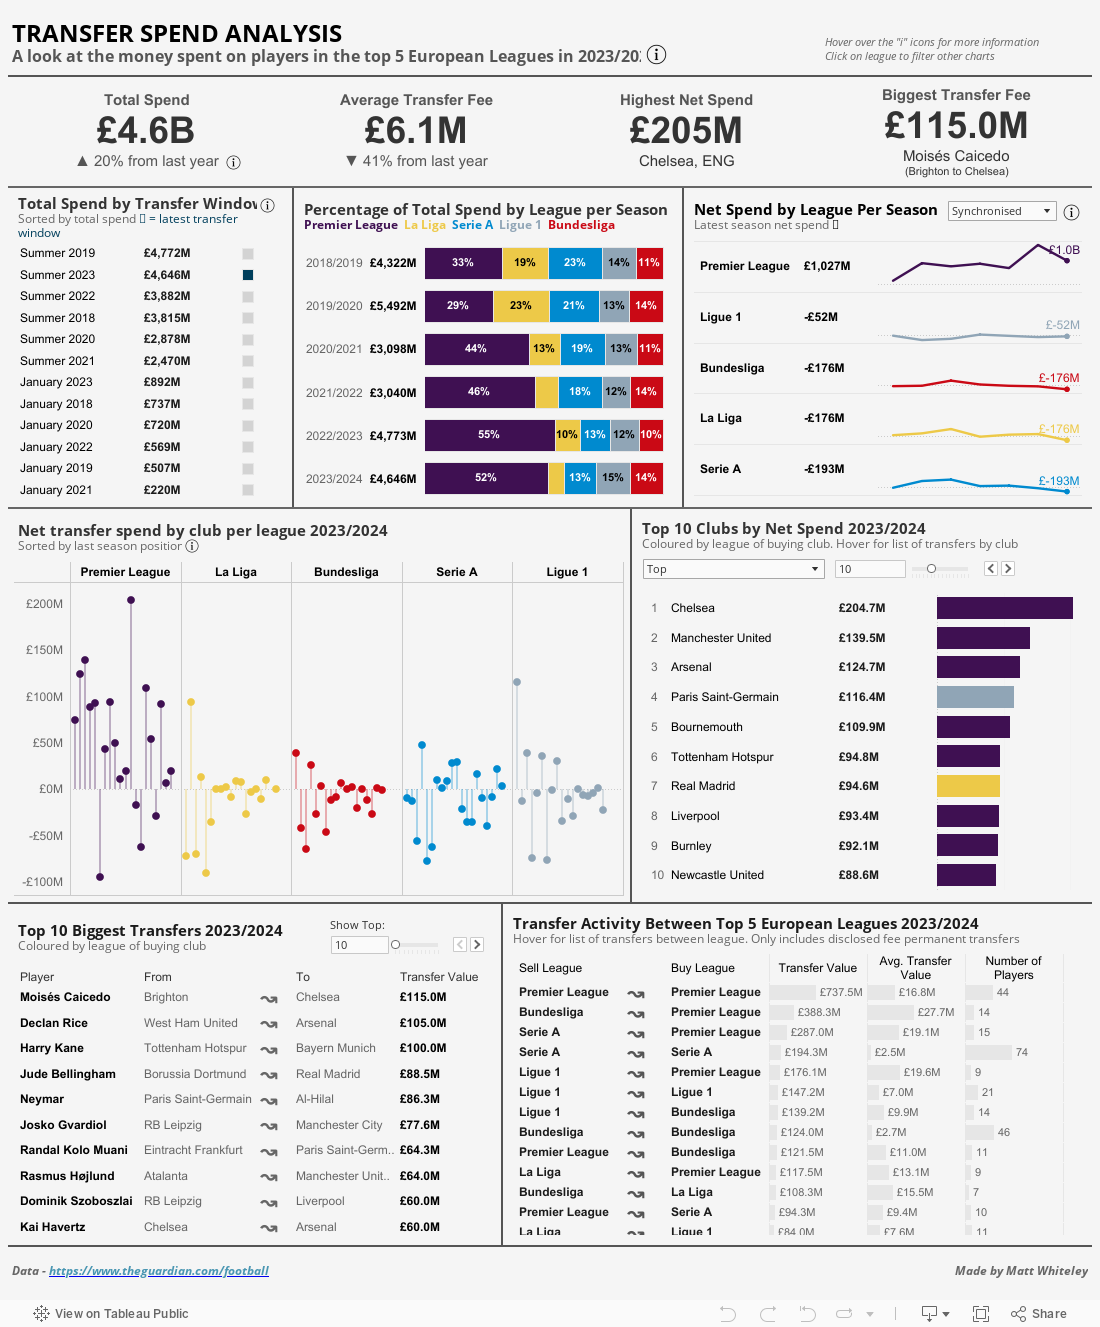
Once again, overall transfer window spending has increased again from last year with over £750m more being spent this summer as opposed to last summer. If it increases again next year, then it looks increasingly likely that we will surpass the record window of 2019.
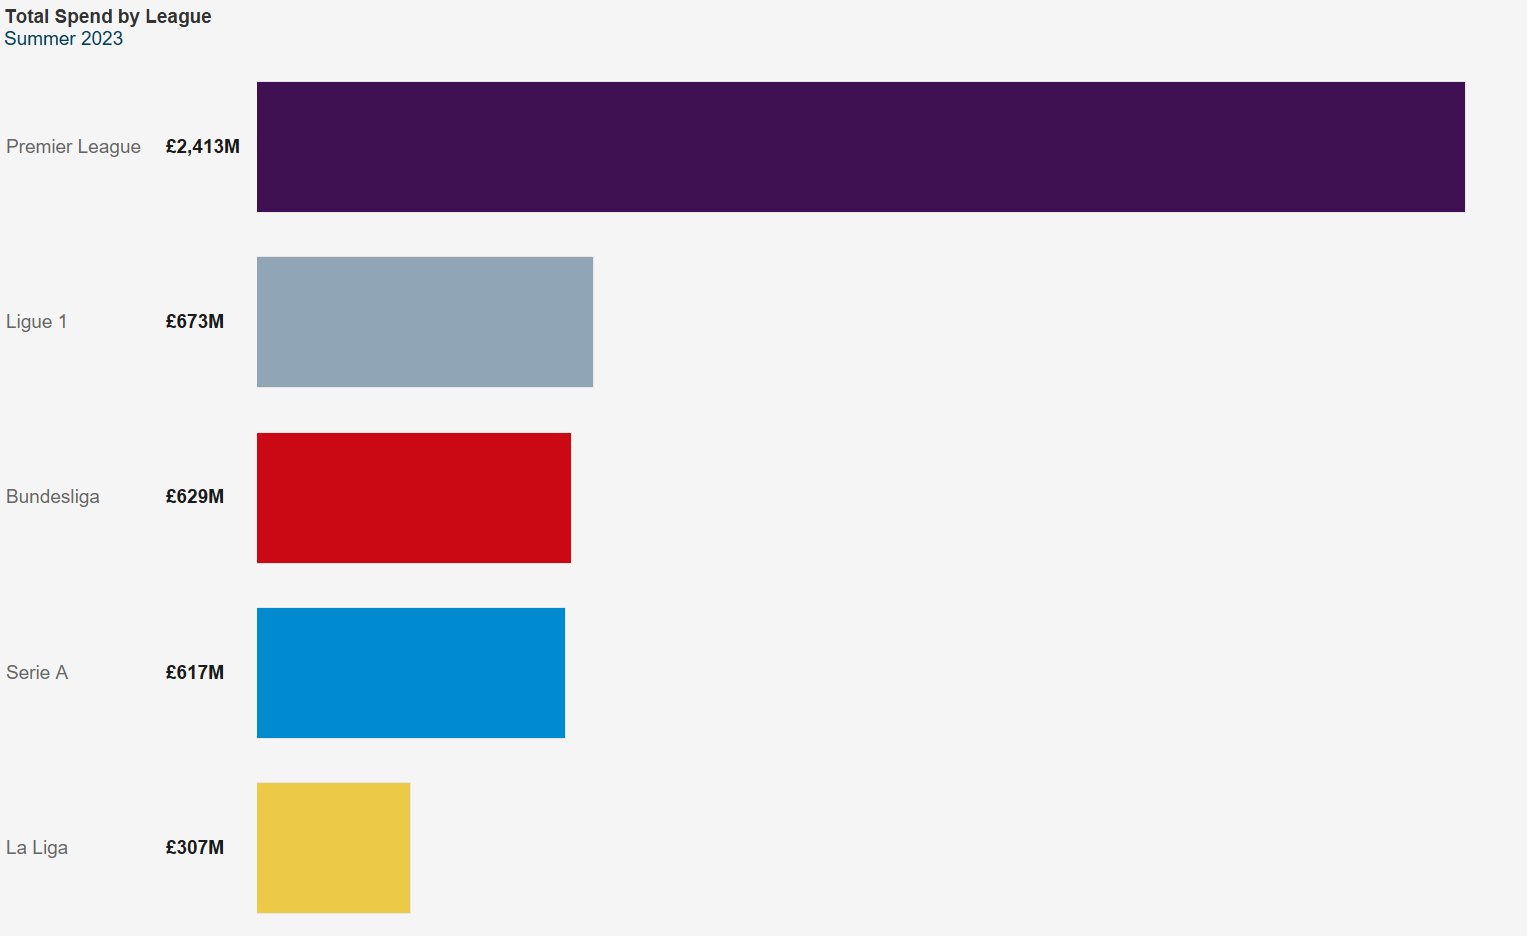
However, just like last year, if we did deeper by league, there is one dominant league driving this spending, with £2.4 billion of that £4.6 billion being spent by English clubs:
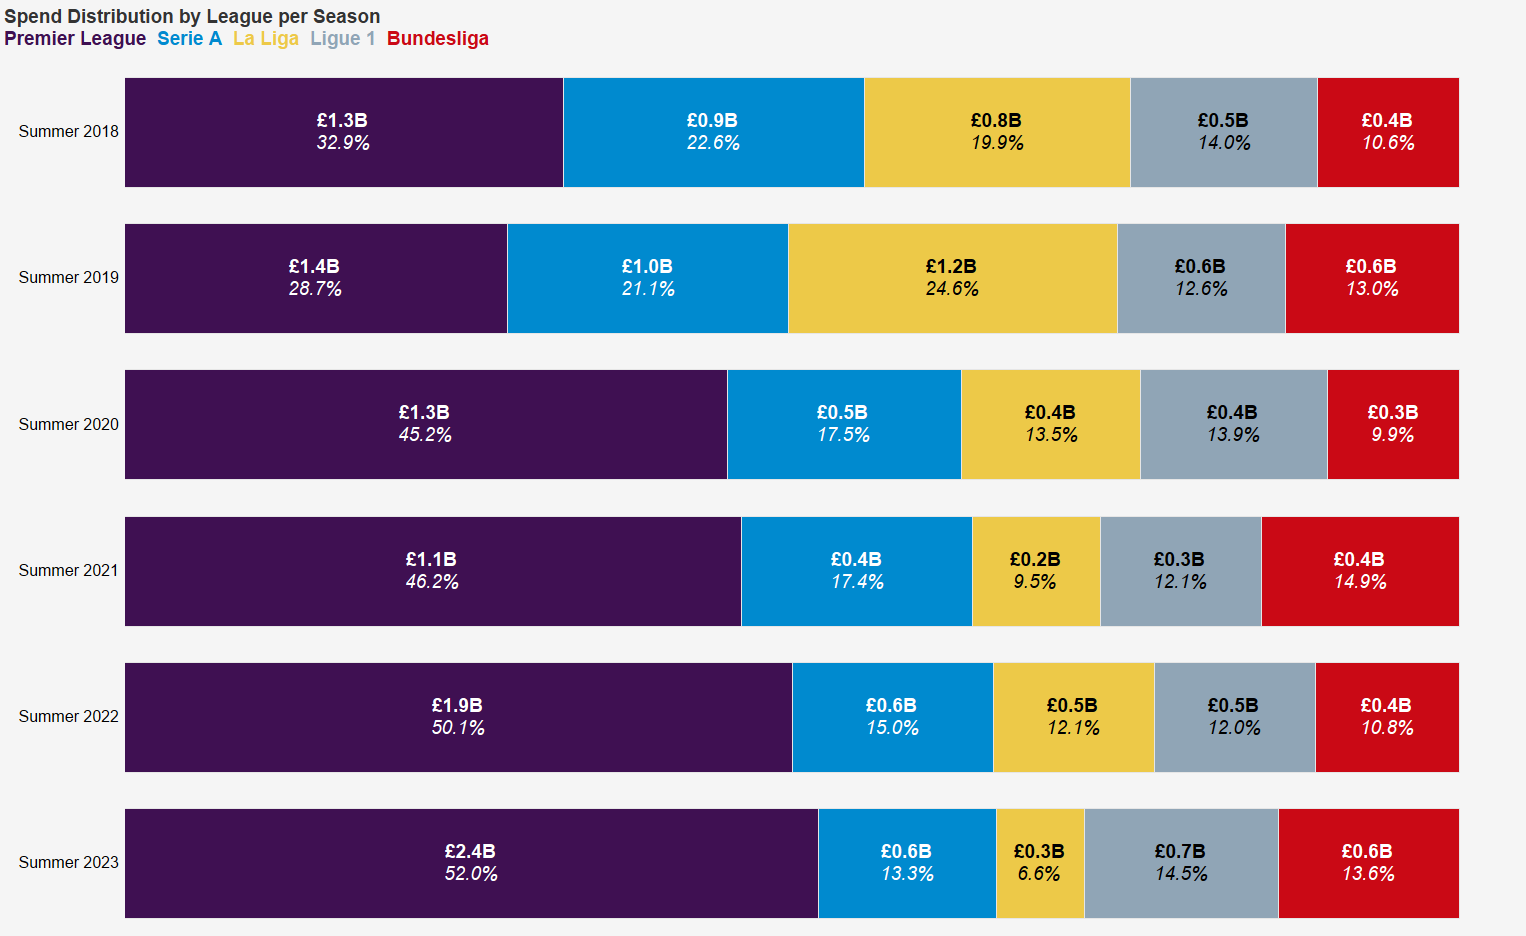
 And if we look at this distribution in comparison to the other summer windows, we can again see the percent of the total spend is increasing amongst Premier League teams, with 52% of total spending now coming from that one league, a 2% increase from last year:
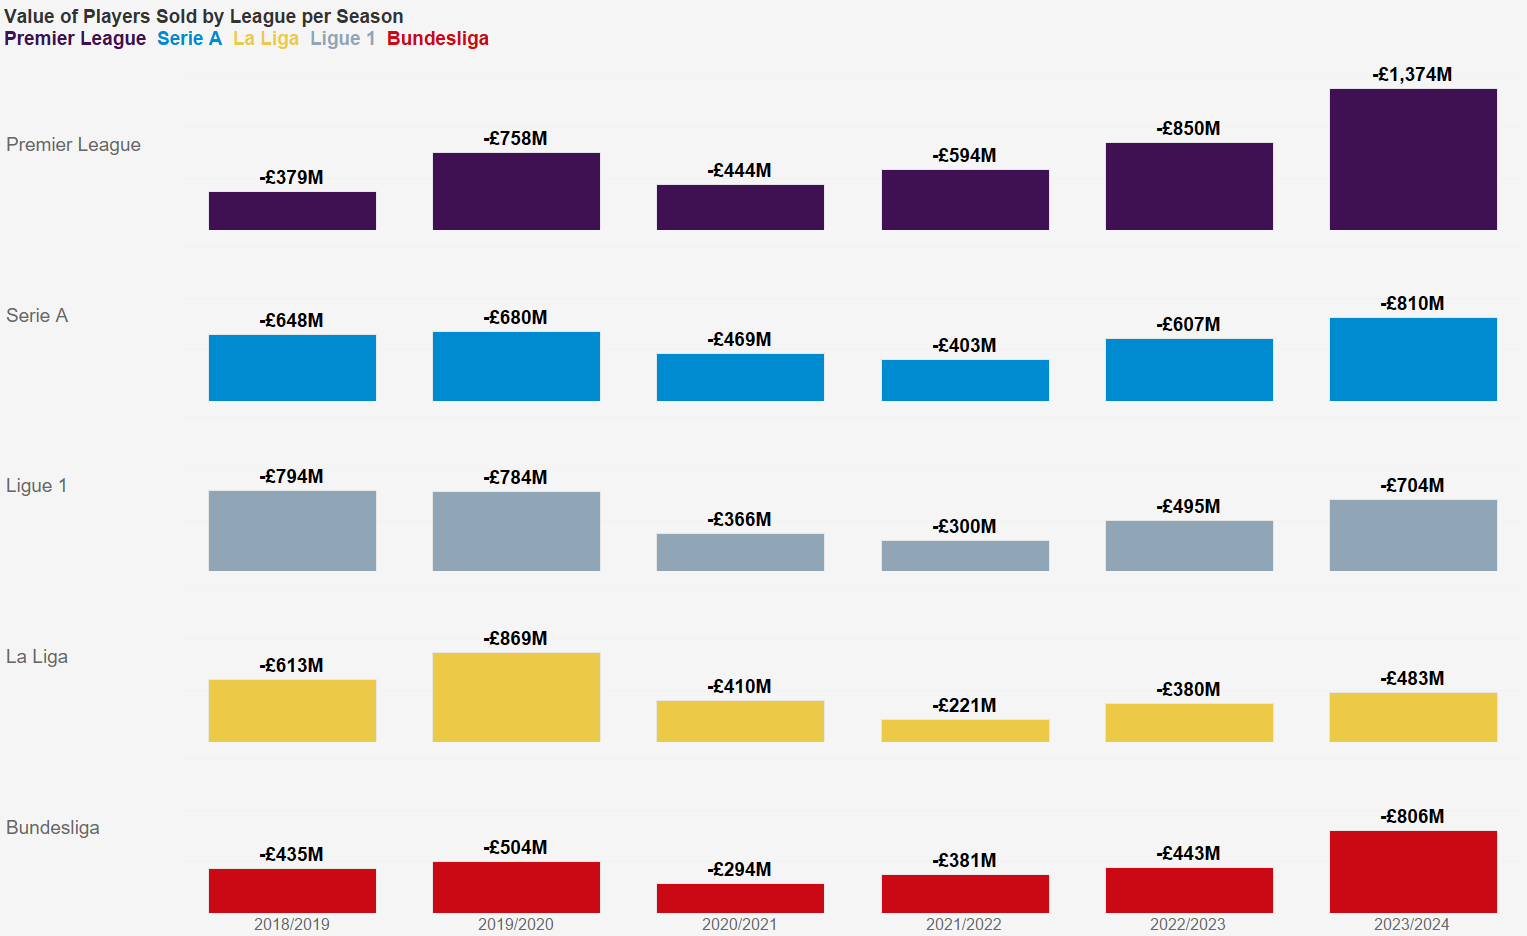
However, where the analysis of this seasons spending gets interesting is when looking at the net spend by league for each of the summer transfer windows. This is the value of players bought vs. value of players sold. Once again, the Premier League dominates, but despite the big increase in spending as seen above, the overall net spend has actually slightly decreased:
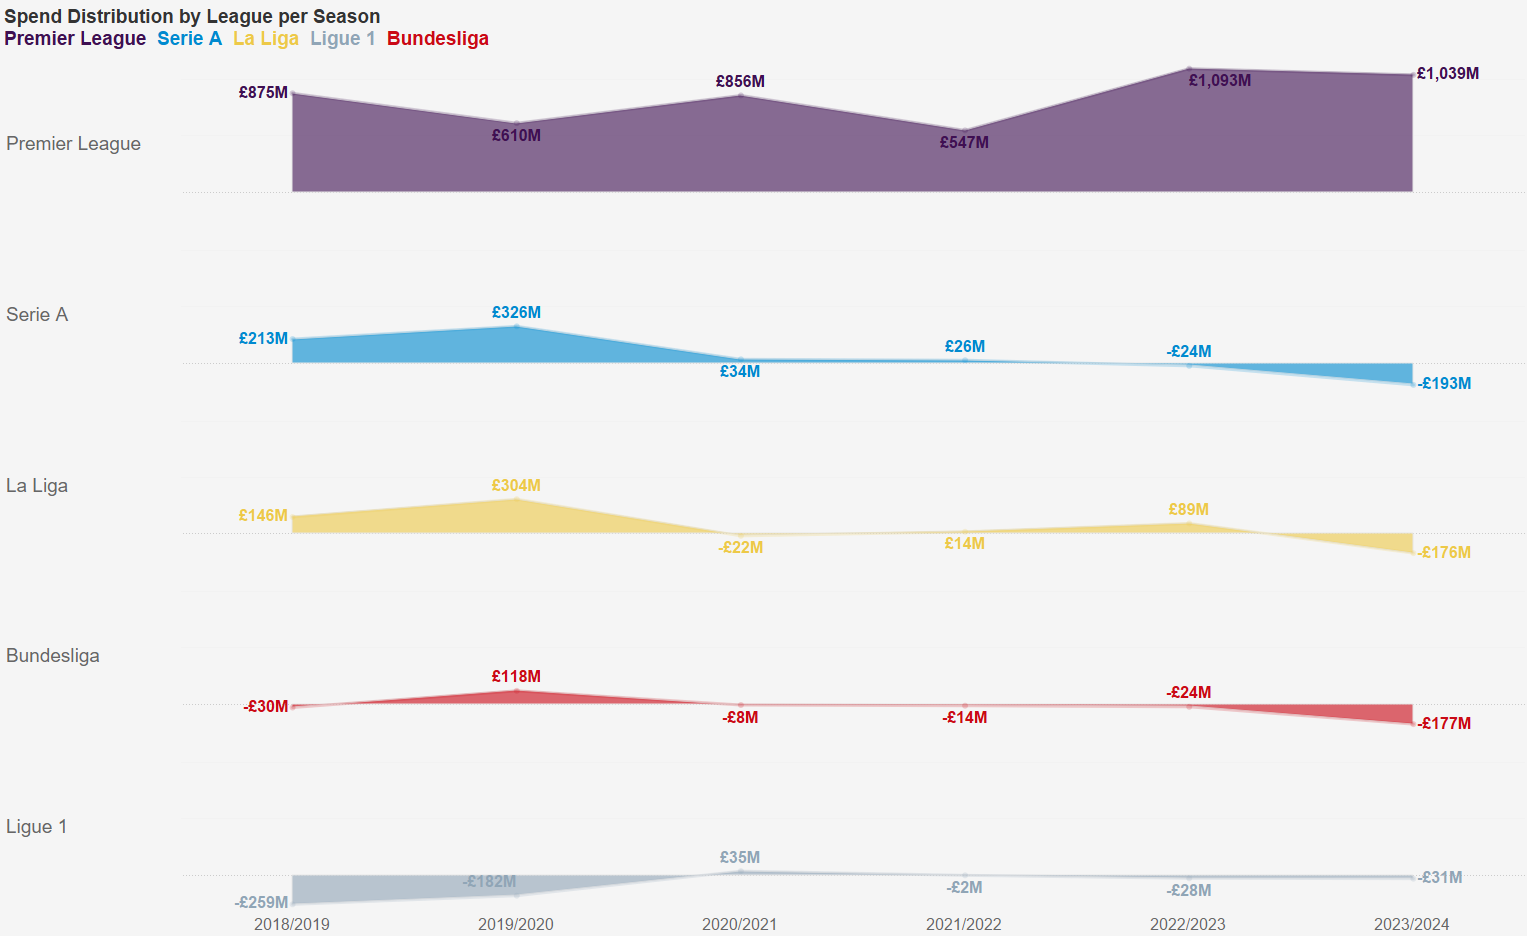
In fact, all leagues have significantly increased the value of players they have sold this season. The Premier League has sold over £500m more worth of players than they ever have before, with Serie A and Bundesliga also hitting record numbers:
So where are these players going?
A New Player
If you’ve been following the world of Football or even other sports like Golf in the last year, you would have noticed the increasing influence of Saudi Arabia. This year, the Saudi Arabian investment fund (PIF) took control of four clubs in the Saudi League, which has led to huge summer spending spree.
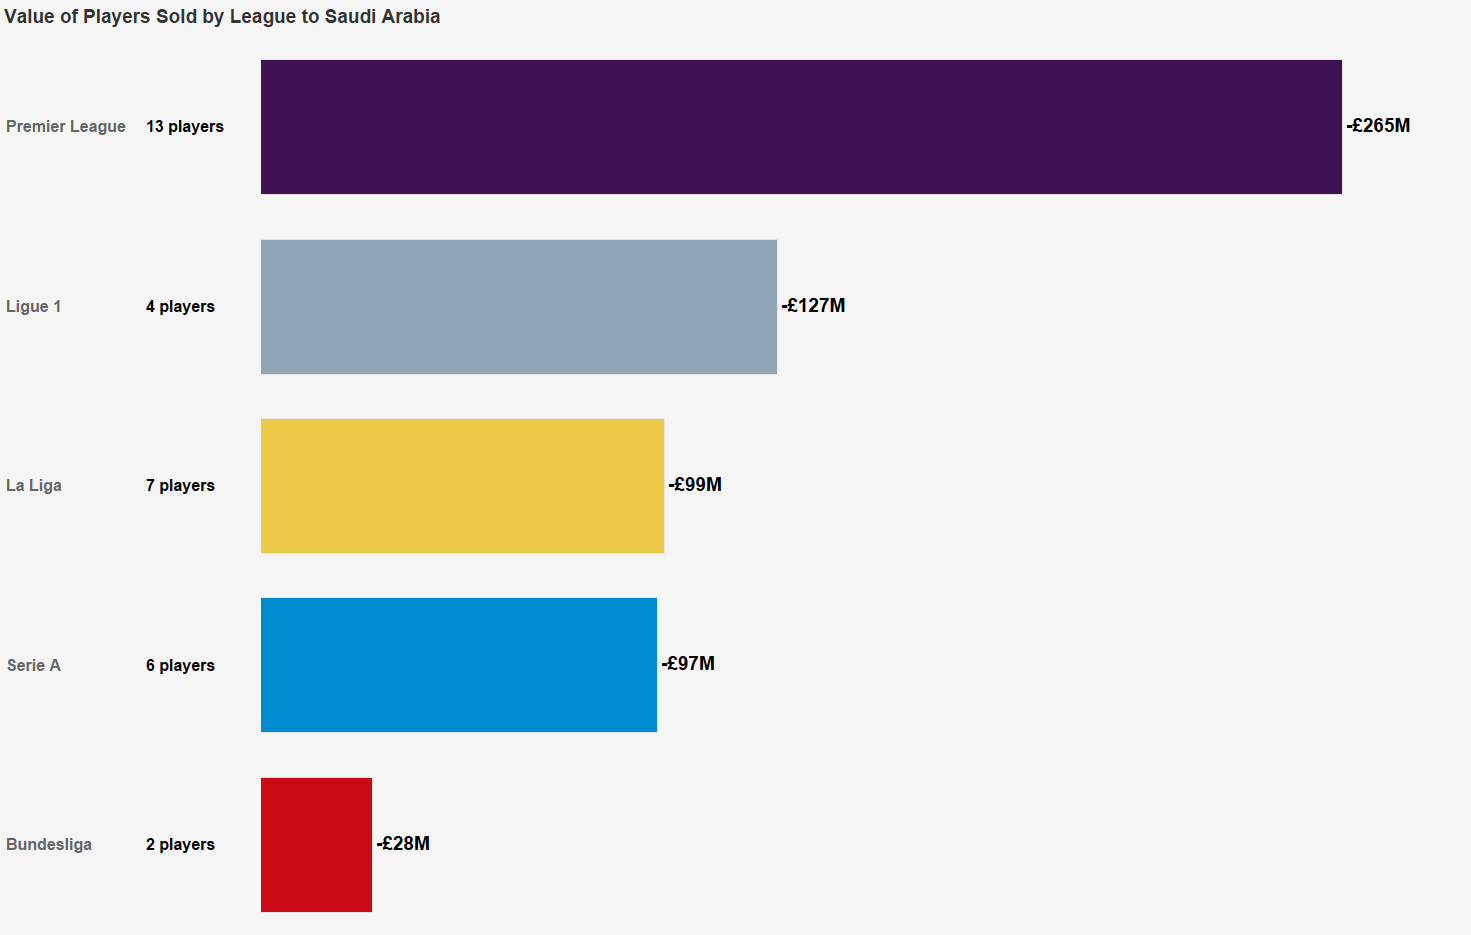
This had led to many clubs, specifically in England, being able to fund their spending sprees by offloading players for large sums to Saudi Arabia with 13 players fetching a total of £265m for their clubs:
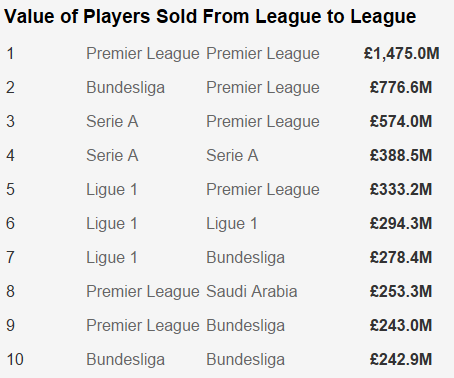
In fact, if we look at the transfers between leagues, moving from the Premier League to Saudi Arabia is the fourth highest combination in transfer fees, which is quite mad to think considering there were zero transfers between the two leagues last year:
A Closer Look at the Premier League
We’ve established that premier league teams are the one spending most of the money, but what about individual clubs in the league? Is it spread fairly evenly, or are a small number of clubs dominating the transfer market?
With each club sorted by the position they finished last season, with promoted clubs getting assigned the last 3 places based on their finish in the league below, we can get a good idea of who is spending the money:
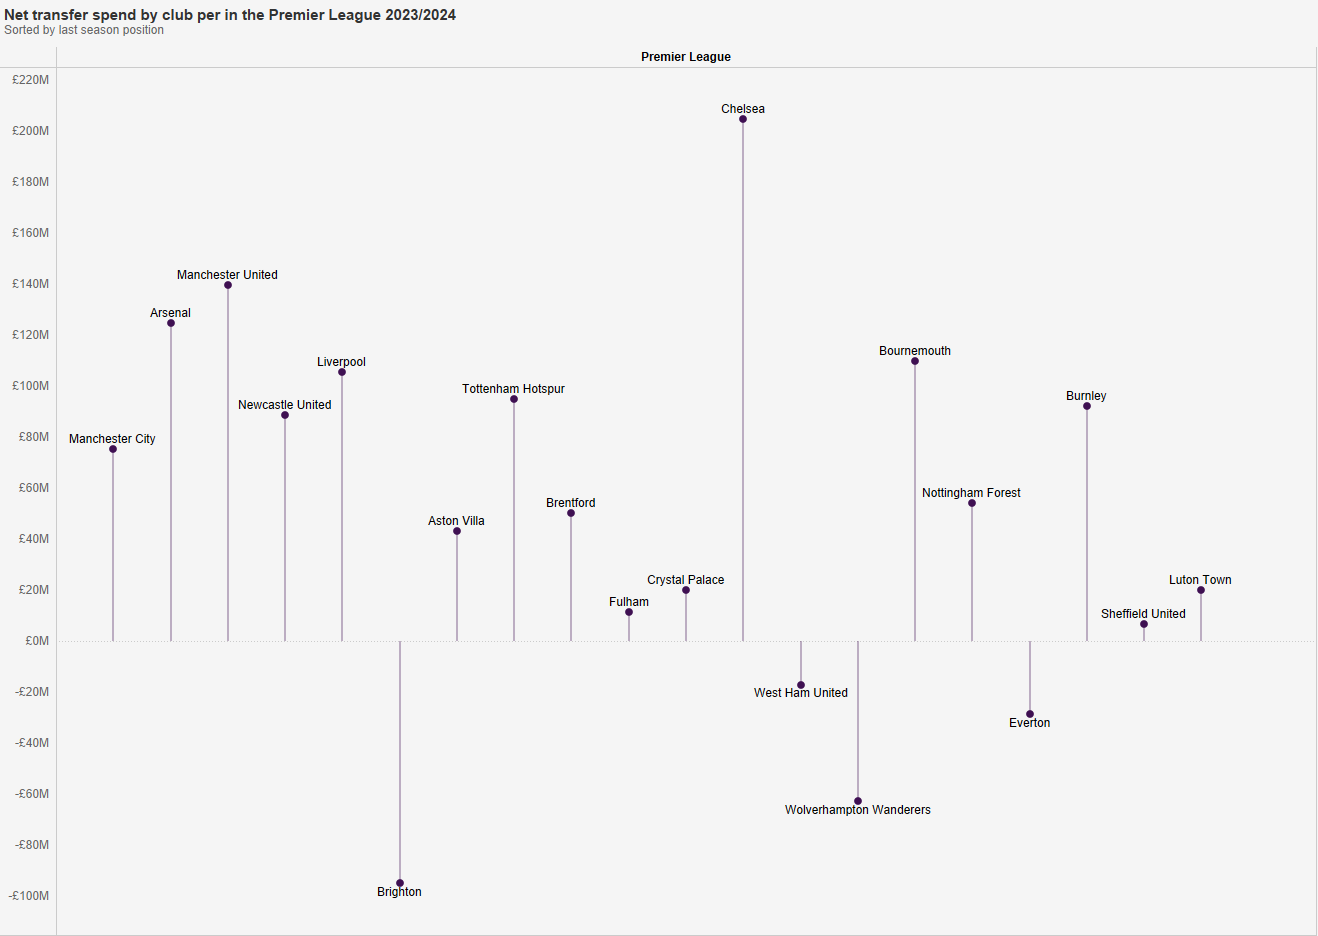
While distributed fairly evenly across the league, there is one team that stands out with a net spend of over £200 million: Chelsea.
In fact, if we look at the last three transfer windows, Chelsea have actually been the biggest net spenders in Europe in each of those windows with more than £350m more in net spend than the next highest and nearly 30 players signed in that timeframe:
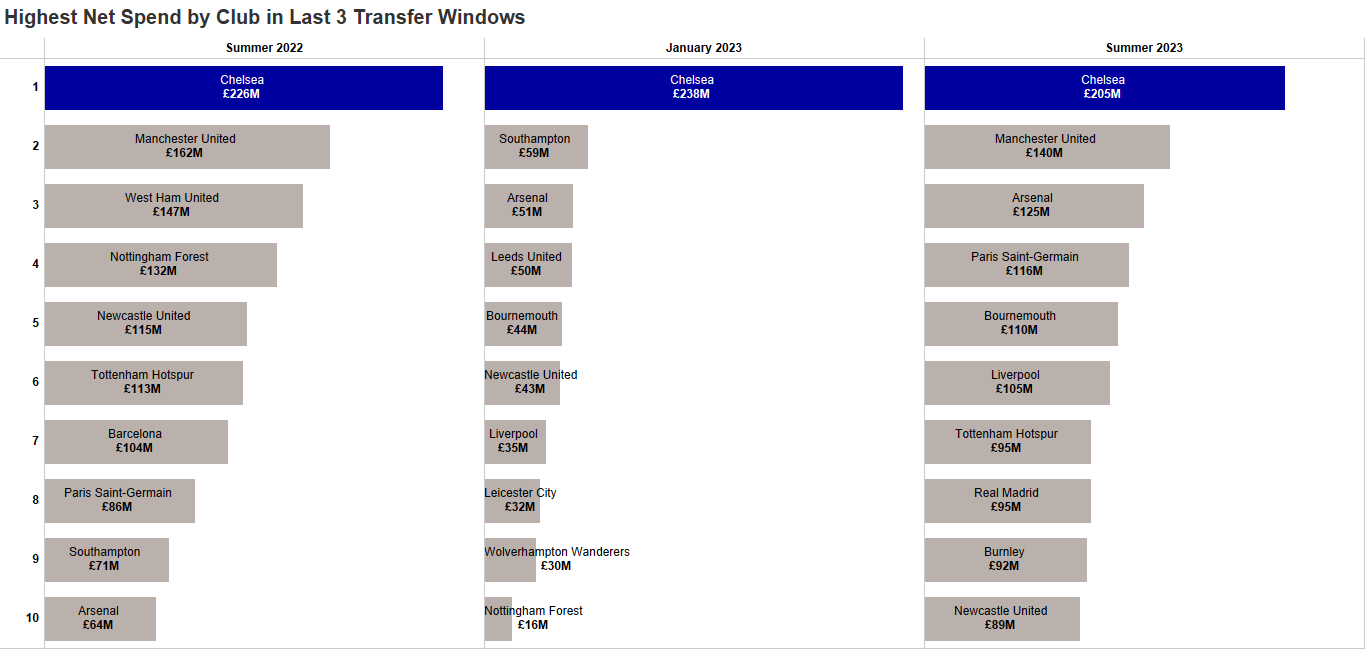
Their fans will undoubtedly be hoping that this spending will lead to higher than a 12th place finish this year.
Intra-League Transfers
One last interesting highlight from this data is when looking at players moving from one premier league team to another. Last year, we highlighted overall increase in domestic spend in England, but this year, I want to look at it a little more granularly. In recent history, there have’t been many transfers between the traditional top six clubs in England, as you wouldn’t want to be seen as strengthening a rival team.
By traditional top six, I mean Manchester United, Manchester City, Arsenal, Chelsea, Liverpool and Tottenham Hostspur. For the latest window, I also included Newcastle, who can now be considered part of the Premier League elite after finishing 4th last season:
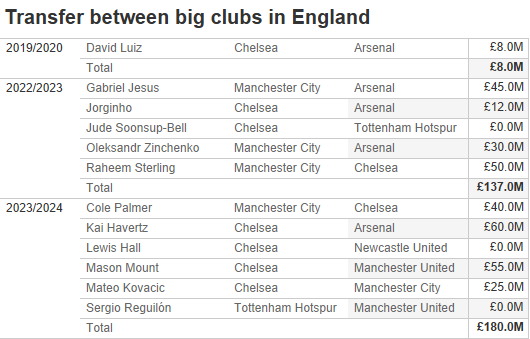
However, with the lack of spending power in Europes, other leagues has lowered the number of teams willing to pay what these teams want, we are now seeing more transfers occur between the top teams in England.
Prior to 2022, there was only one transfer between these teams and that was arguably for a player in the latter part of his career. However, the last two seasons have seen players who are considered in their “prime” and fairly regular starters at their clubs making the switch, such as Gabriel Jesus, Mason Mount and Kai Havertz. One of the reasons for this increase is that players wanting to move on from big clubs also want to continue playing football at the highest level, and with other top teams in Europe reigning in their spending, the only options to get a transfer fee they consider acceptable is to sell to a rival in the same league. I would expect to see this trend continue as the pool of teams willing to pay high transfer fees and wages in Europe becomes smaller.
I’m sure there are a lot more interesting observations to be made from this data set. A dashboard with some of the above charts plus some new ones can be seen below:
If you want access to this data or have any other questions, feel free to email me at matthew.whiteley@interworks.co.uk.