If we cast our minds back to April 2021, fans of football around Europe came together to squash the proposed “European Super League” idea, which would see a select few teams played against each other in a closed shop league with no relegation or promotion.
The argument from certain hierarchies at participating clubs was that teams needed new ways to increase their revenue to sustain their competitiveness, particularly in the aftermath of the financial effects of the Covid pandemic. While that argument was relevant for most of the clubs who decided to join the breakaway league, it was harder for the Premier League teams to use that reason to justify their decision to join. The Premier League has been seen to have benefitted more than any other league from foreign investment, bumper TV deals and rapid commercialisation over the last two decades.
In the last 18 months or so, we have seen more talk that the Premier League teams are even further ahead than other leagues when it comes to spending. Using Tableau, I decided to look at the transfer dealings of the clubs in the top five leagues to see whether this is true.
Transfer Windows, by the Numbers
The data sources used for this analysis are the Guardian Transfer Window trackers. I only included deals where a club paid a disclosed fee for a permanent transfer of a player. The top five European leagues are classed as the English Premier League (England), La Liga (Spain), Serie A (Italy), Bundesliga (Germany) & Ligue 1 (France).
Within European football, there are two windows per season where you can sign players: the Summer transfer window, which runs between June and the end of August, and the January transfer window, which just runs throughout the month of January.
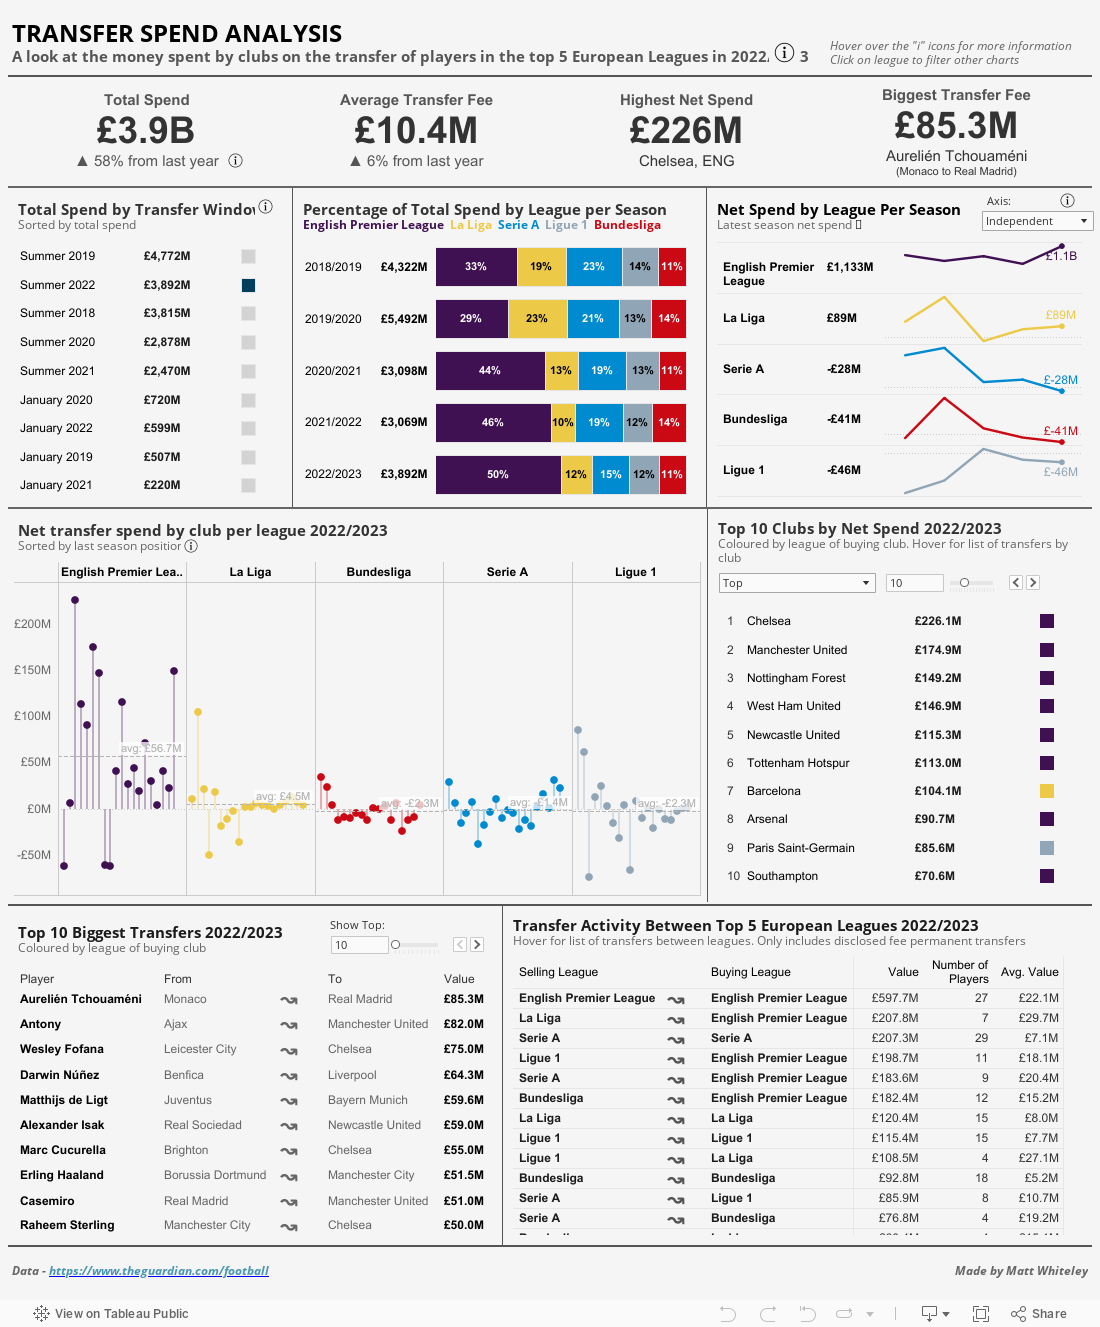
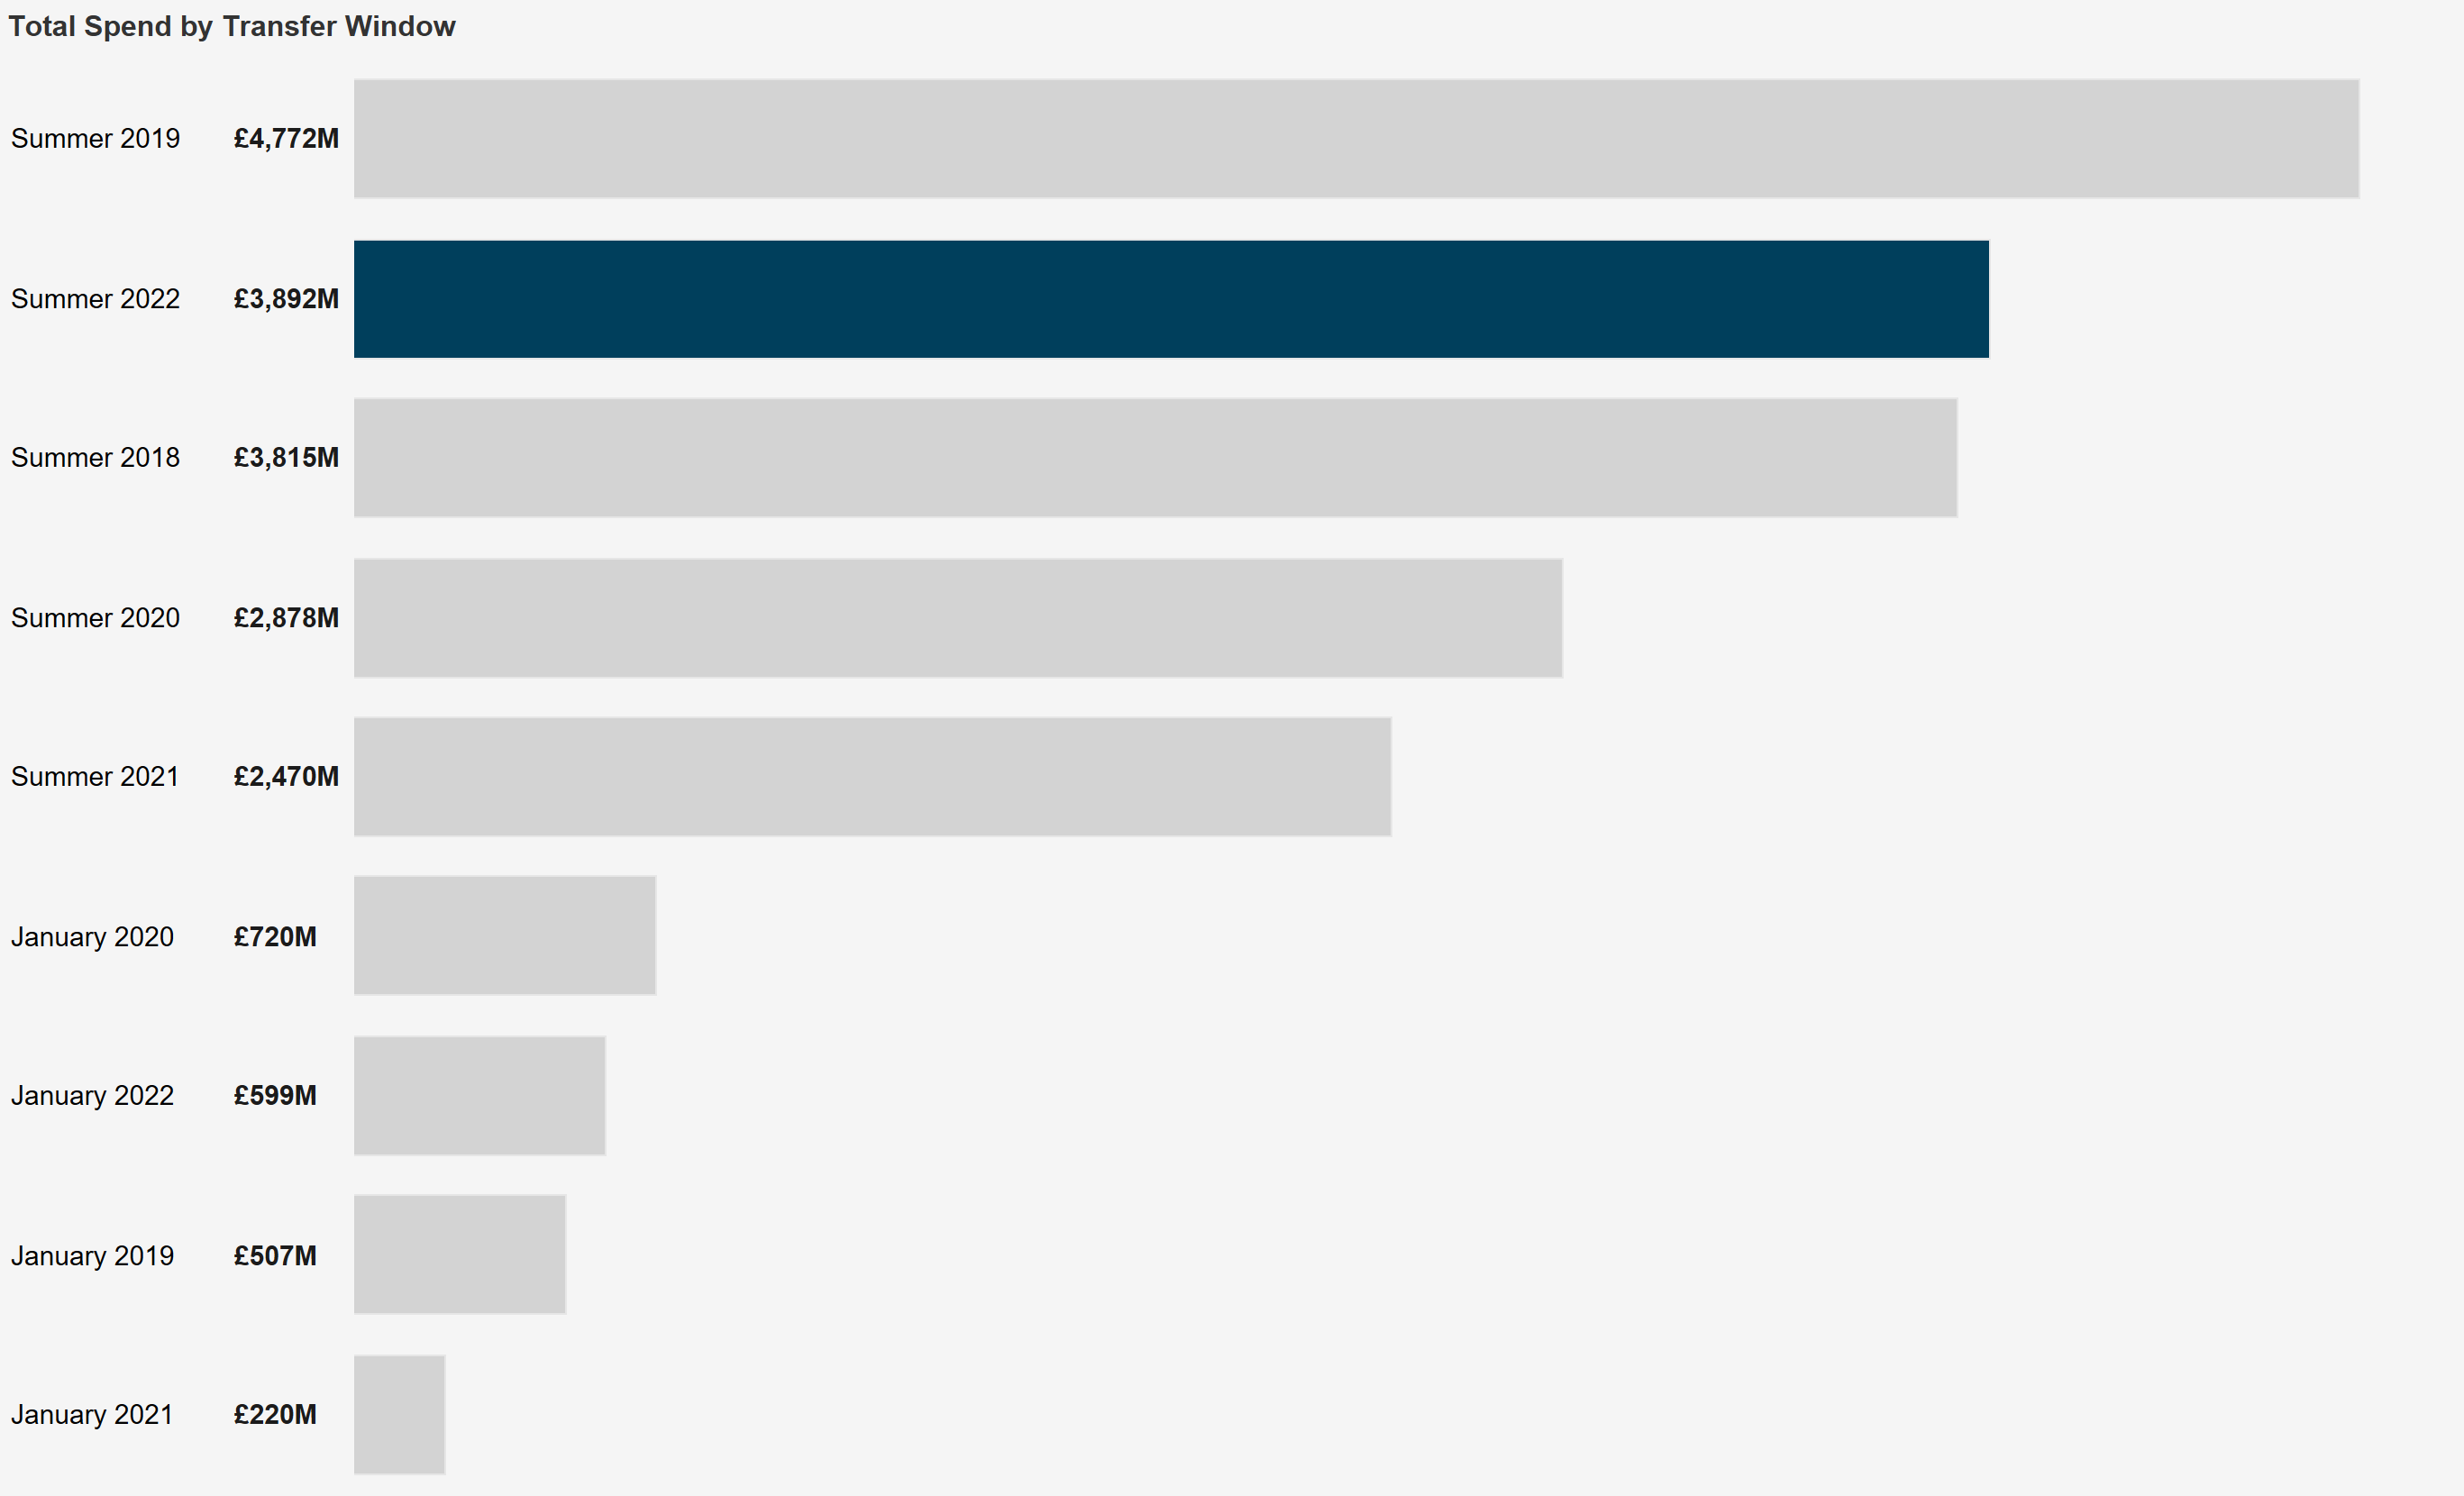
If we look at total overall spending in the last five seasons, we can see the latest transfer window only trails Summer 2019 in terms of total spending by clubs. More interestingly, there was over £1 billion more spent in this summer transfer window compared to the Covid-affected windows. With spending back to similar pre-pandemic levels, at first glance it looks like the fortunes of European clubs are on the up again:
However, if we dig deeper by league, there is only one league that is driving up that spending. Of that £3.9 billion spent, over £1.9 billion was spent by Premier League clubs. That is nearly 50% of the total spending across the five leagues.
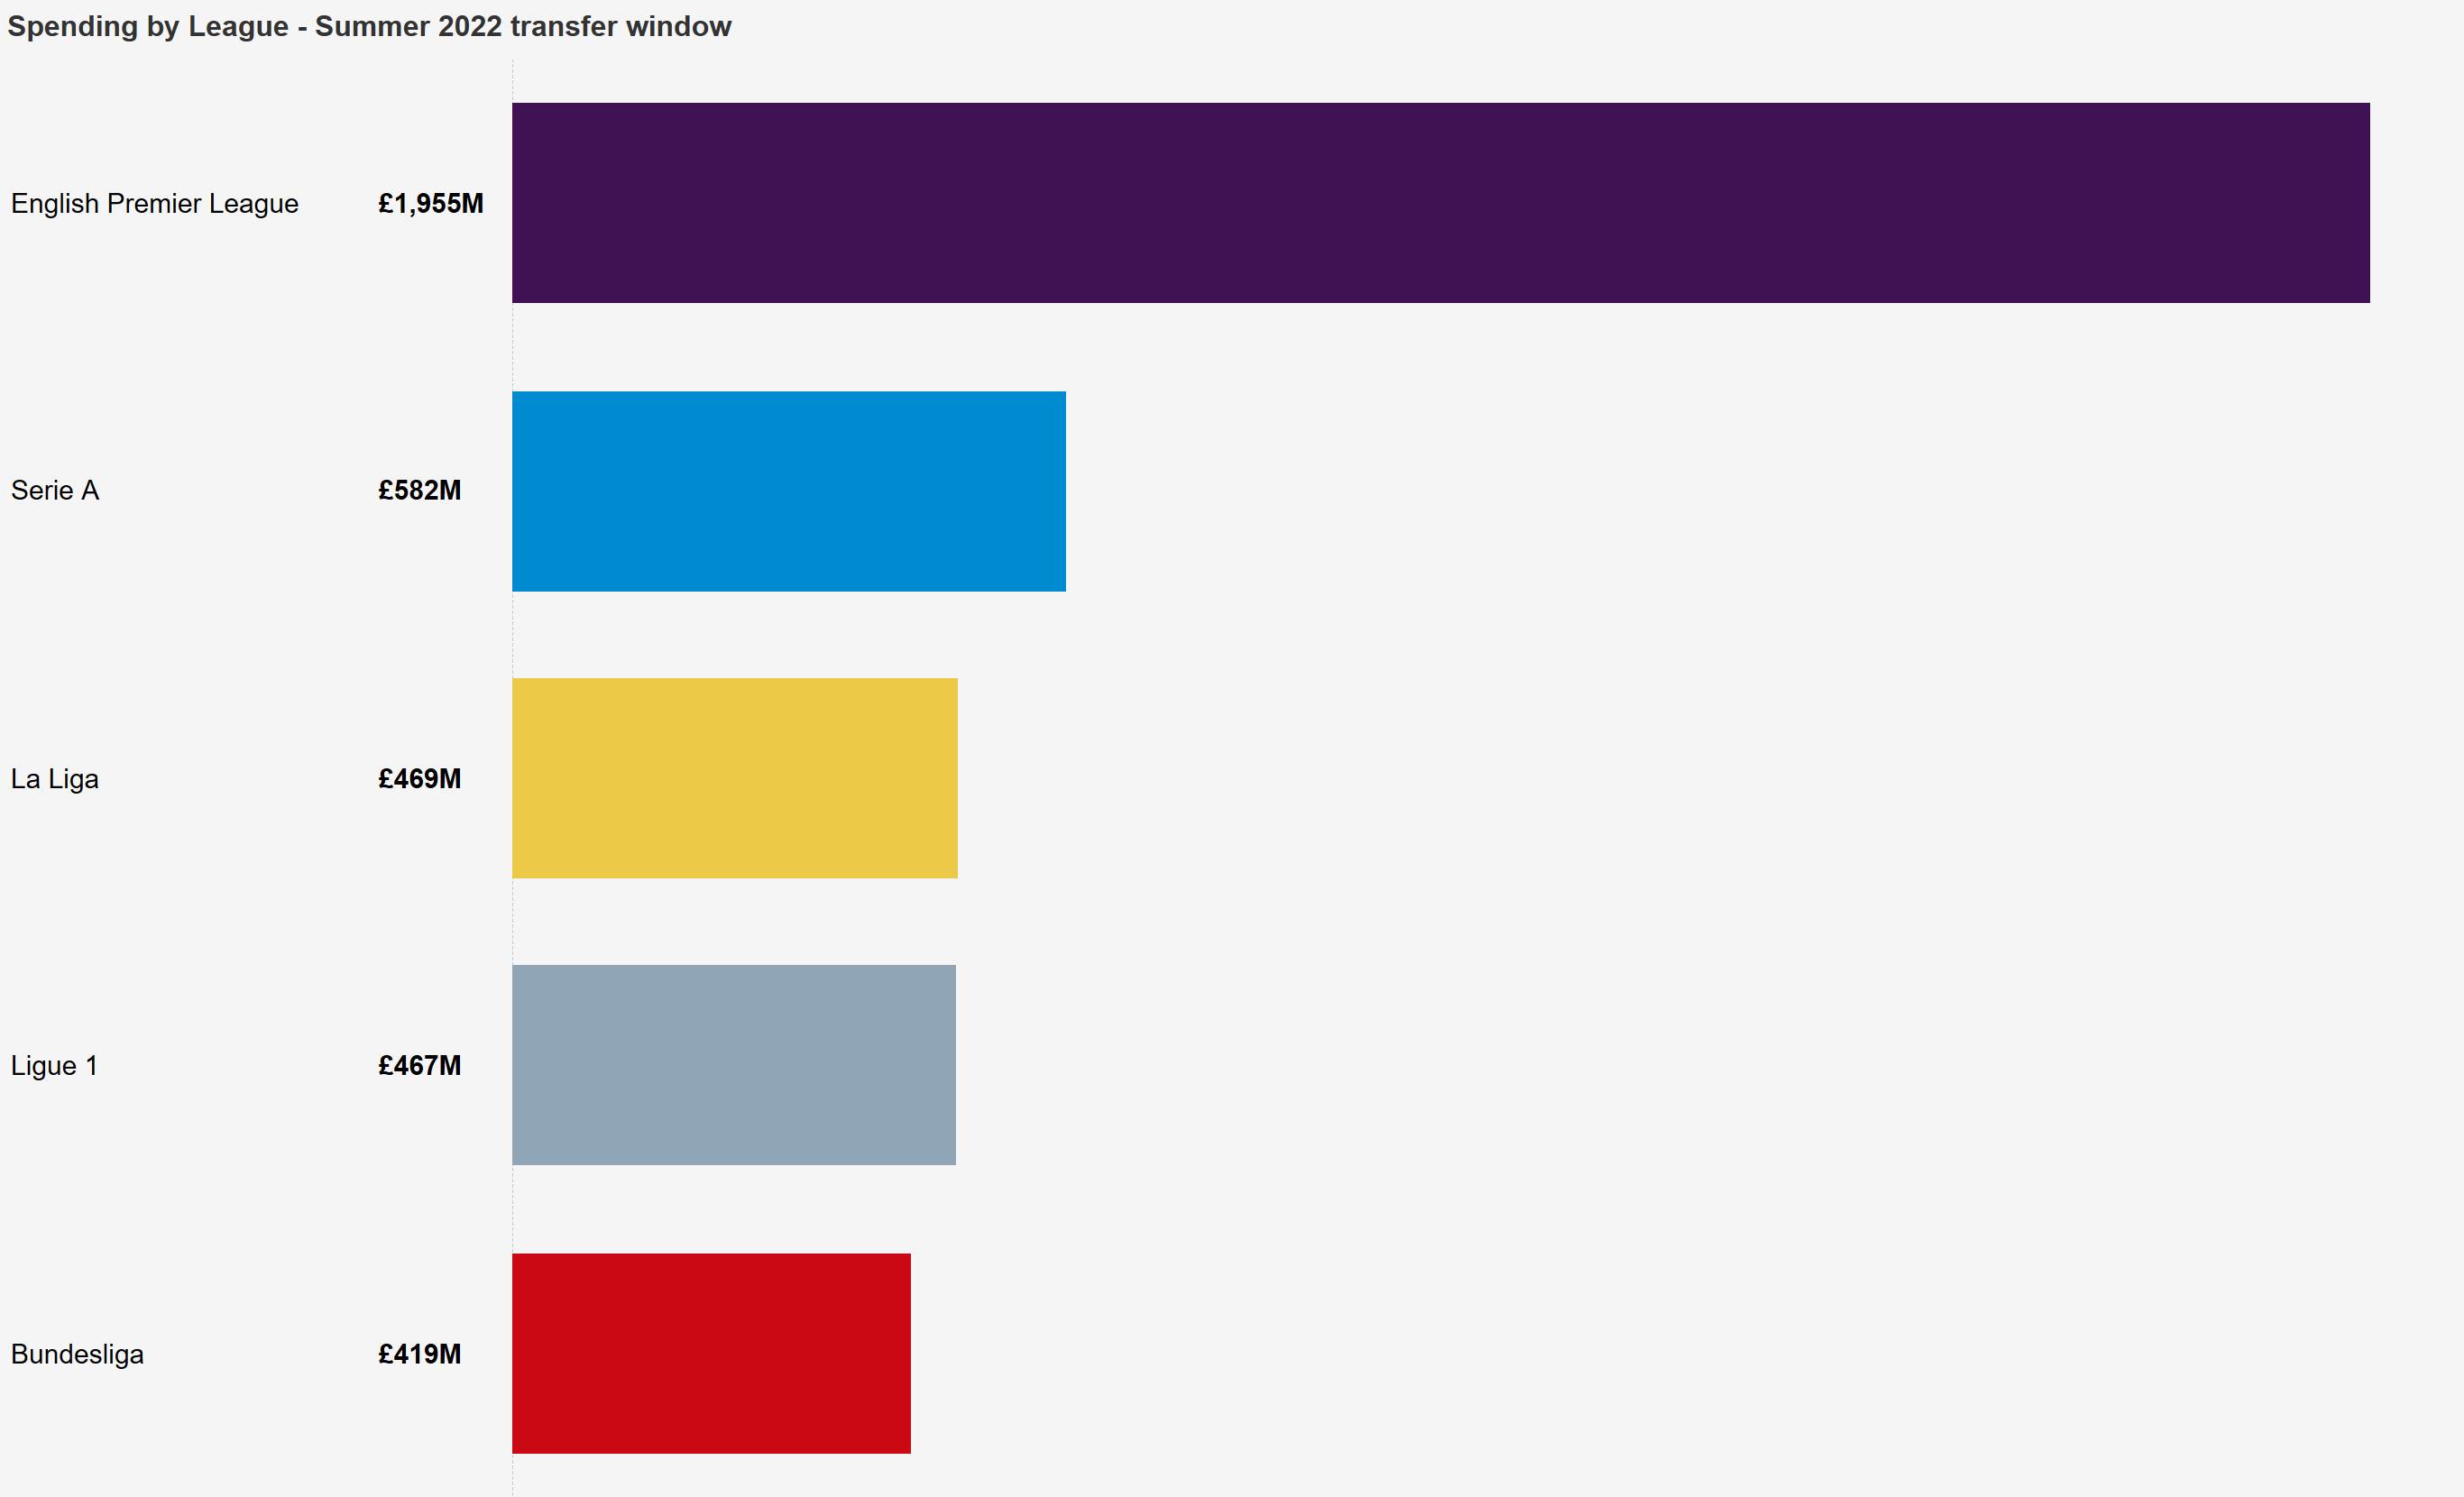
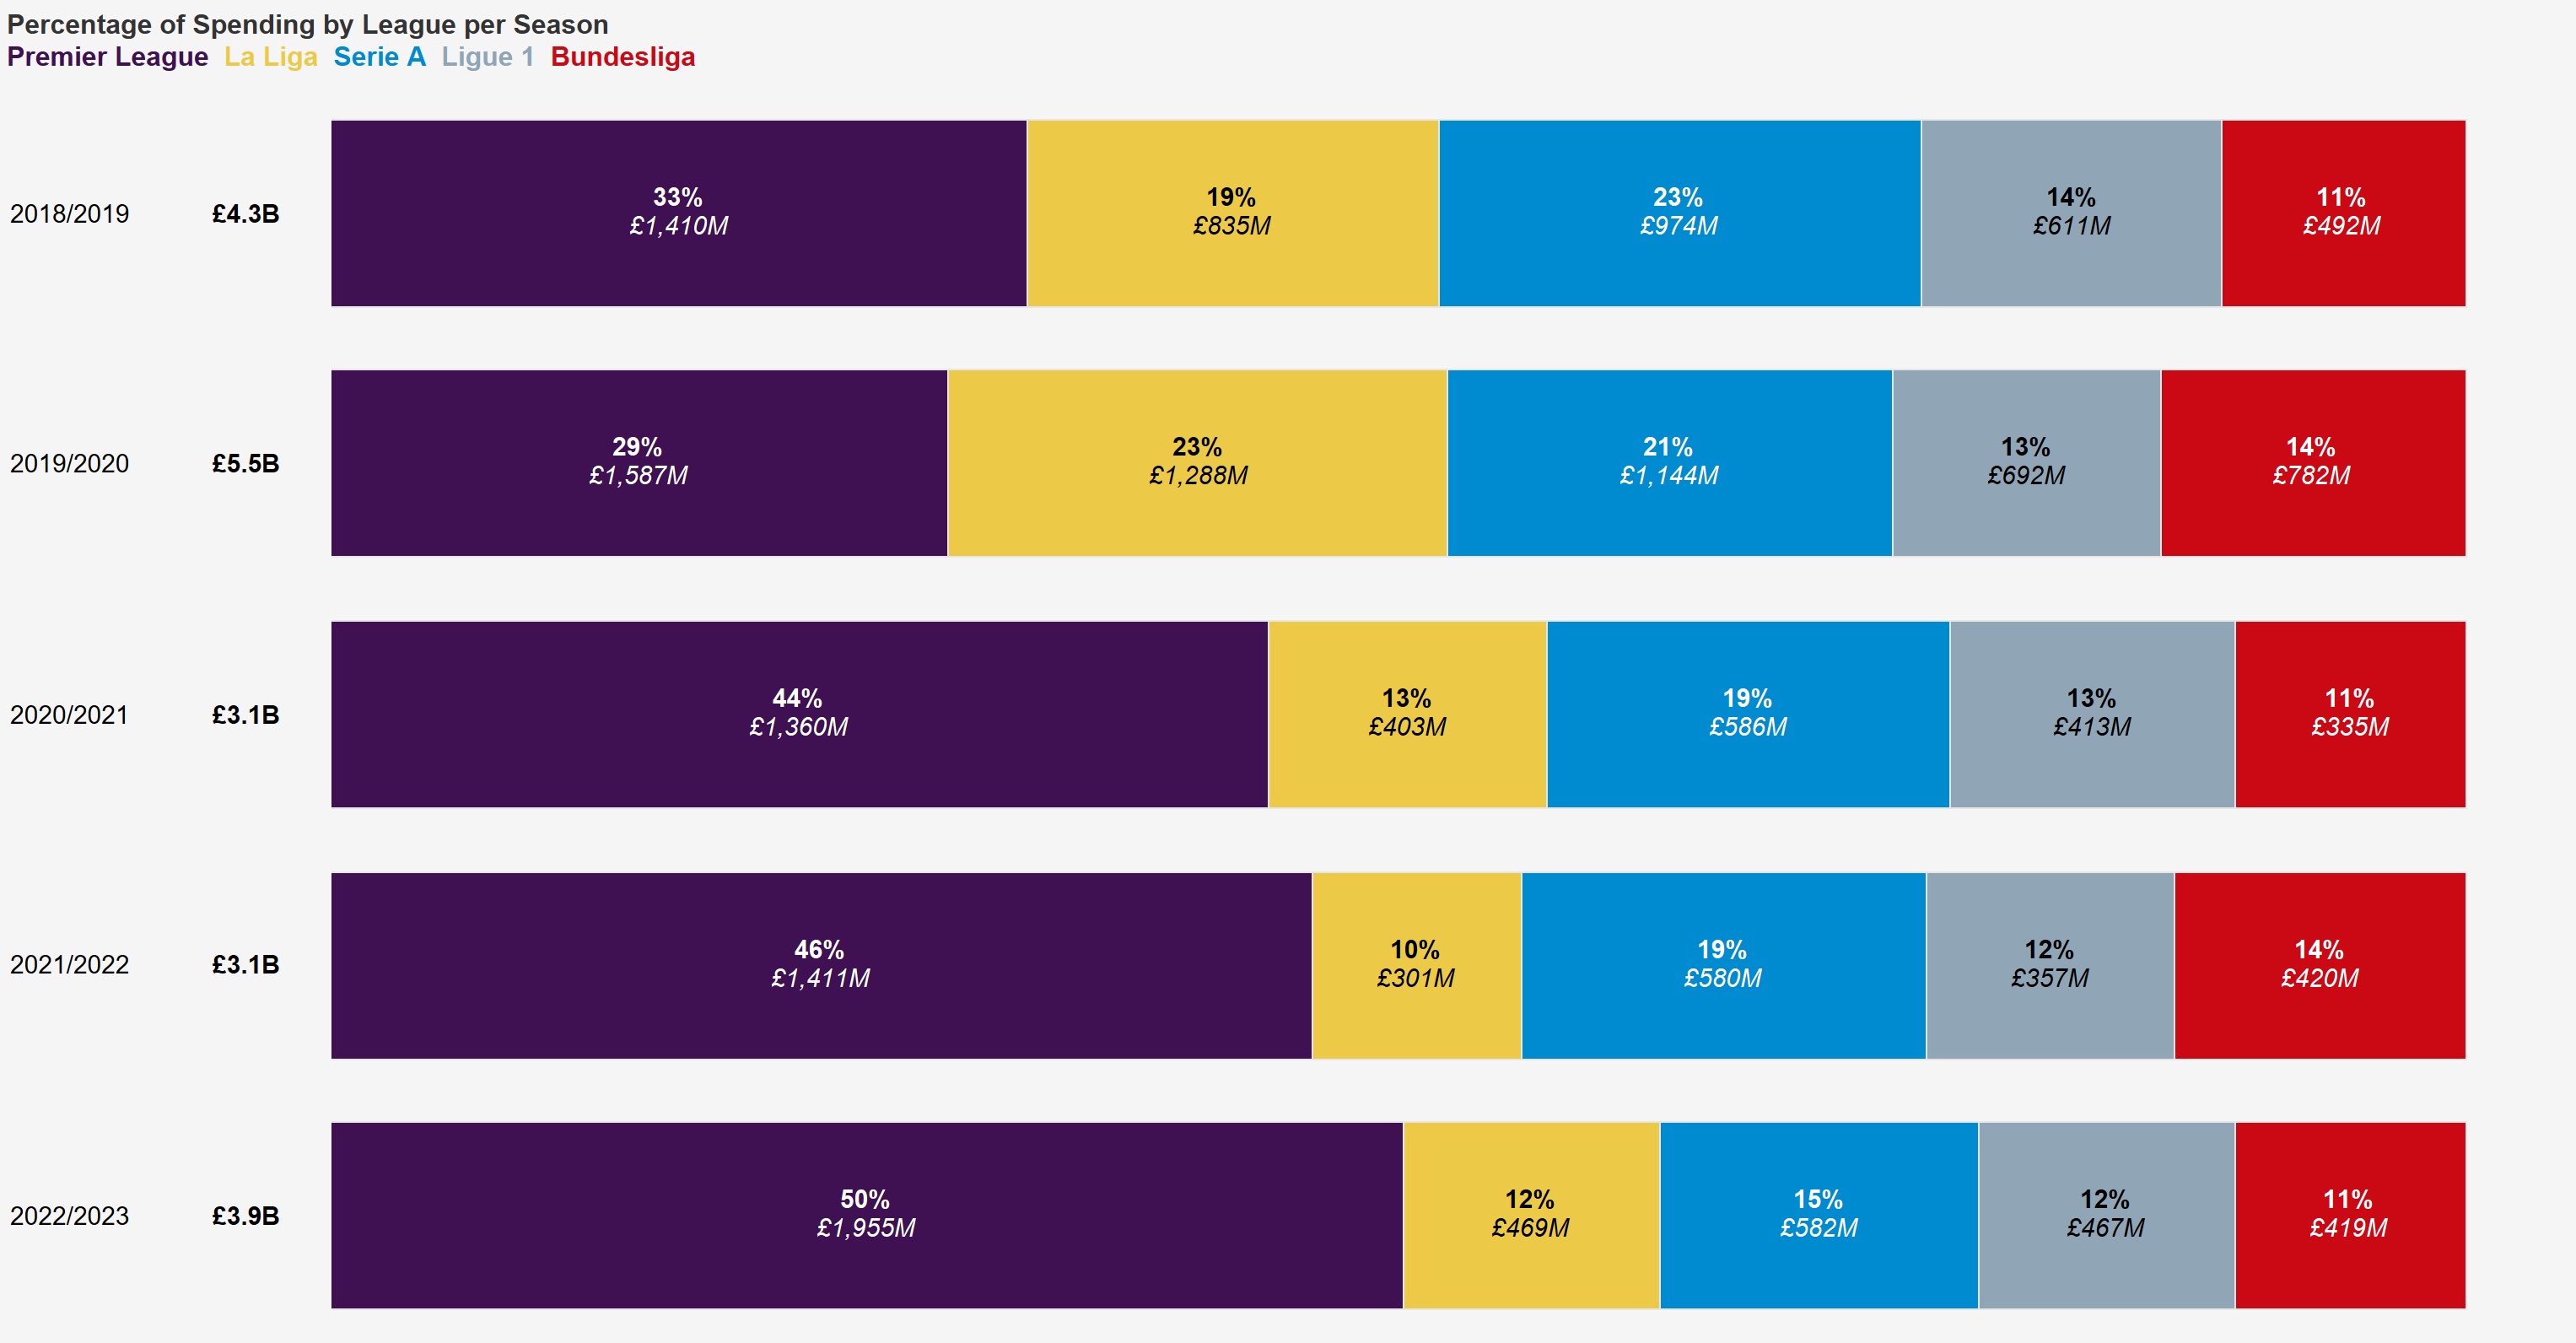
That is the highest percentage it has been in the last five years, over 20% higher than the last pre-pandemic season:
But what about net spend? If we take into account the players that are being sold by these clubs as well, we can get a more fair reflection of true spend of these clubs. Over the last five years, it’s clear to see that Premier League has by far the highest net spend:
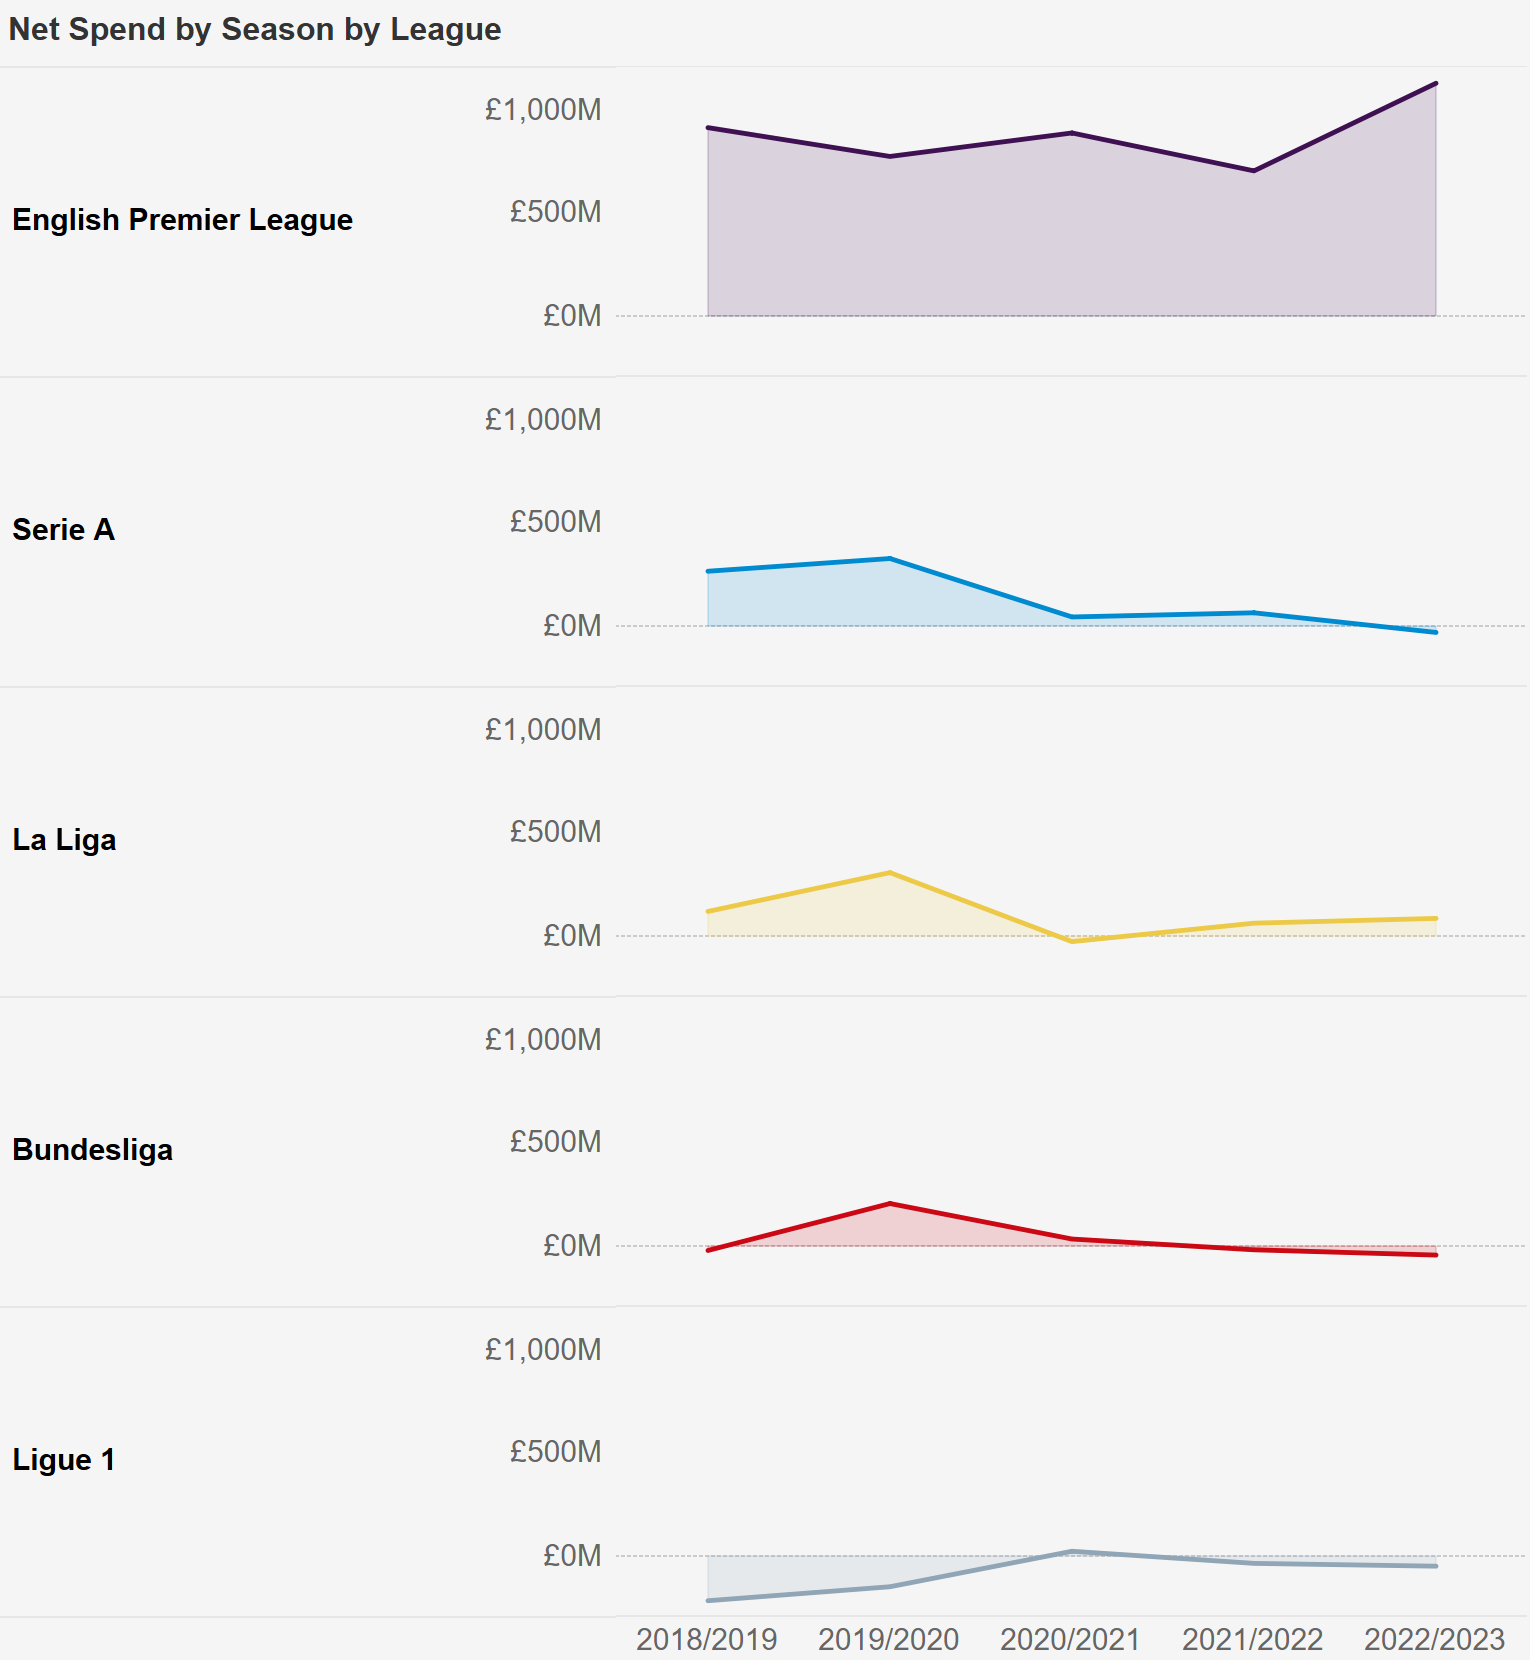
In fact, it’s actually quite difficult to see the trend of other leagues due to high values of the Premier League. However, if we make the axis independent, we can see a big drop off for three of the leagues in ’20-’21 after high spending in the ’19-’20 season:
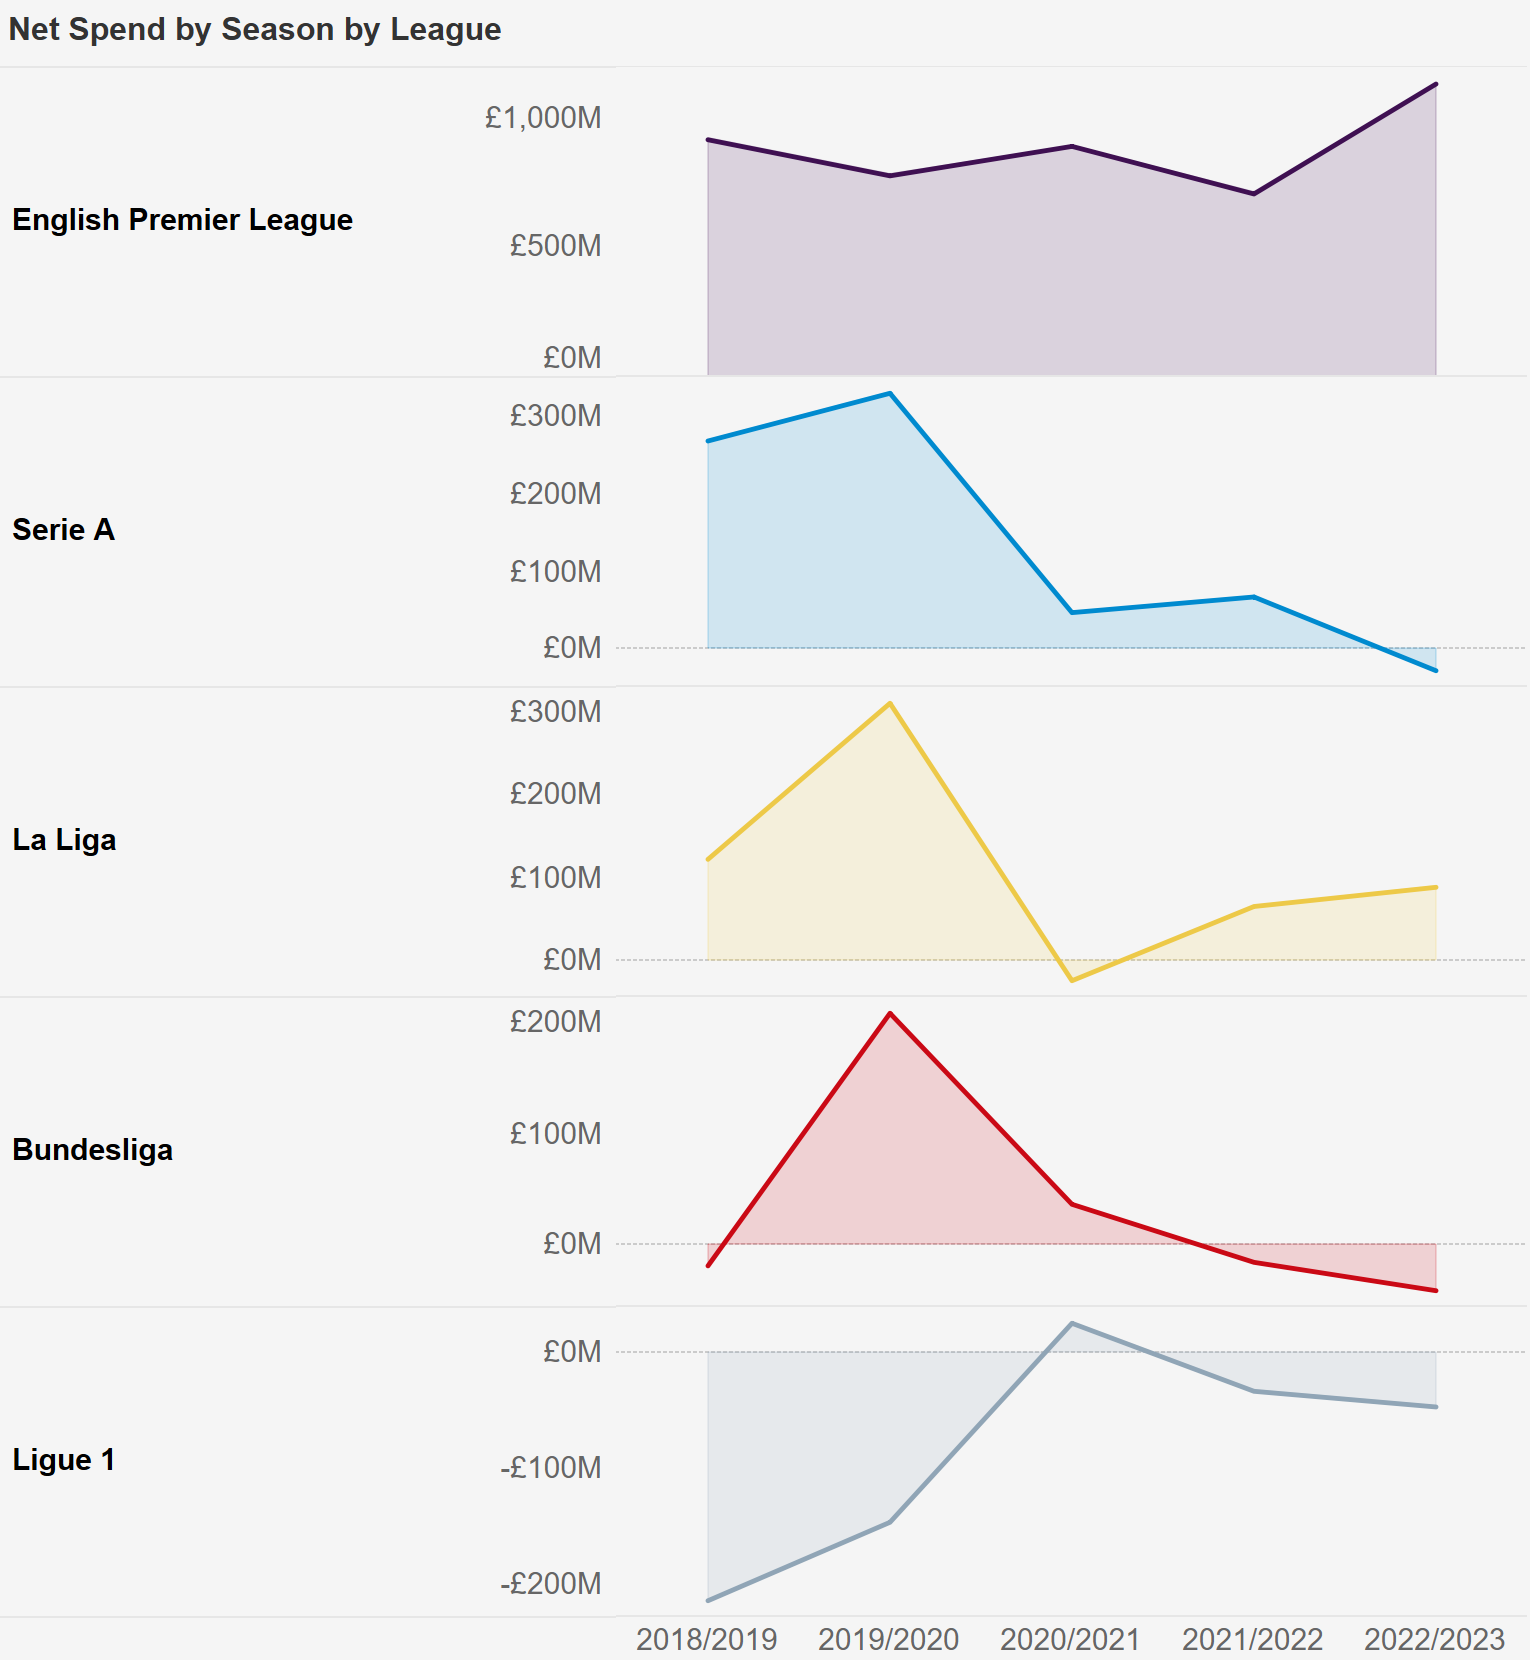
The pandemic effect for the Premier League clubs however seems to far less noticeable, with actually a slight increase in ’20-’21 followed by record highs in ’22-’23 (with a winter transfer window still to come.)
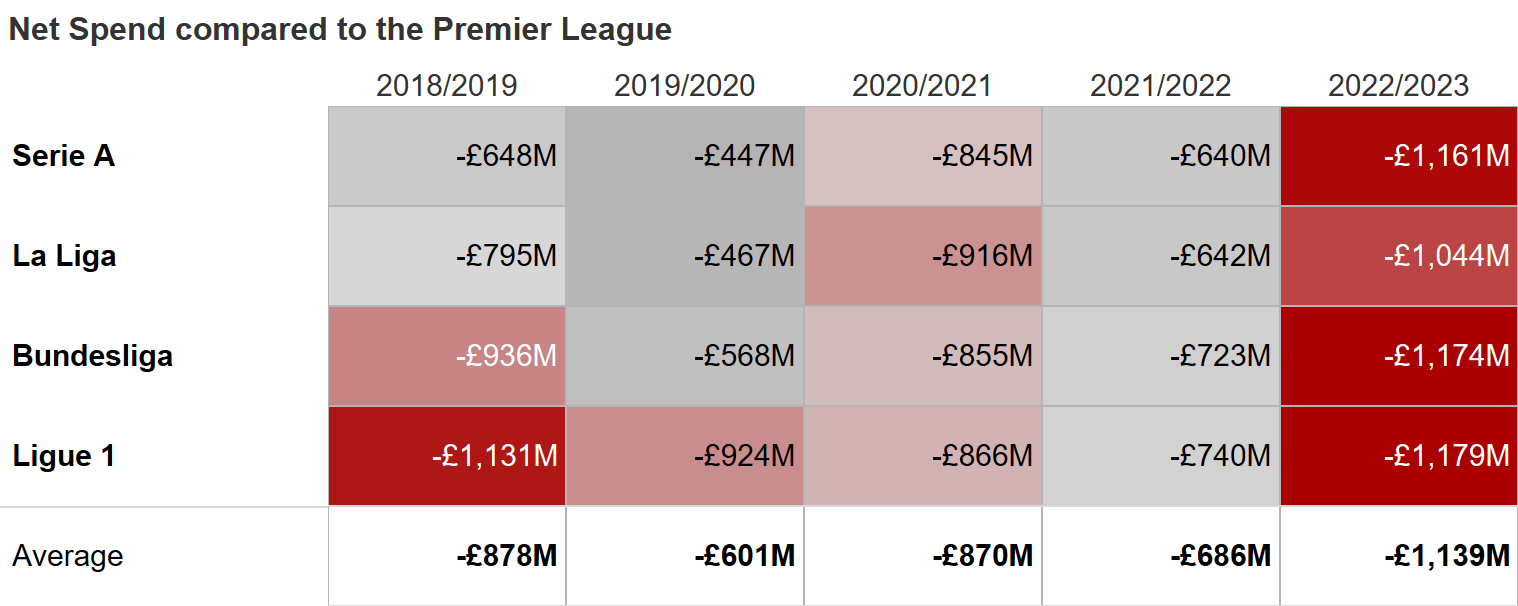
In fact, if we compare each leagues total net spend to the Premier League, there is an average difference of over £1 billion in spend for the latest transfer window. The highest it has been in the last five years, by some distance:
We’ve established that there is big difference in transfer spending by league, but which clubs are driving these numbers? Is it just the big clubs spending money, or is this spend evenly distributed across the leagues?
With each club sorted by the position they finished last season, with promoted clubs getting assigned the last three places based on their finish in the league below, we can get a good idea of who is spending the money:
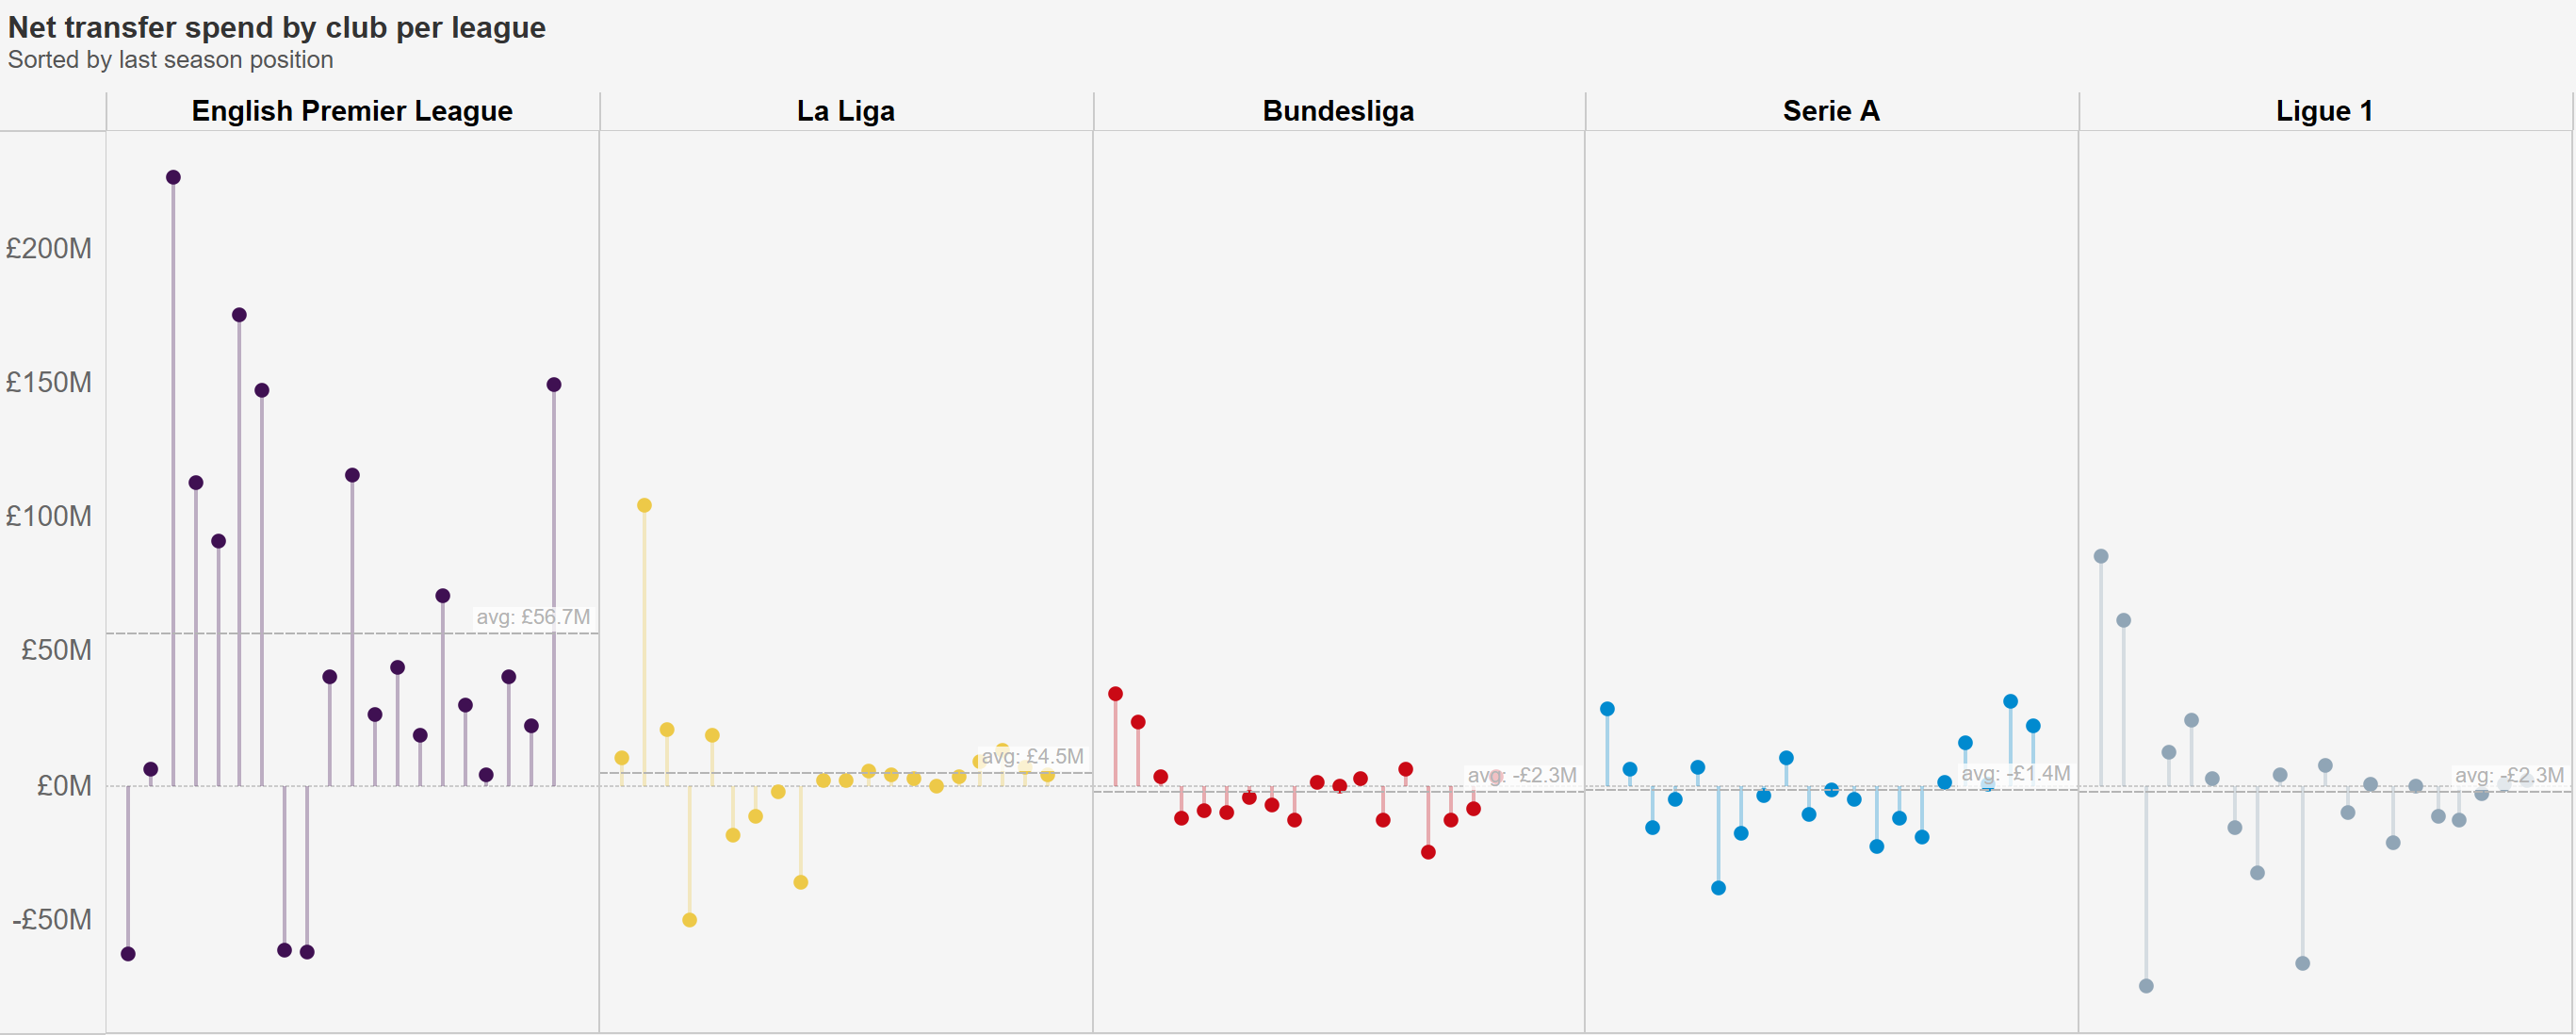
As we can see, in the Premier League, it’s not just the top teams who are spending money. The net spend is quite varied per team, with newly promoted Nottingham Forest rivaling Chelsea and Manchester United as the league’s biggest spenders. There are also interesting trends to see in other leagues. The majority of the spending in La Liga is down to Barcelona, who have a net spend of over £80 million more than anyone else. Whereas in Germany and France, it is the top two teams in each league who are splashing the cash.
One of the consequences of clubs in the rest Europe having less money to spend on transfers is that there is likely going to be less of market for Premier League players who are looking for a move or ones that clubs want to get rid of. This has led to an increasing trend of players moving from one premier league club to another. Nearly £600 million exchanged hands between English clubs in the last transfer window:
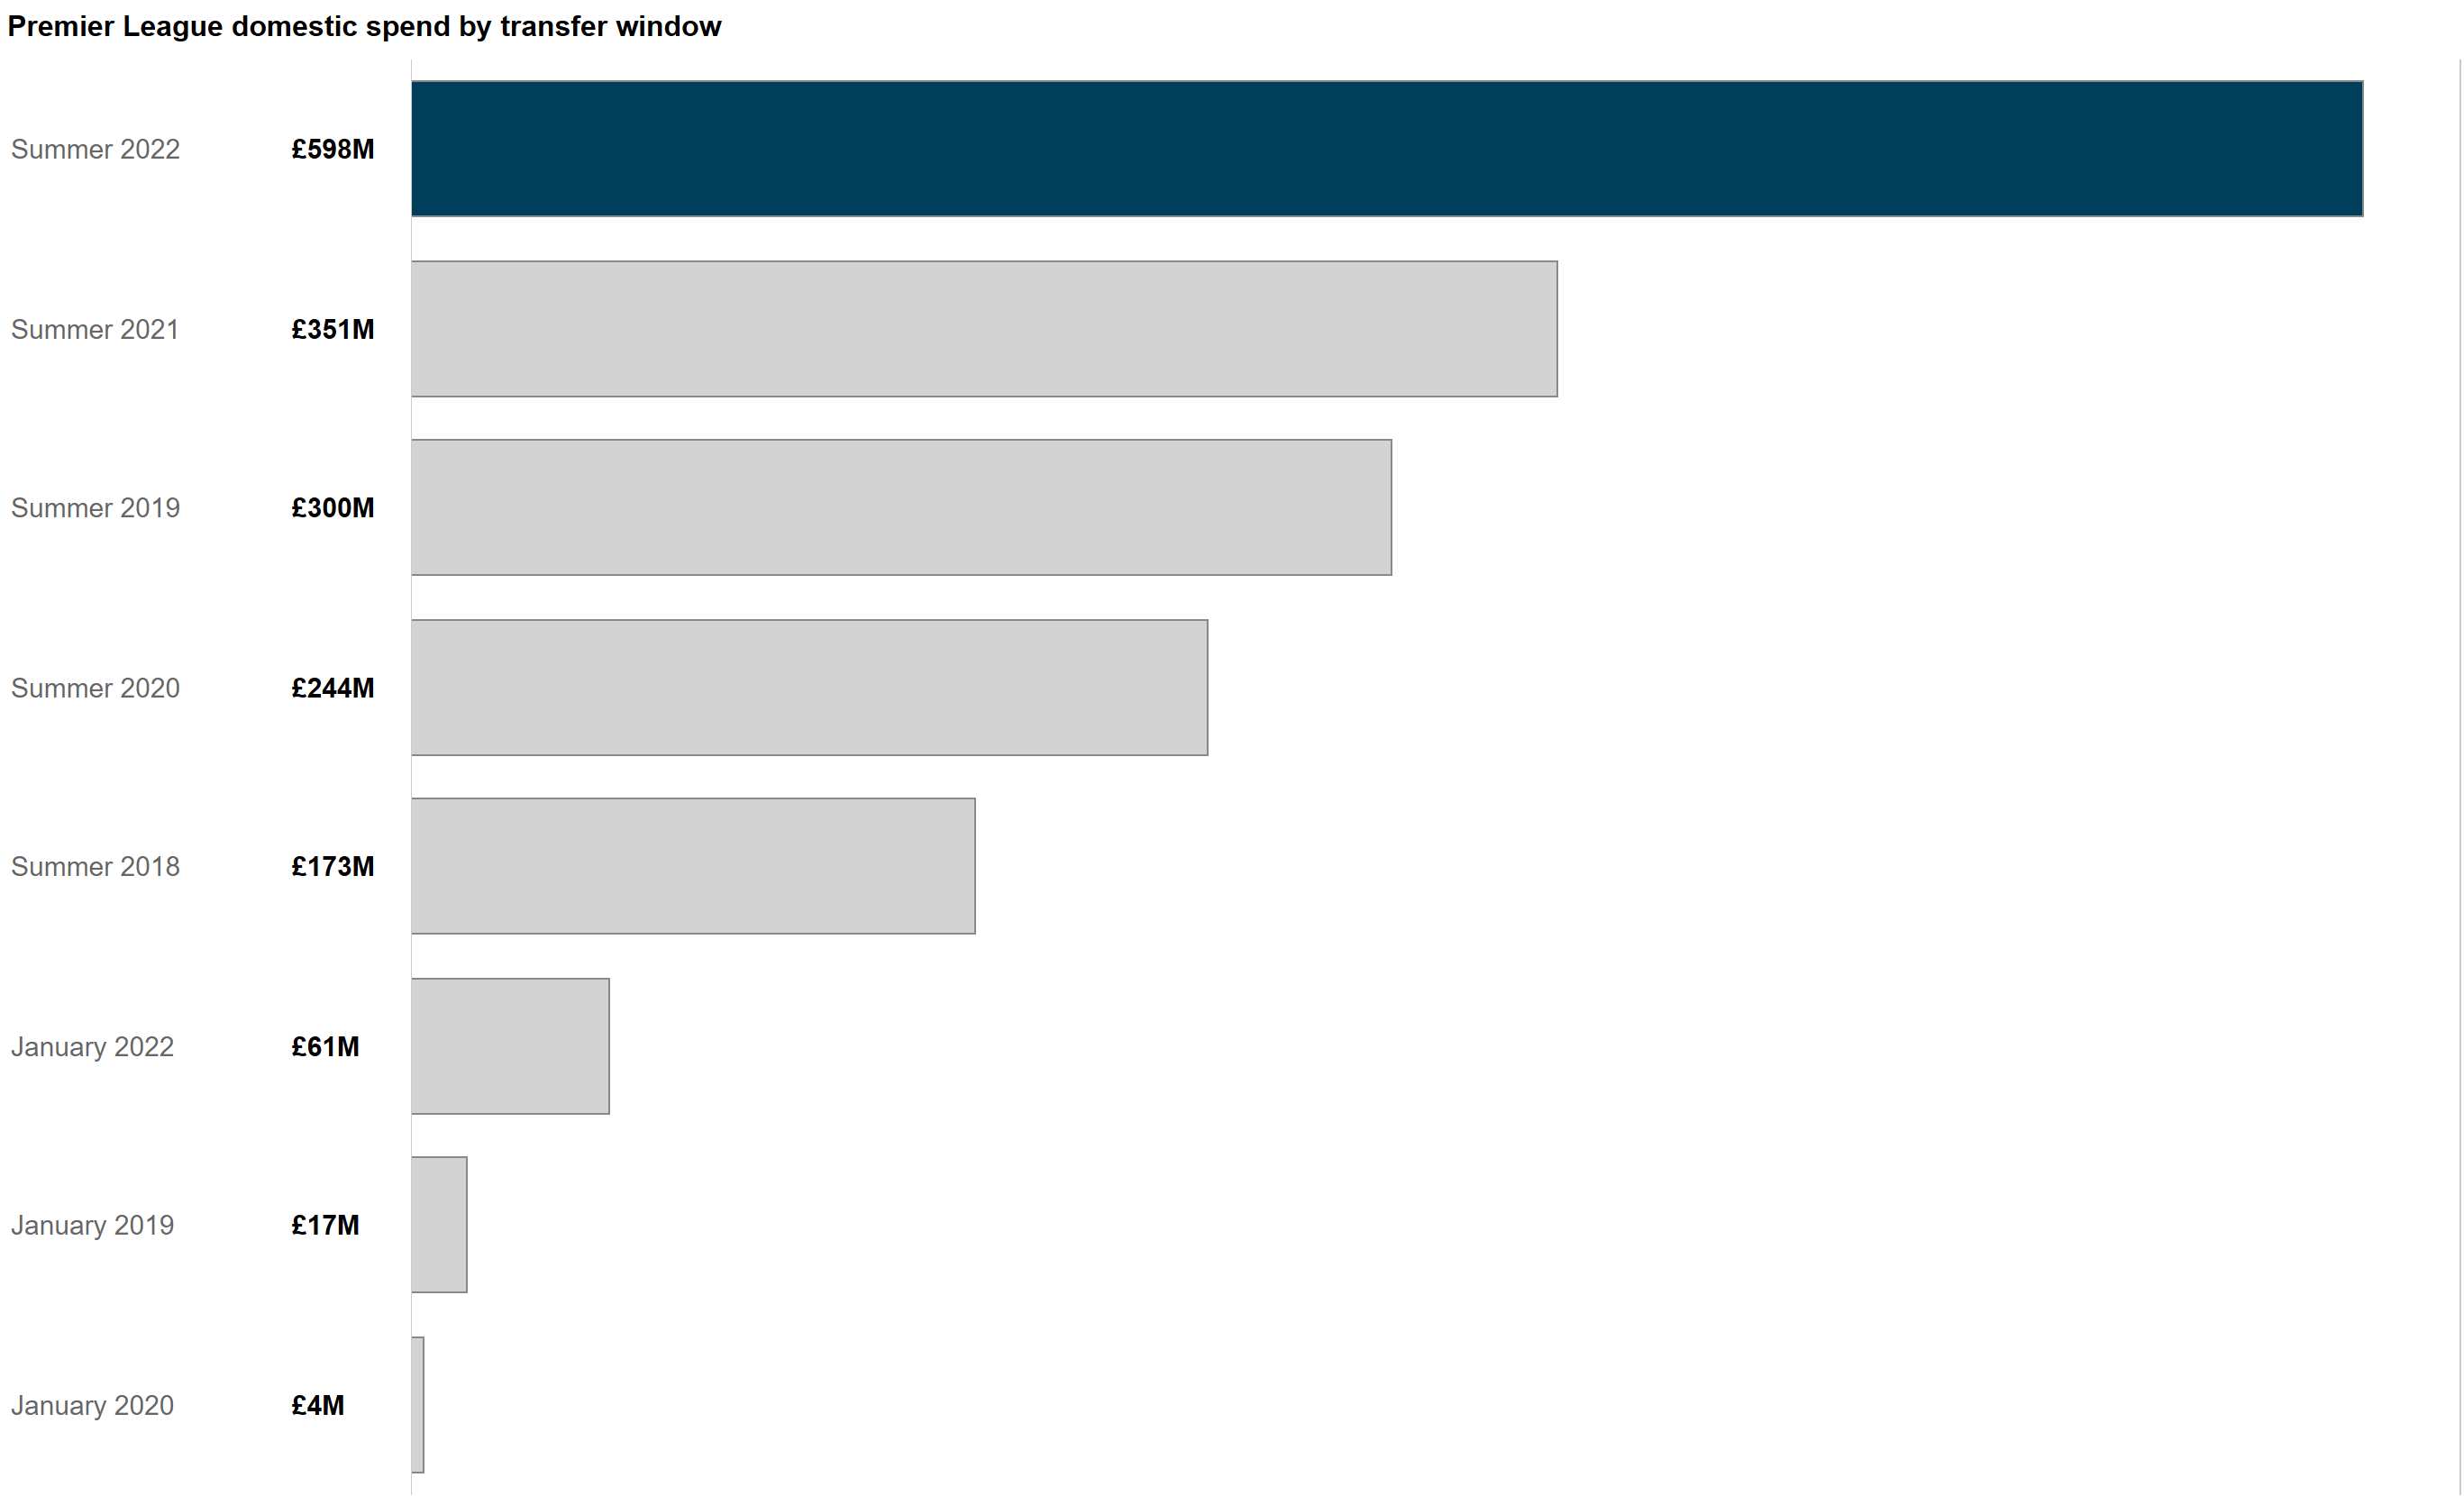
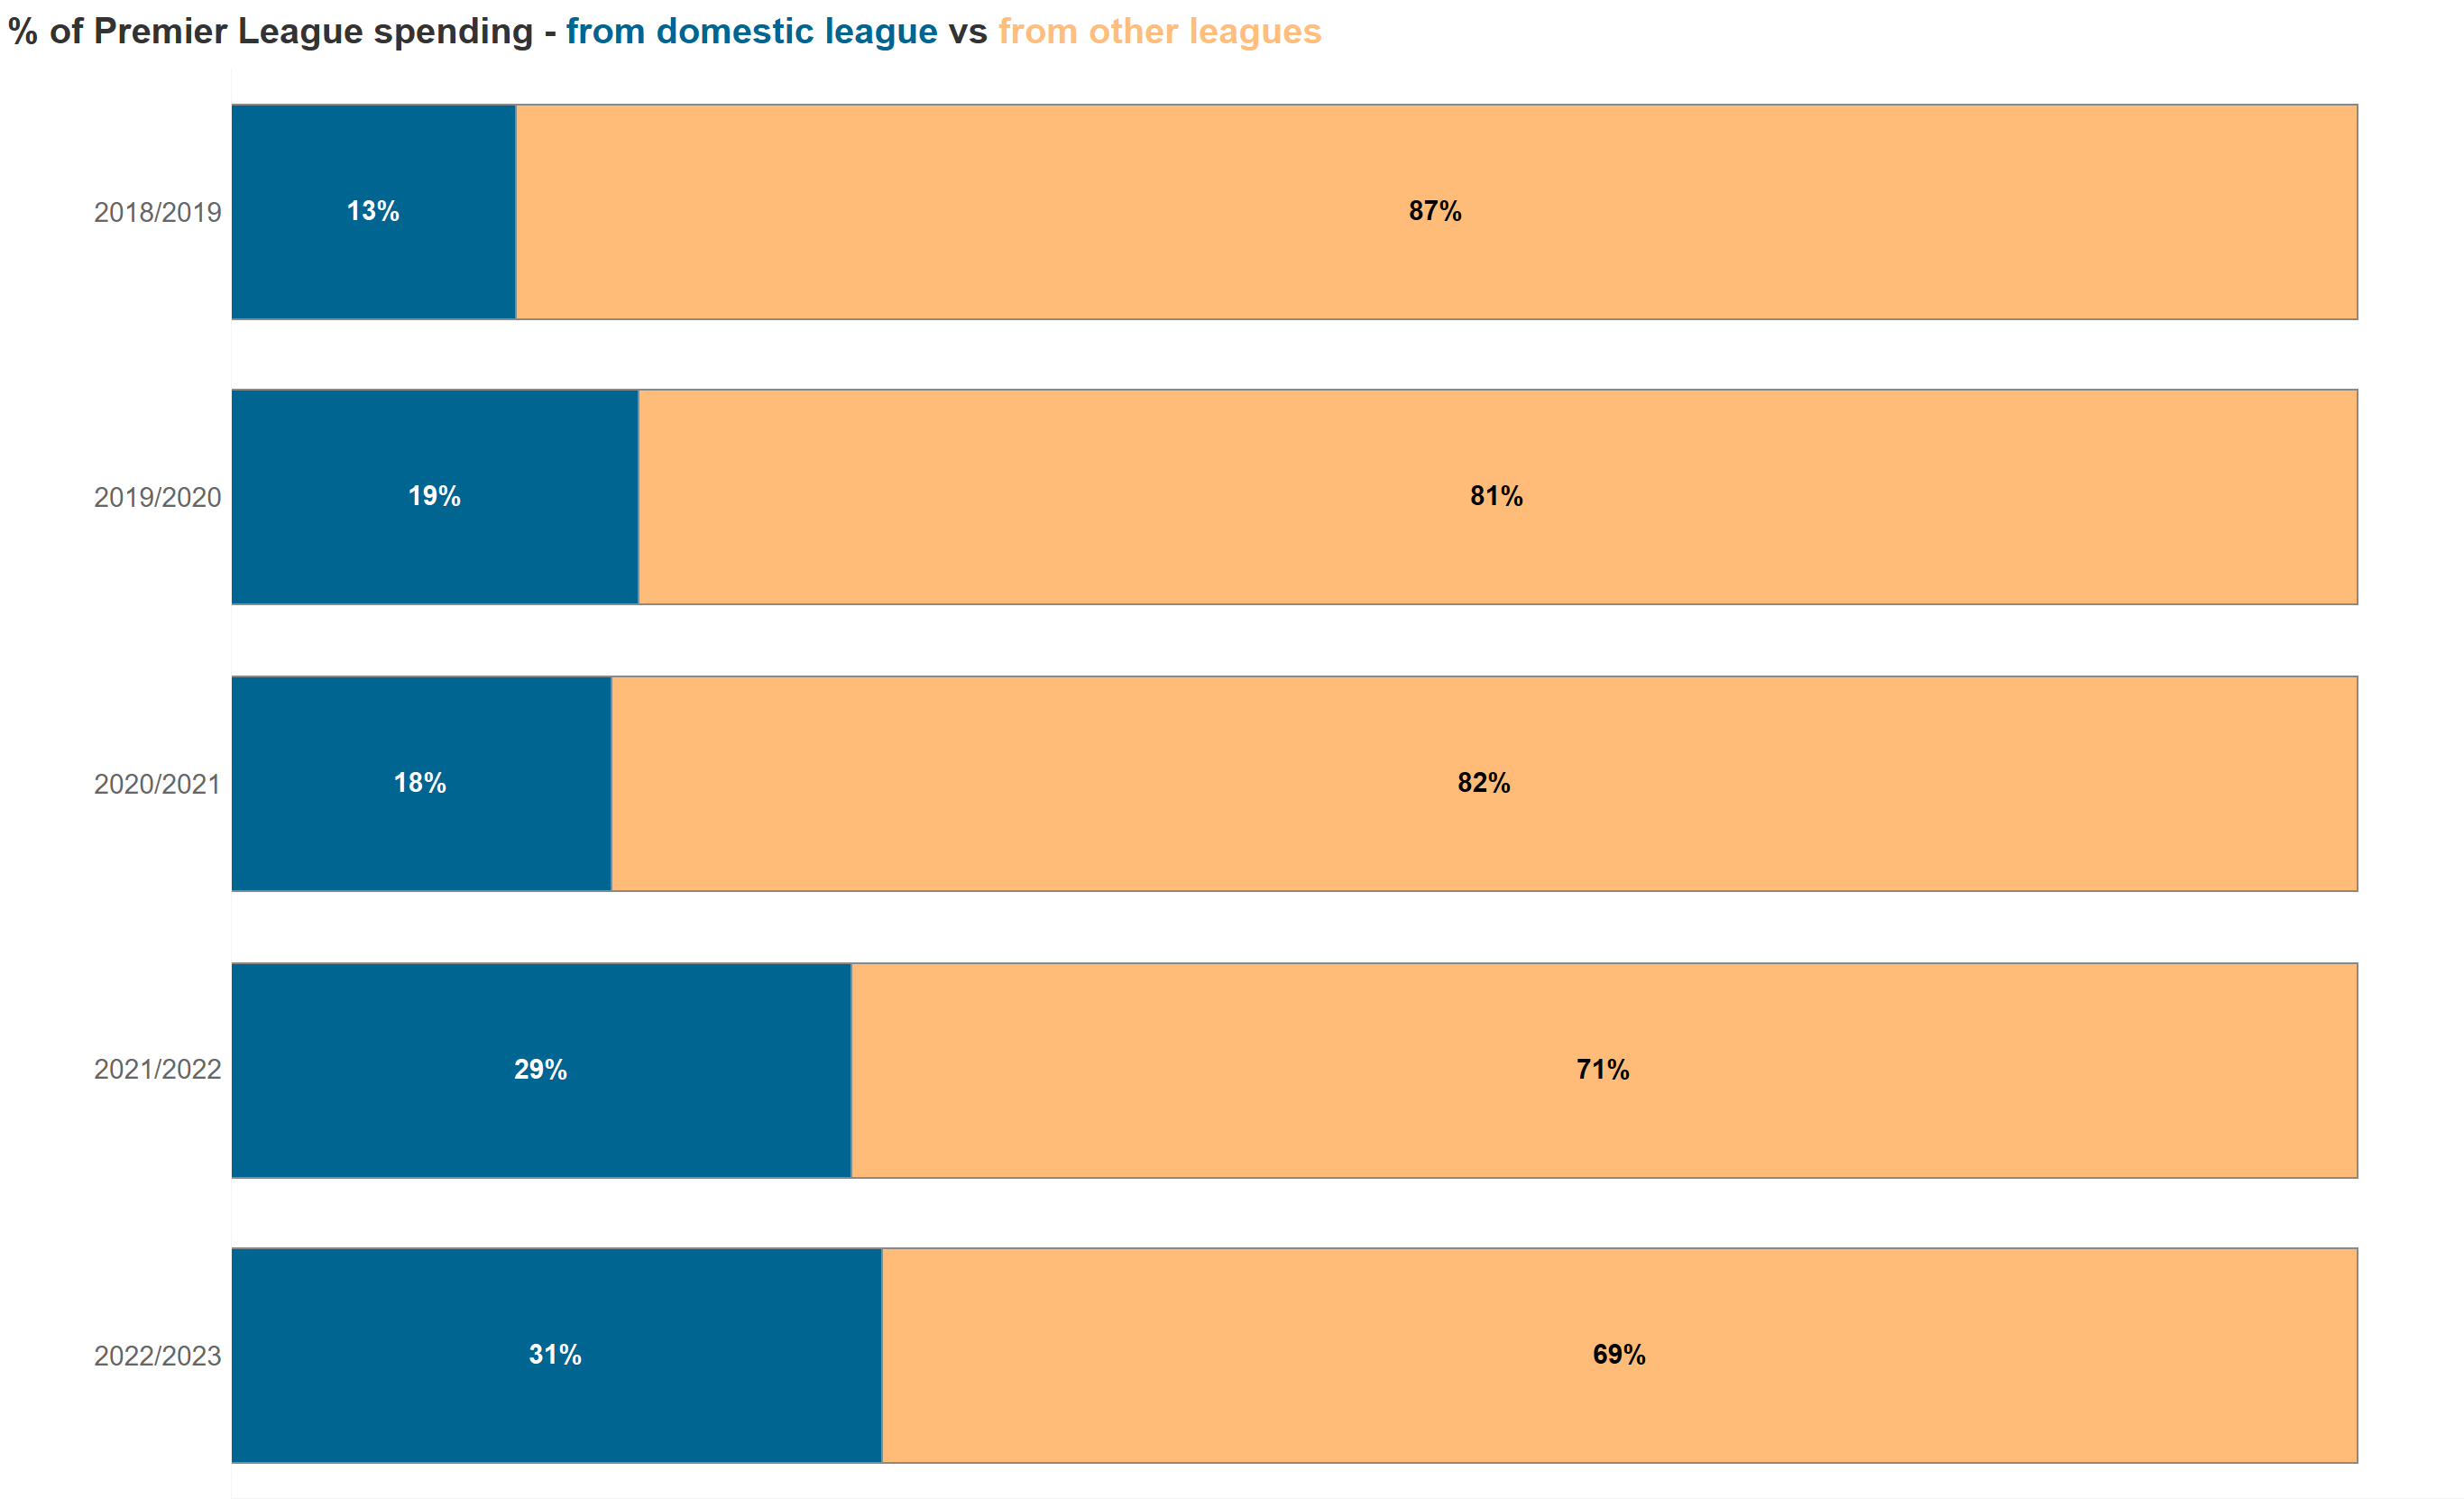
That made up 31% of the total spend, which is again the highest it has been in the last five years.
I’m sure there are a lot more interesting observations to be made from this data set. A dashboard with some of the above charts plus some new ones can be seen below. Feel free to download, have a play round and see if you can pick out any more insights: