Have you ever wondered how Tableau Prep Builder can help your data flow game? I’m a beginner at using Tableau Prep, and I think having a low-fidelity tutorial is the perfect way to help new users understand the platform’s basic of use cases. In this blog, I will cover how to find data and then plug it into Tableau Prep. This is all done on Windows.
Make sure you have Tableau Prep Builder and Tableau Desktop downloaded and your login credentials authenticated!
1. Selecting the Data
Okay! Make sure you download the latest version from Tableau/Salesforce and lets open Tableau Prep Builder. To begin, we need to gather our data. For this type of a project, it requires us to go to a few different data sources to pull data in a couple different date frequencies. What is a data frequency in this context? The bulk of our data comes from St Louis Federal Reserve’s FRED data site.
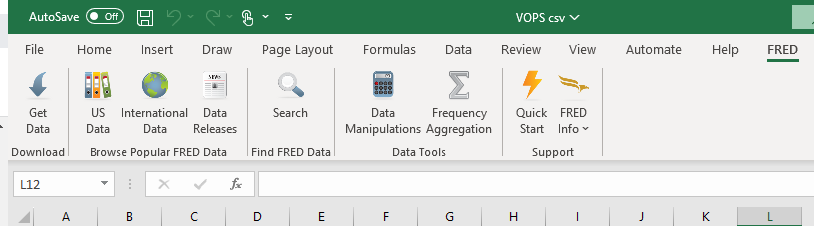
Pro tip: You can also import the data via an Excel FRED plugin tool. FRED allowed me to also pull in the 10 – 2 year Yield Curve, Fed Rate and Unemployment data.
Handy, right? Well, FRED doesn’t give us all the data we need. I also pulled data from third-party sites like multpl.com for historical S&P 500 data. Here are a few great data sources to pull financial data from:
2. Organize Data in Different Excel Sheets
For this project, we want the below datasets:
- S&P – S&P 500 (Monthly)
- GDP – Gross Domestic Product (Quarterly)
- Fed Rate – Federal Reserve Interest Rate (Weekly)
- CPI – Core Price Index (Monthly)
- T10Y2Y – Yield Curve (Work Days)
- Unemployment – Unemployment Rate (Monthly)
Make sure all the data columns get downloaded in the same Excel file but in different Excel sheets. Copy and paste the data as needed from the downloaded content. Having the data in separate sheets will help us separate and parse it when we move to Tableau Prep.
Obviously, there’s a lot of data sources, with several layers of data parsing. This is where Tableau Prep can help us align disparate dates that would otherwise be nasty to deal with in native Tableau Desktop. But first, let’s go see how “nasty” it can get …
A Word of Caution on Using Tableau Desktop for This
Now, there’s a way to replicate this dashboarding project WITHOUT Tableau Prep, but who wants that?! Let’s see some of the negative effects of doing this in Tableau Desktop. See them below:
- Your “date” data sources will look like a hot mess.
- It prevents us from experiencing the wonders of Tableau Prep.
- Long term negative effects on date data continuity. This will result in missing data points in Tableau visualizations due to the unalignment in date structuring.
If you do it in the Tableau “data source,” it would look something like this:
Do you notice how messy your date partitions look now? There are too many date versions to manage and many of them can turn into ‘nulls’ when used. YUCK. Let’s move over Tableau Prep.
3. Explore Importing and Doing the Full Joins
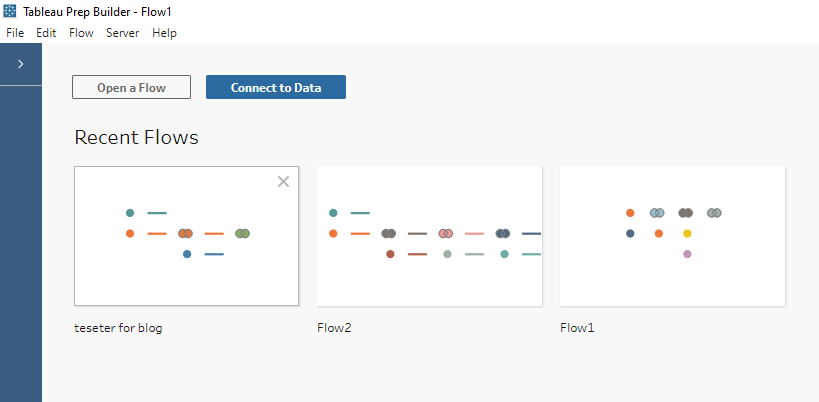
Let’s open Tableau Prep and connect to your Excel file.
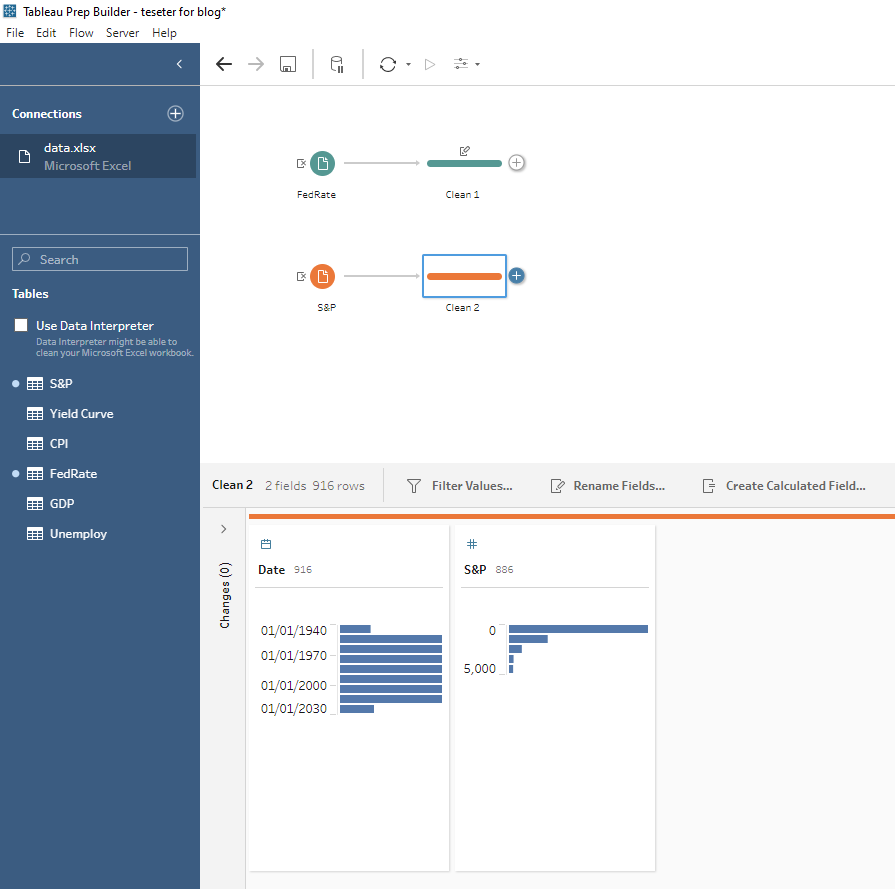
Drag and drop two sheets from the left and add in “cleaning steps” after each.
It’s important to always place a “cleaning step” after every data table and join.
Even if you don’t need it now, it’s important for future data work that might be needed later.
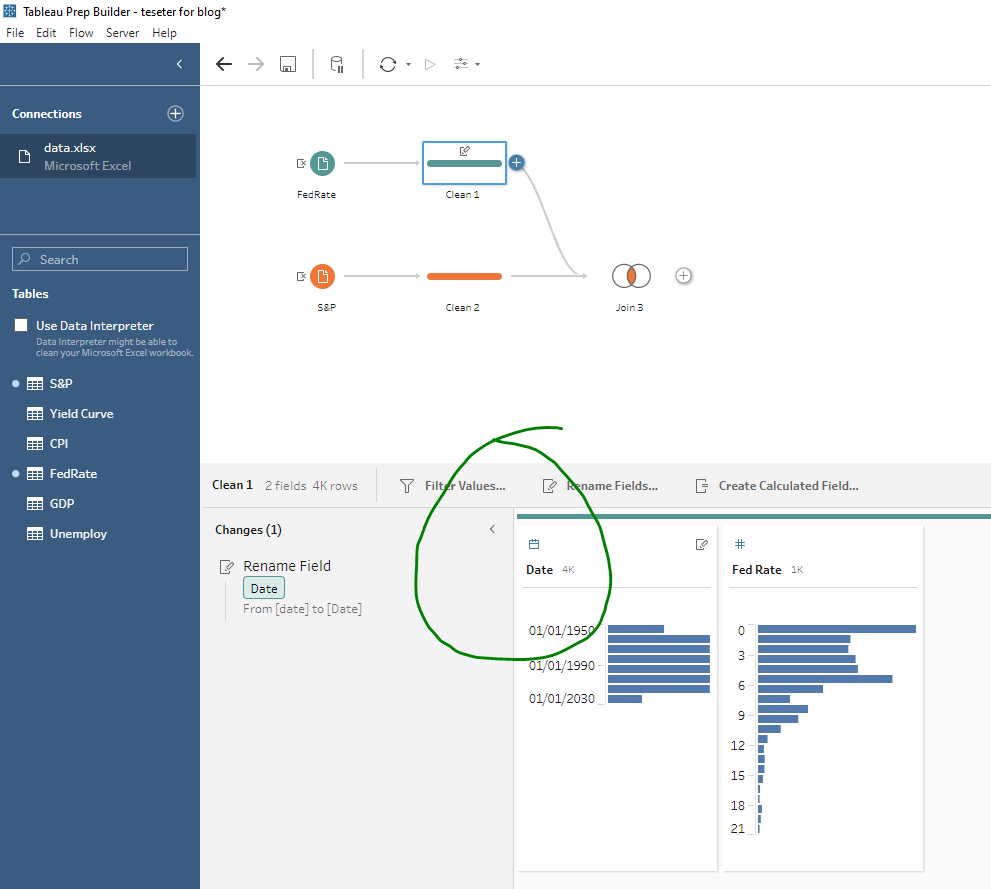
Next, let’s make sure every date field is renamed to match each other, in this case “date” => “Date.” Also, lets place a join between the two cleaning steps!
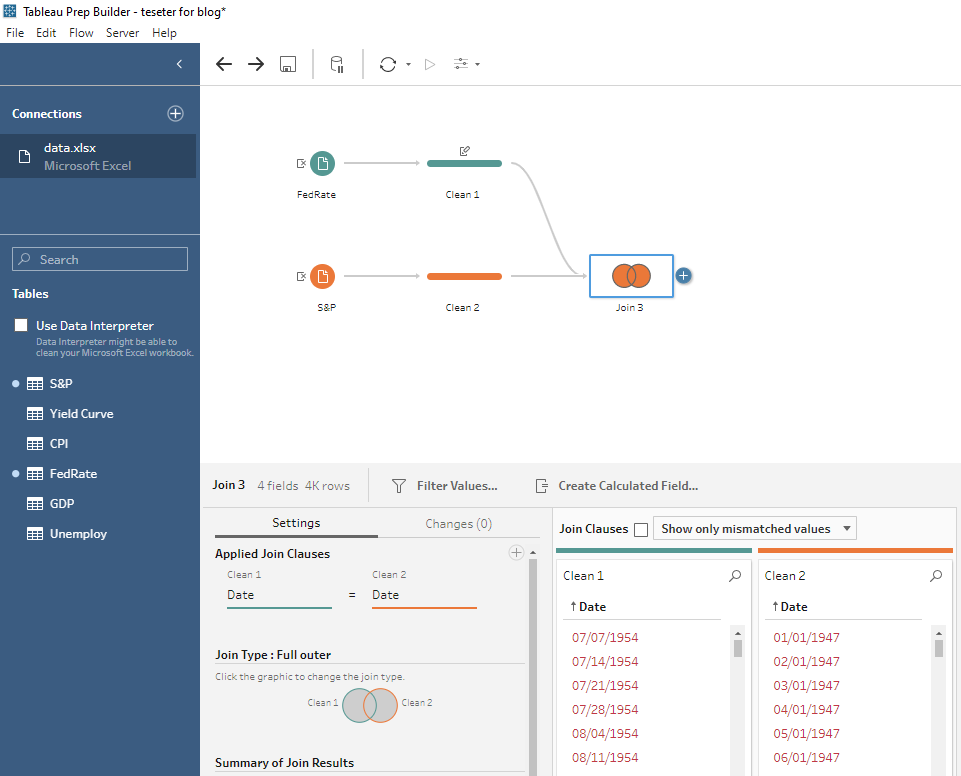
Edit the join criteria to be a Full Outer Join. Full Outer Join is used to keep all date listings including duplicates.
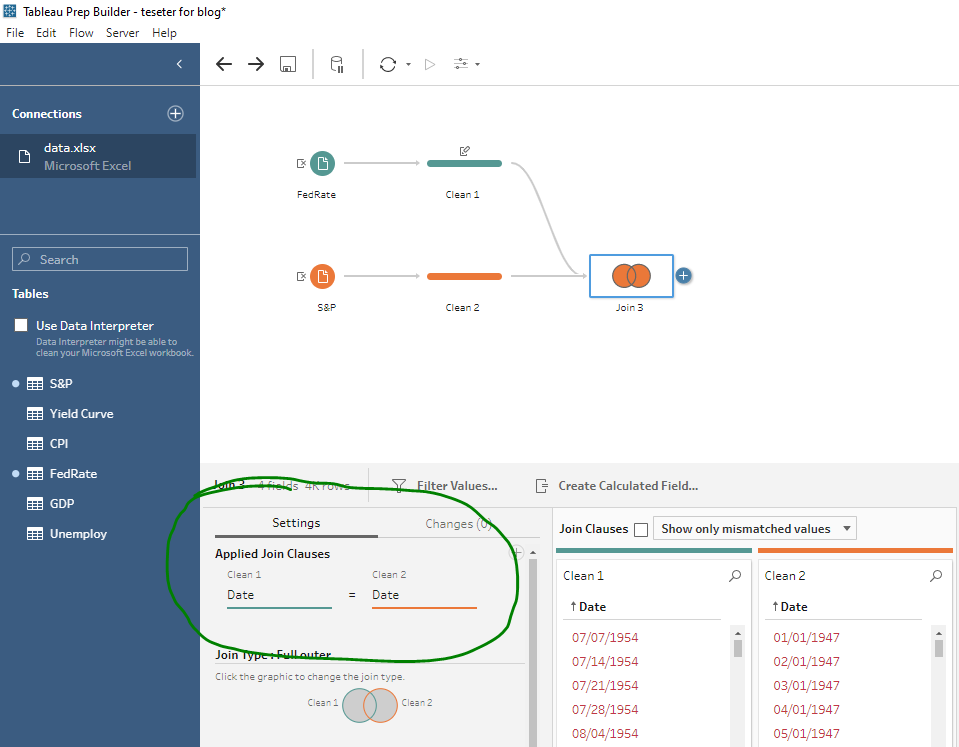
Next, make sure the “Applied Join Clauses” matches up with the “Date” fields.
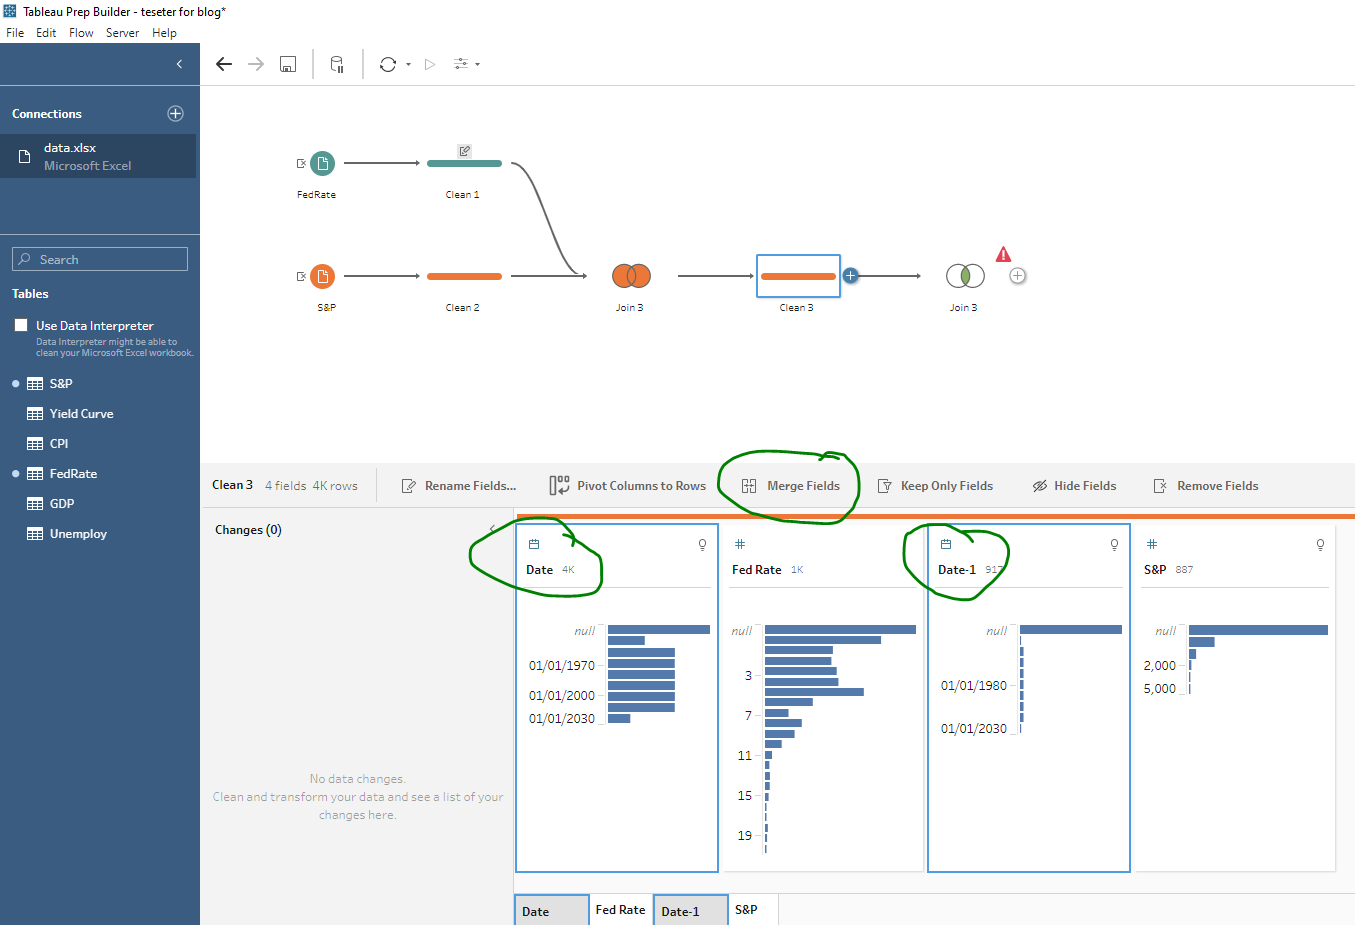
Now, let’s merge the two date fields in a cleaning step by clicking each while clicking ctrl. Also make sure to rename the date field “Date.”
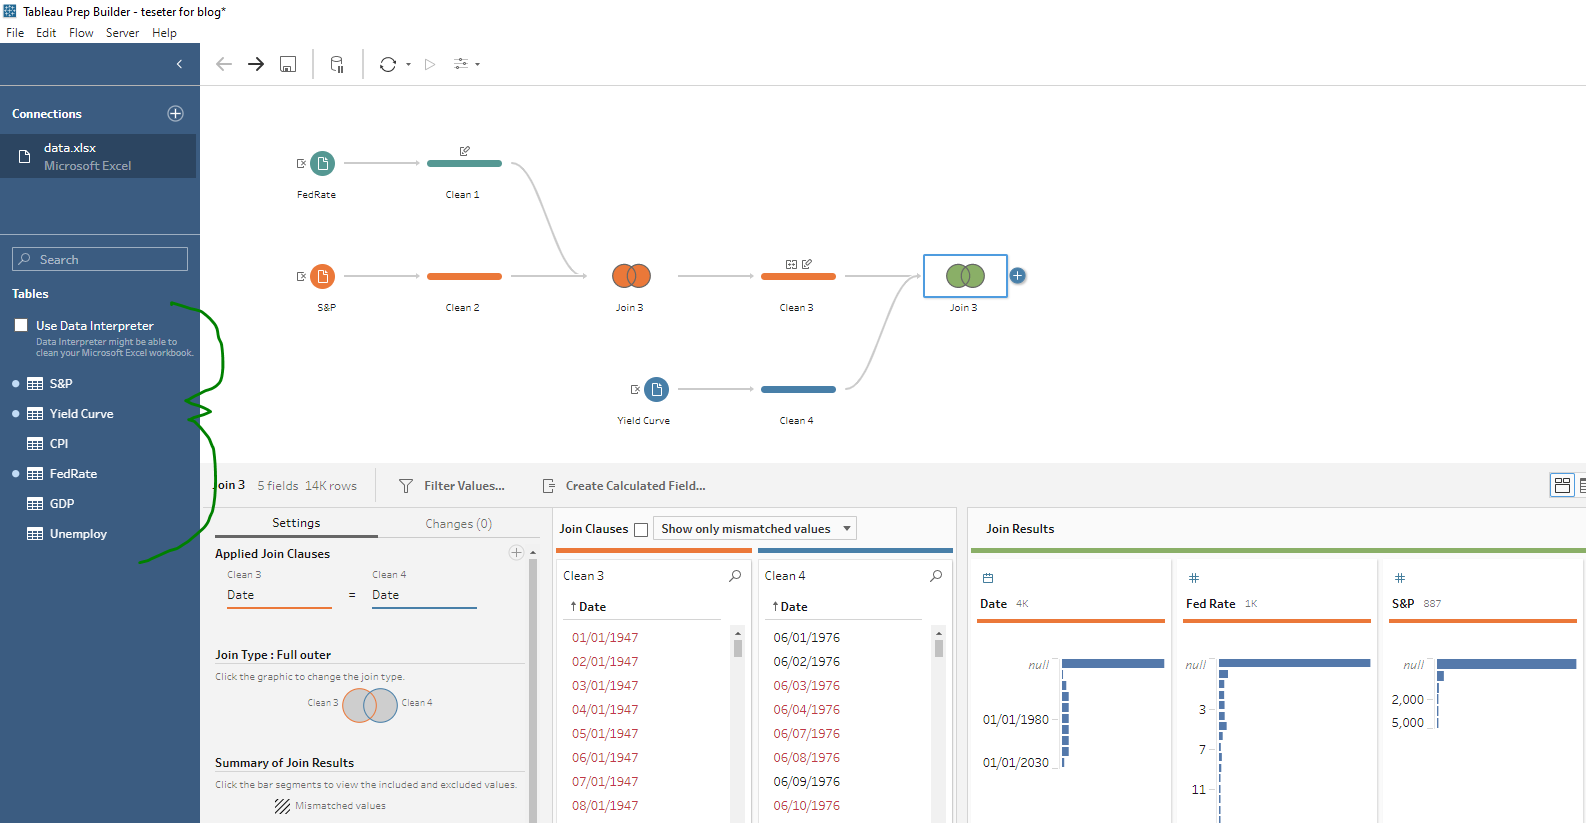
Repeat the steps repeatedly until you’ve included all of the Excel tabs.
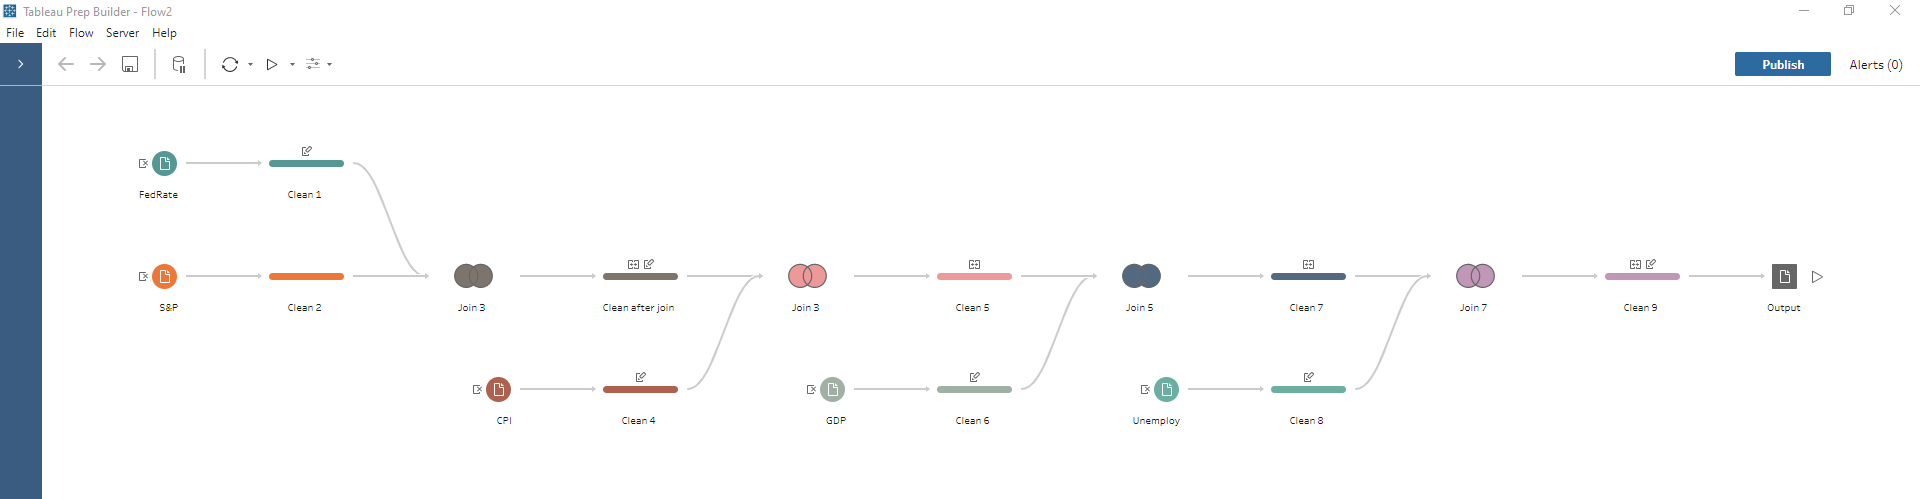
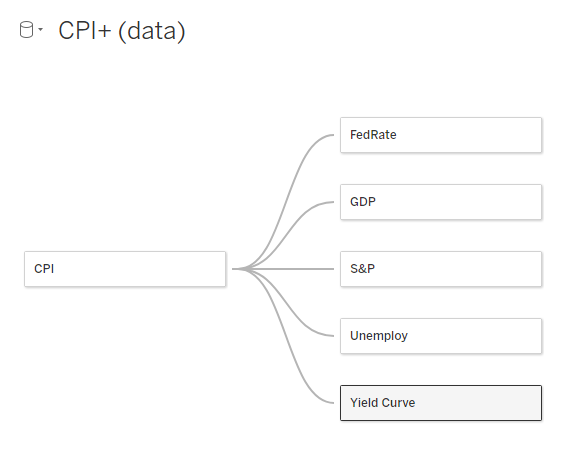
Your colors don’t have to line up exactly like mine, but your Prep should look something like this!
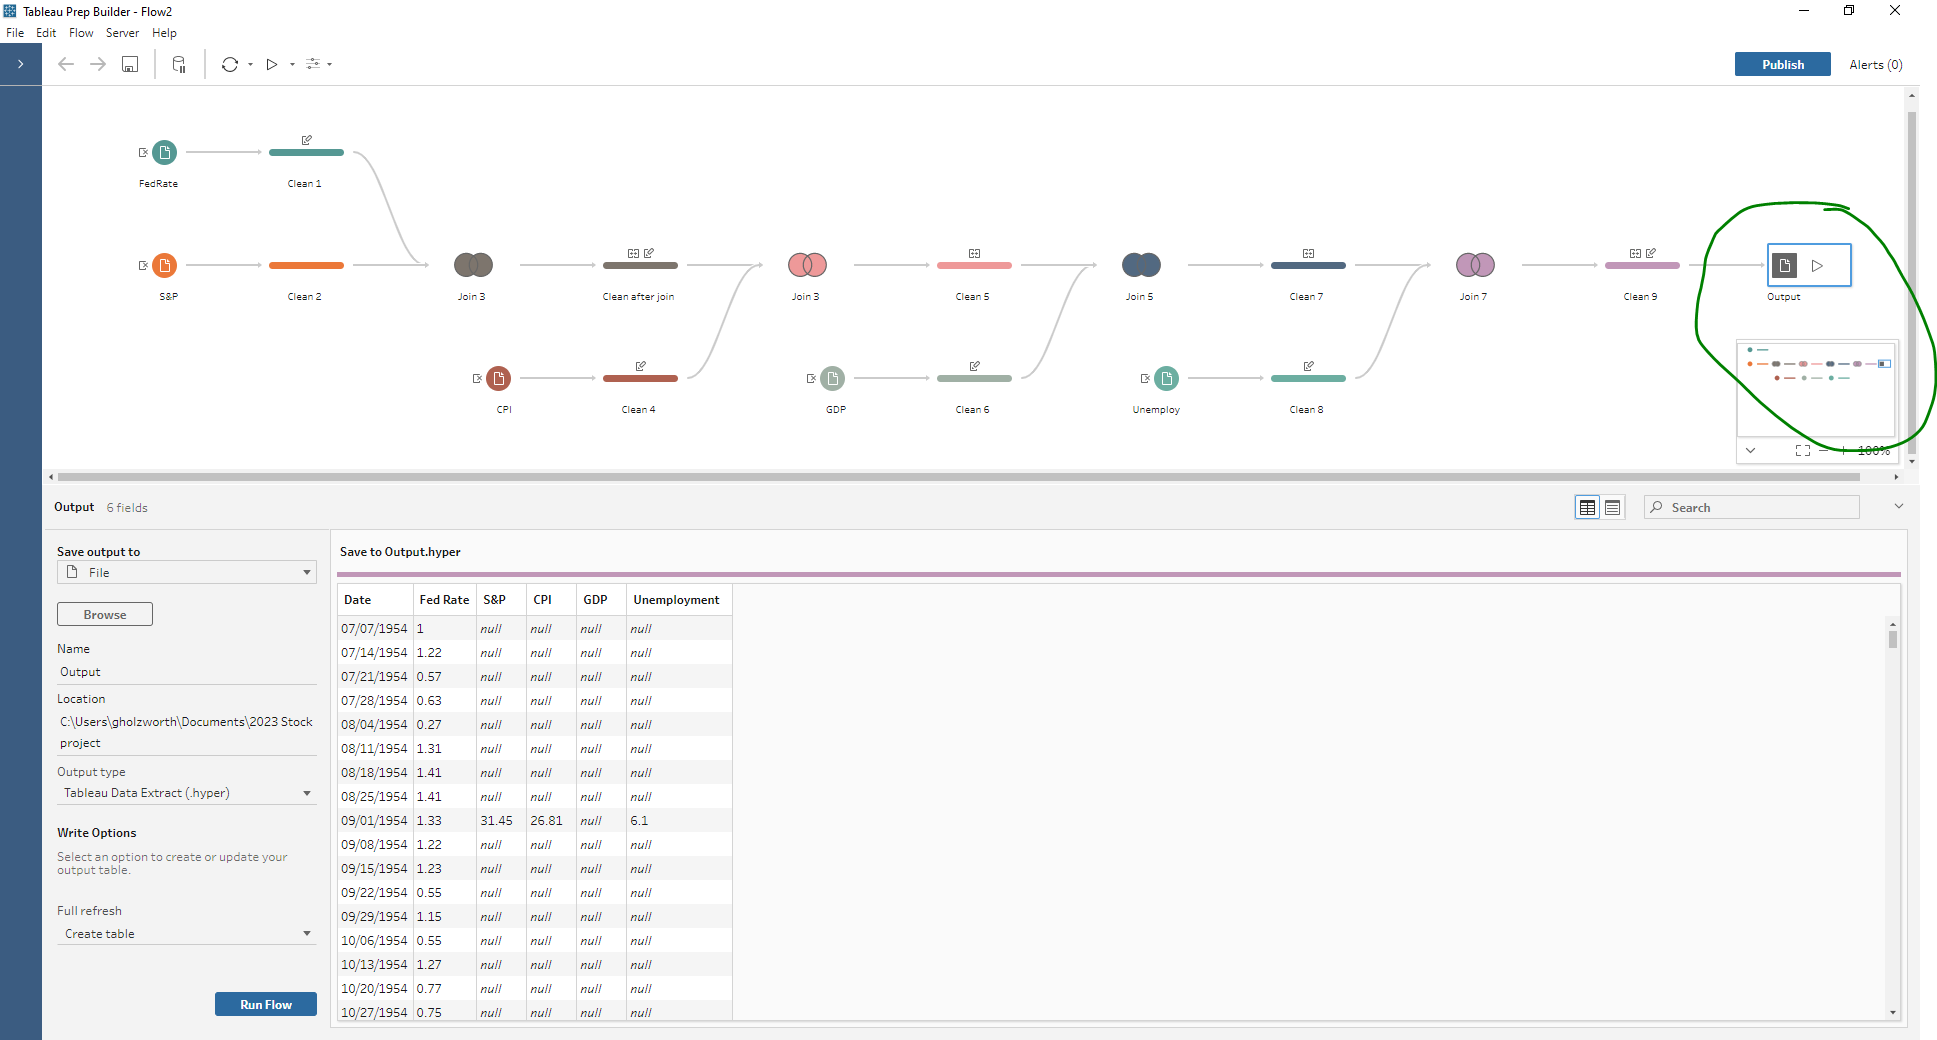
Finally let’s click the + on the end of our flow to add in an “Output.” Look at the bottom-left and choose “Hyper” file. Pick a file location you will remember!
Congrats. You’ve created a Hyper file that synchronizes all of the date fields for our stock data. Let’s use it!
3. Go into Output and Create a Hyper File
Hyper files are unique to the Tableau ecosystem. Per the Tableau website:
“Hyper is Tableau’s in-memory Data Engine technology optimized for fast data ingest and analytical query processing on large or complex data sets.”
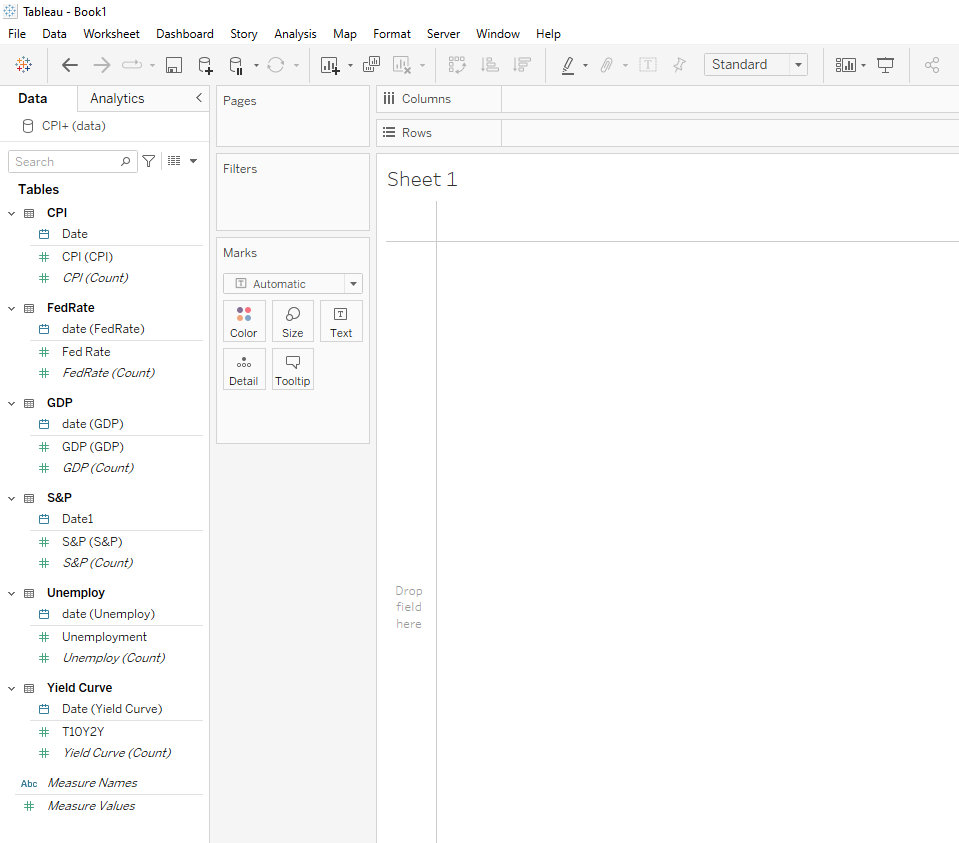
5. Connect to Tableau
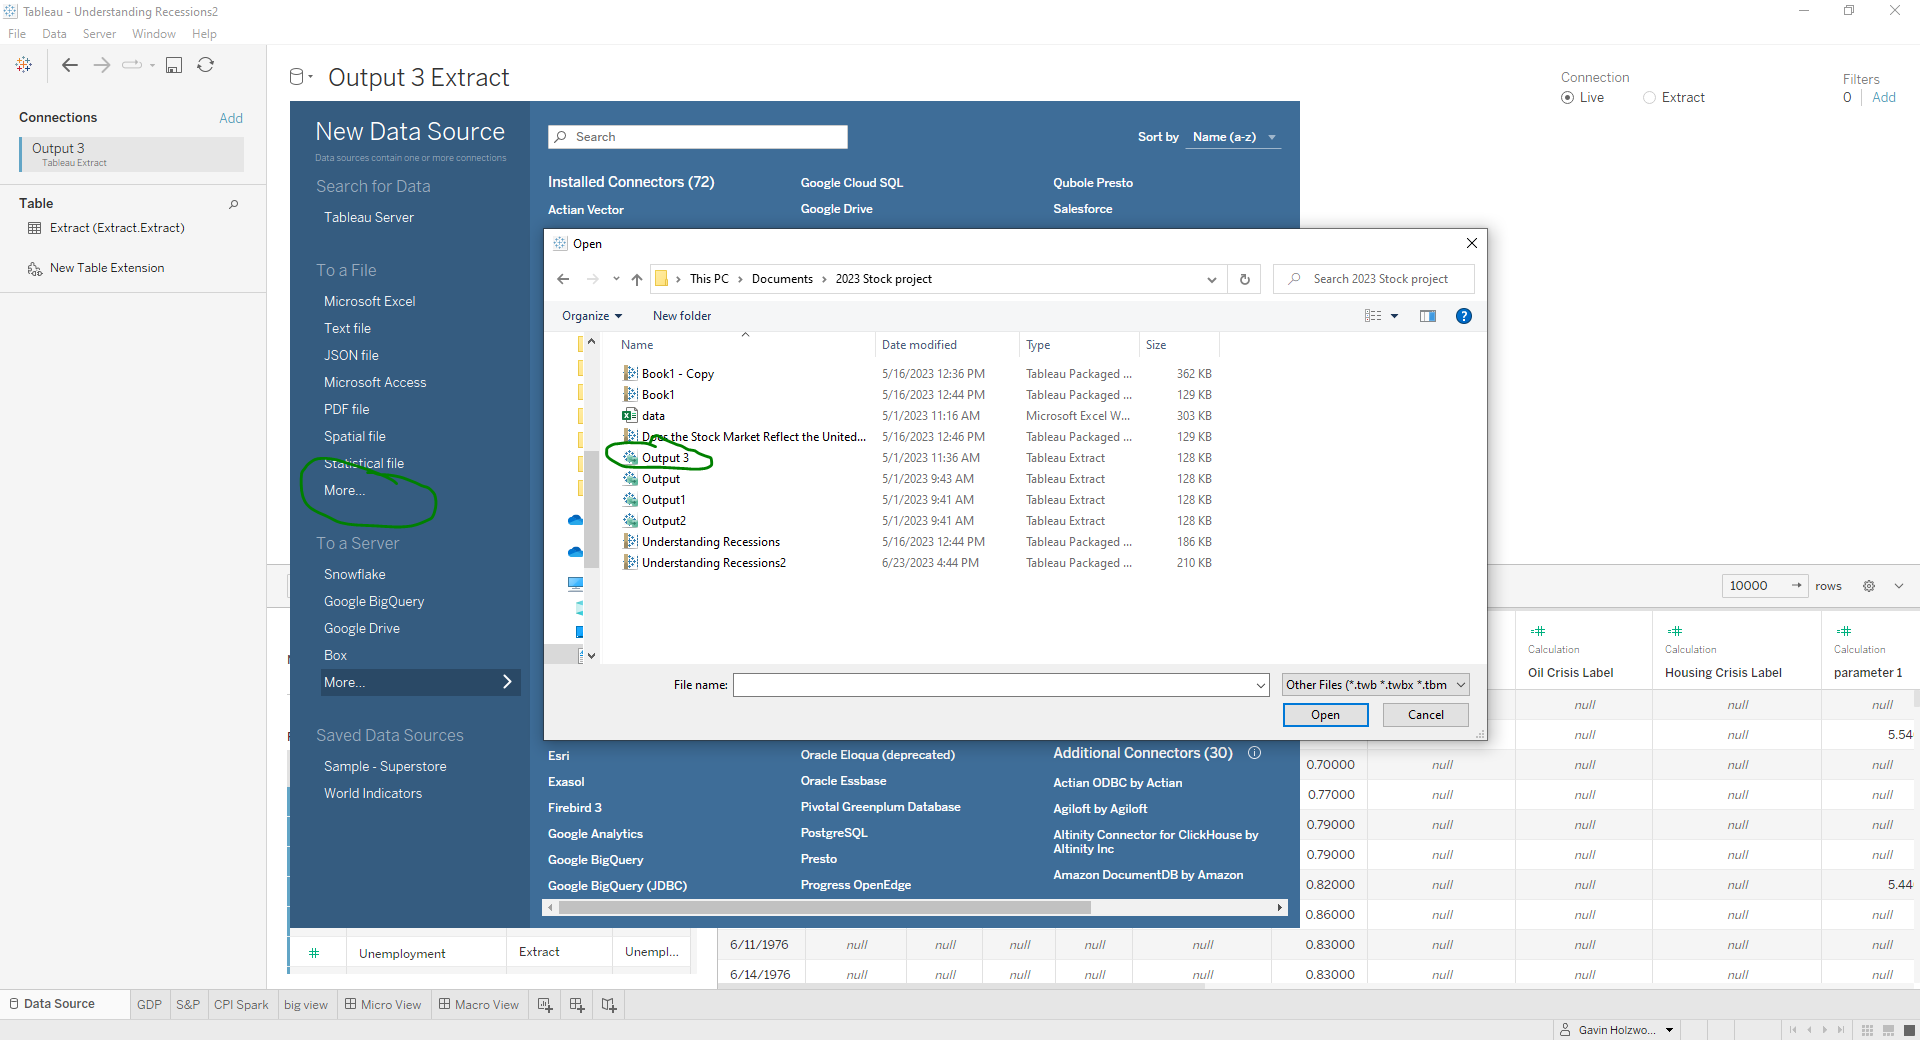
Use the “More” file option to select your desired Hyper file.
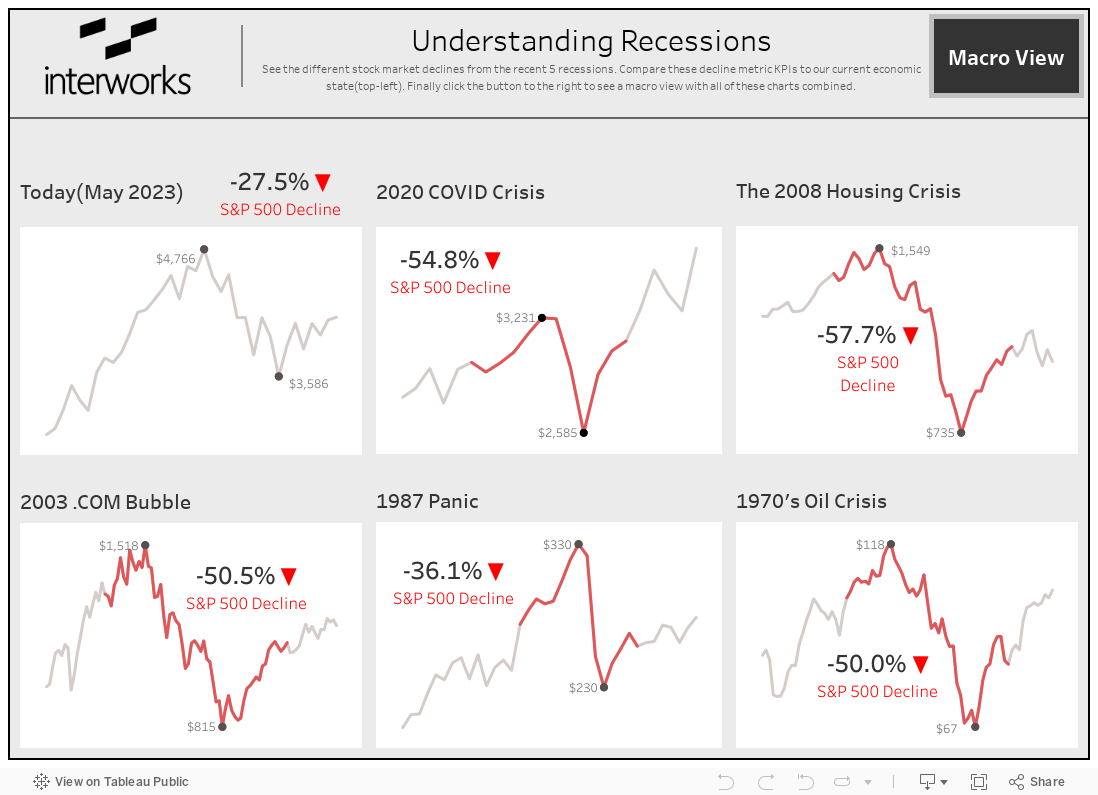
6. Plot and Build Dashboard
With the skills we learned here, I was able to create this dashboard on recession data!