
To best use ThoughtSpot, we need to have a good understanding of the data structure being used. The best way to work with that data is in ThoughtSpot’s data pane. In the data pane, we need to connect to a data source (in our case Snowflake server), then we need to create some data relationships using joins between the appropriate tables.
I will give a few rough explanations of “join types” in this blog. Although, for a more in-depth explanation of joins, check out Sebastian’s blog on the fundamentals of joins in analytics.
Our Starting Tables
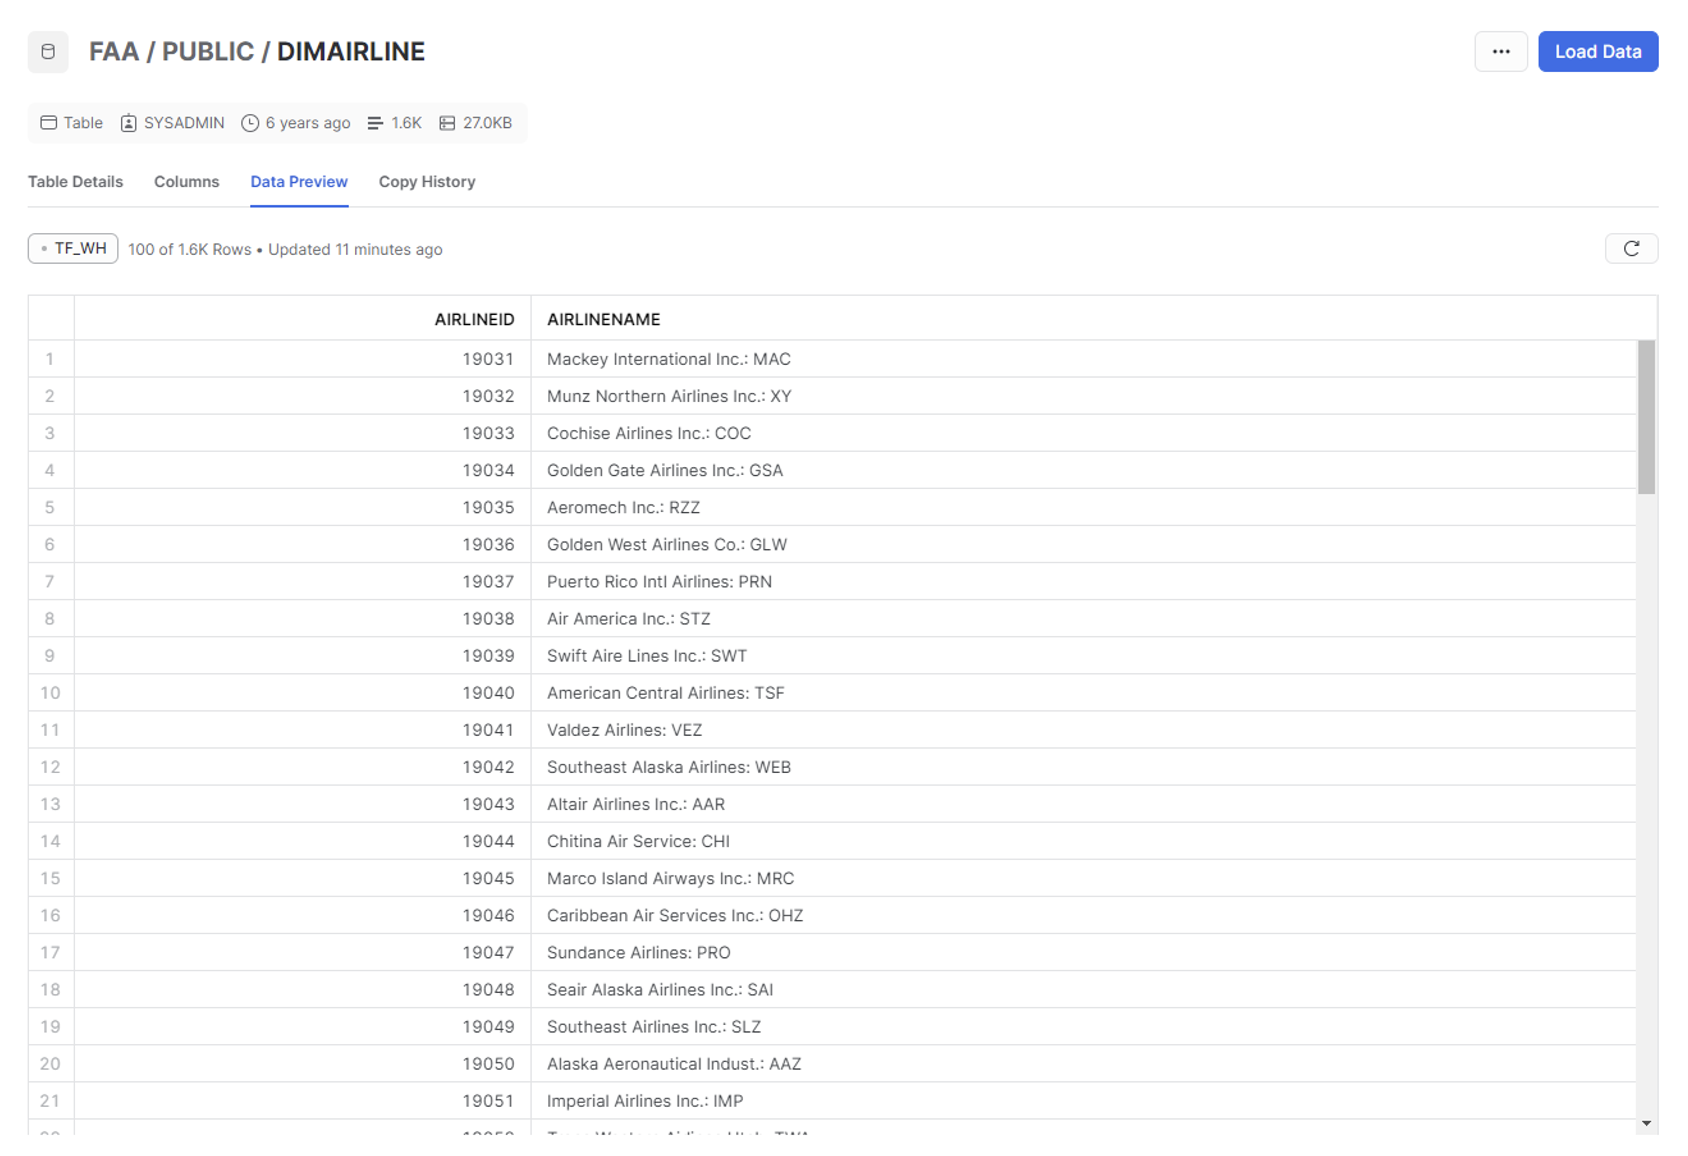
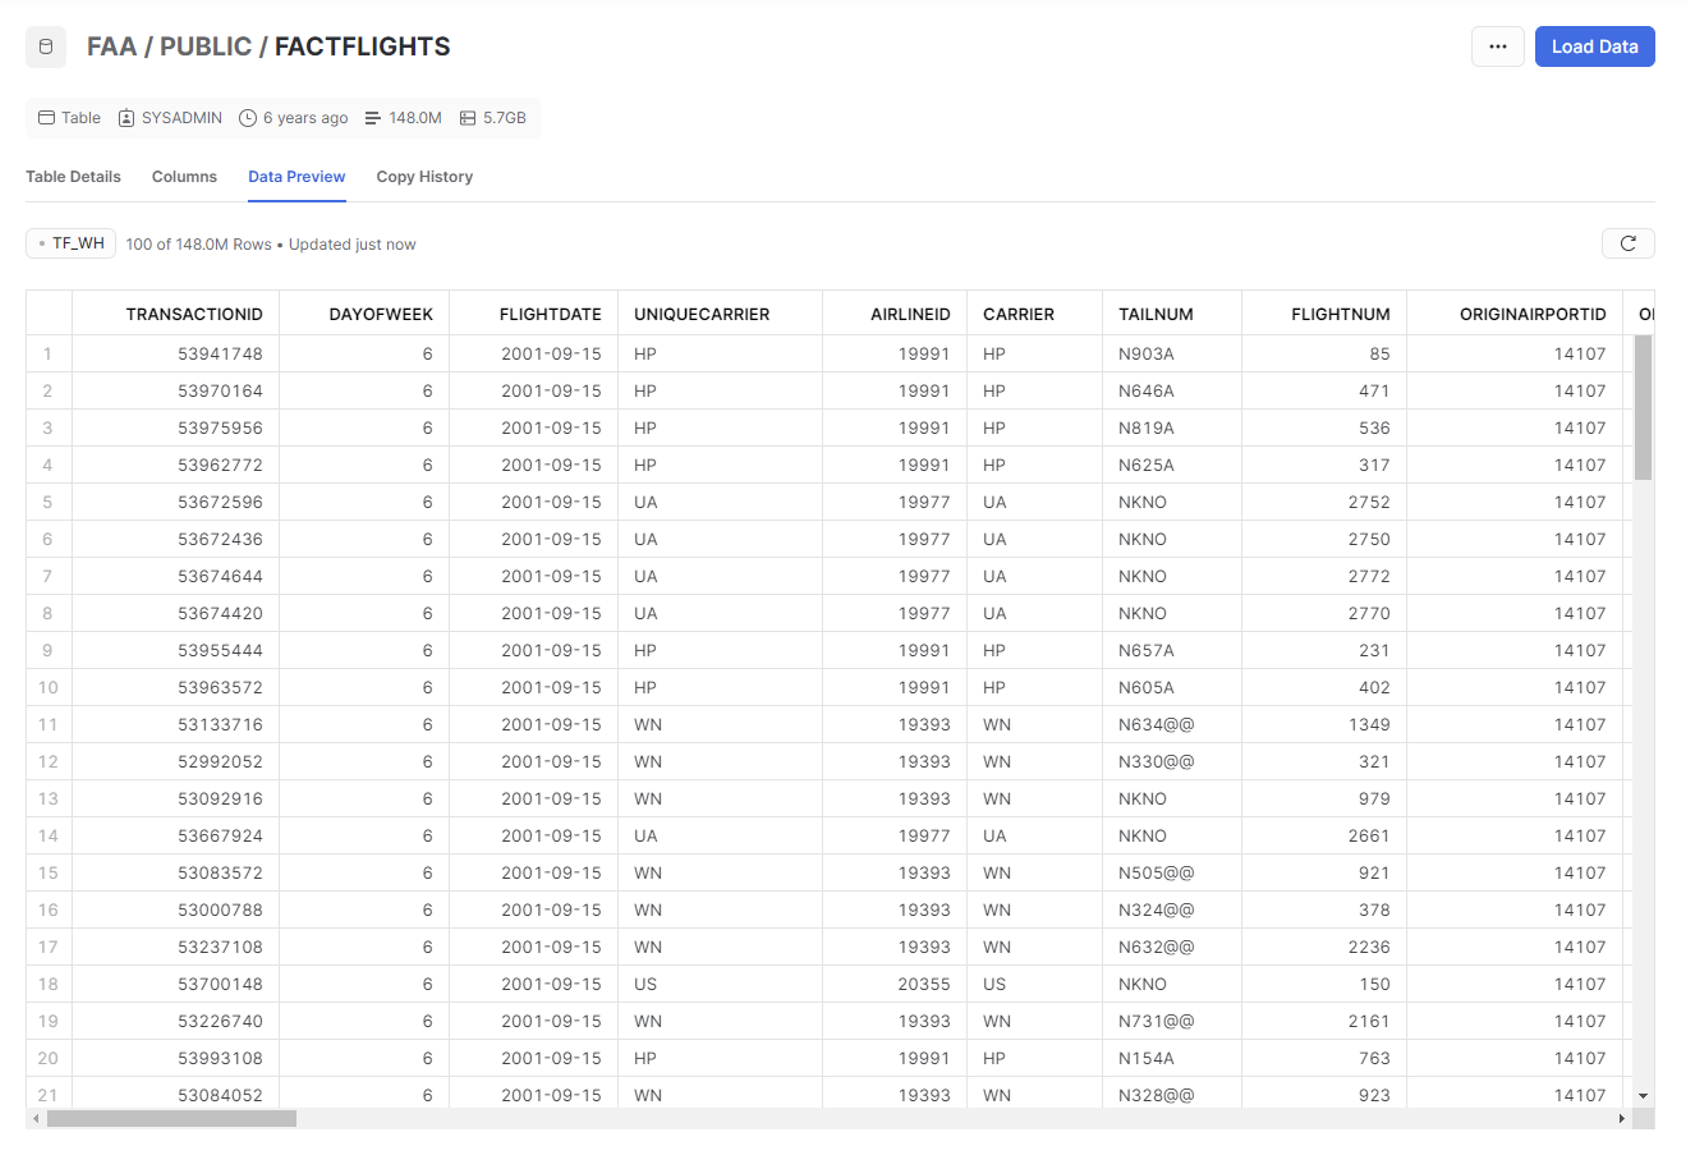
For this blog, I established connection to FAA flight data via our internal Snowflake. Below are images of the two Snowflake tables of interest and their respective columns. The first one is “DIMAIRLINE,” which has the airline’s unique ID number and their name, while the second, “FACTFLIGHTS,” contains information about specific flights and which airline performed said flights:
Join Types
When you “join” data, this typically means there is a combination of two data types based on two (or more) relational columns. These columns are considered relationship columns. For example, you will see in my Left Join example that we use “AirlineID” as the relationship column to match preform the join on. The best advice I can give is to look at all your tables and find columns with similar column names to see if they could be candidates for join relationship columns. A best practice for your organization would be to establish an entity relationship diagram (ERD) that clearly lays out primary keys, foreign keys and how they relate from table to table. This will inform you moving forward when trying to create new joins in your ThoughtSpot Environment.
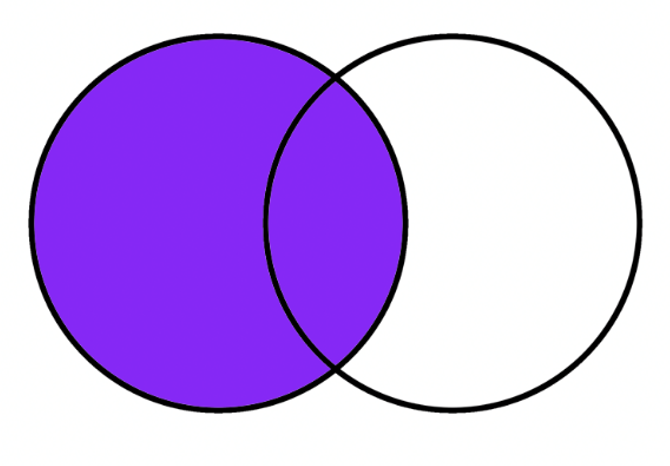
Above: A Left Join
In this example, we have two tables that we’d like to create a Left join relationship on. This is one of the most common joins in the data world and is certainly needed in ThoughtSpot.
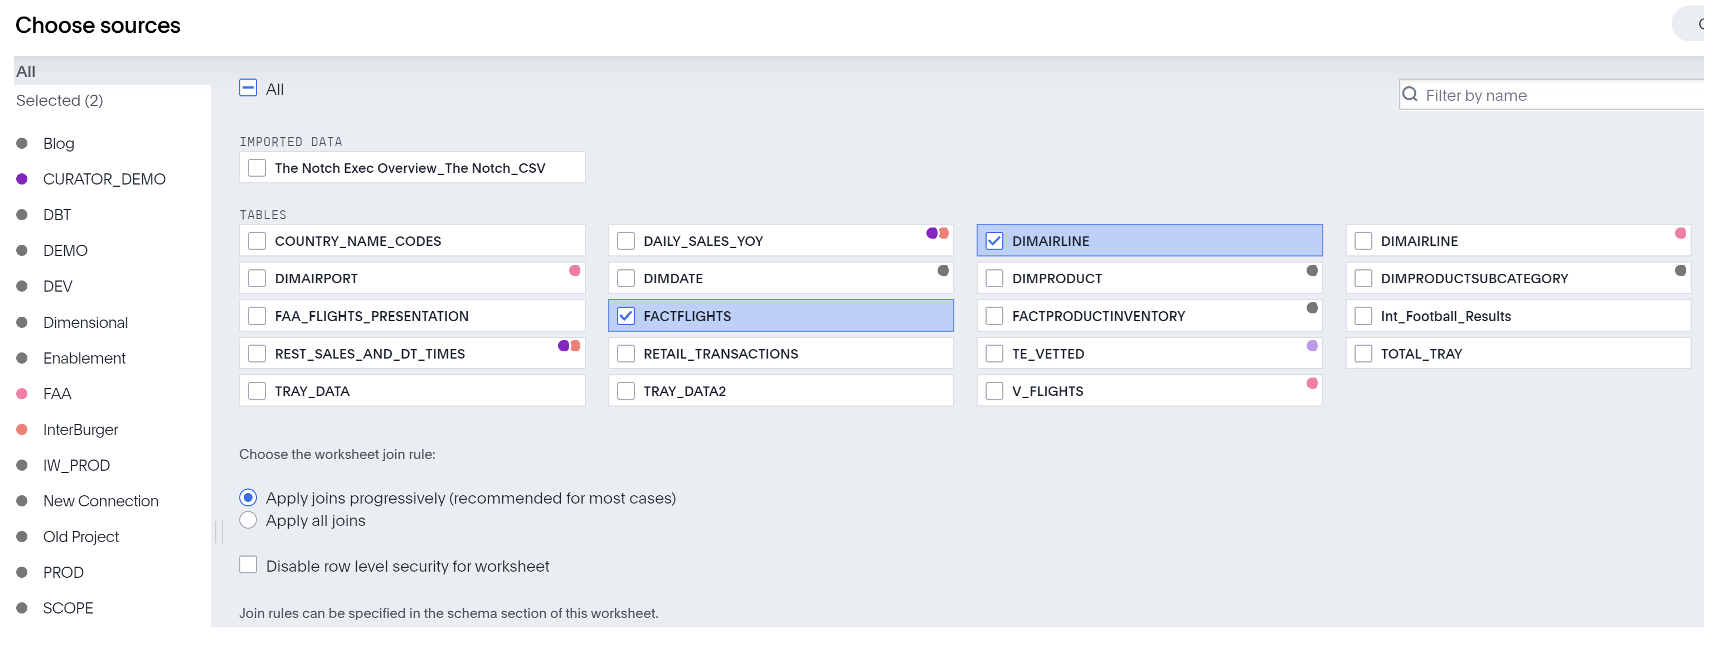
The setup below will match up the AirlineID columns of both the “FactFlights” and “DimAirline” tables, then return all the associated data columns for both tables. For our example, two interesting columns that now have a relationship are “AirlineName” and “Flights.”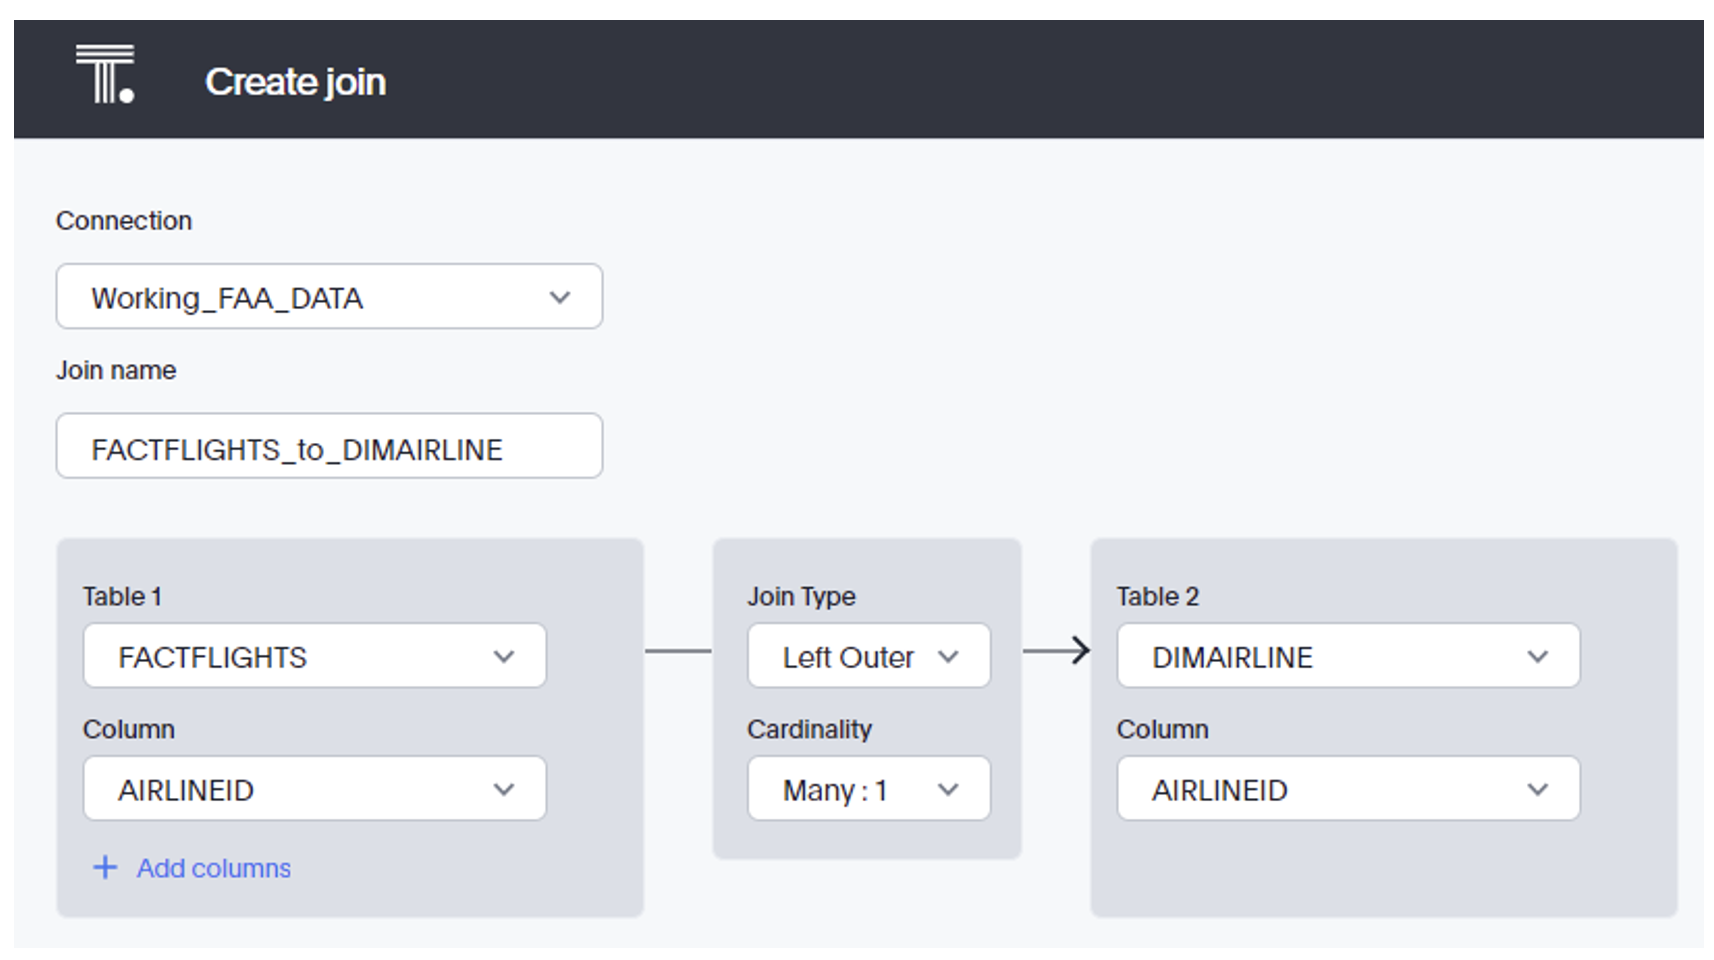
Above: Setting up a left join between FACTFLIGHTS and DIMAIRLINE
This is where I create a custom worksheet in the data pane for our FAA data connection, which looks like this:
After creating the connection, we need to make a data worksheet to specify the “view” of our new data model. Here, we can select our needed data columns in the applicable tables:
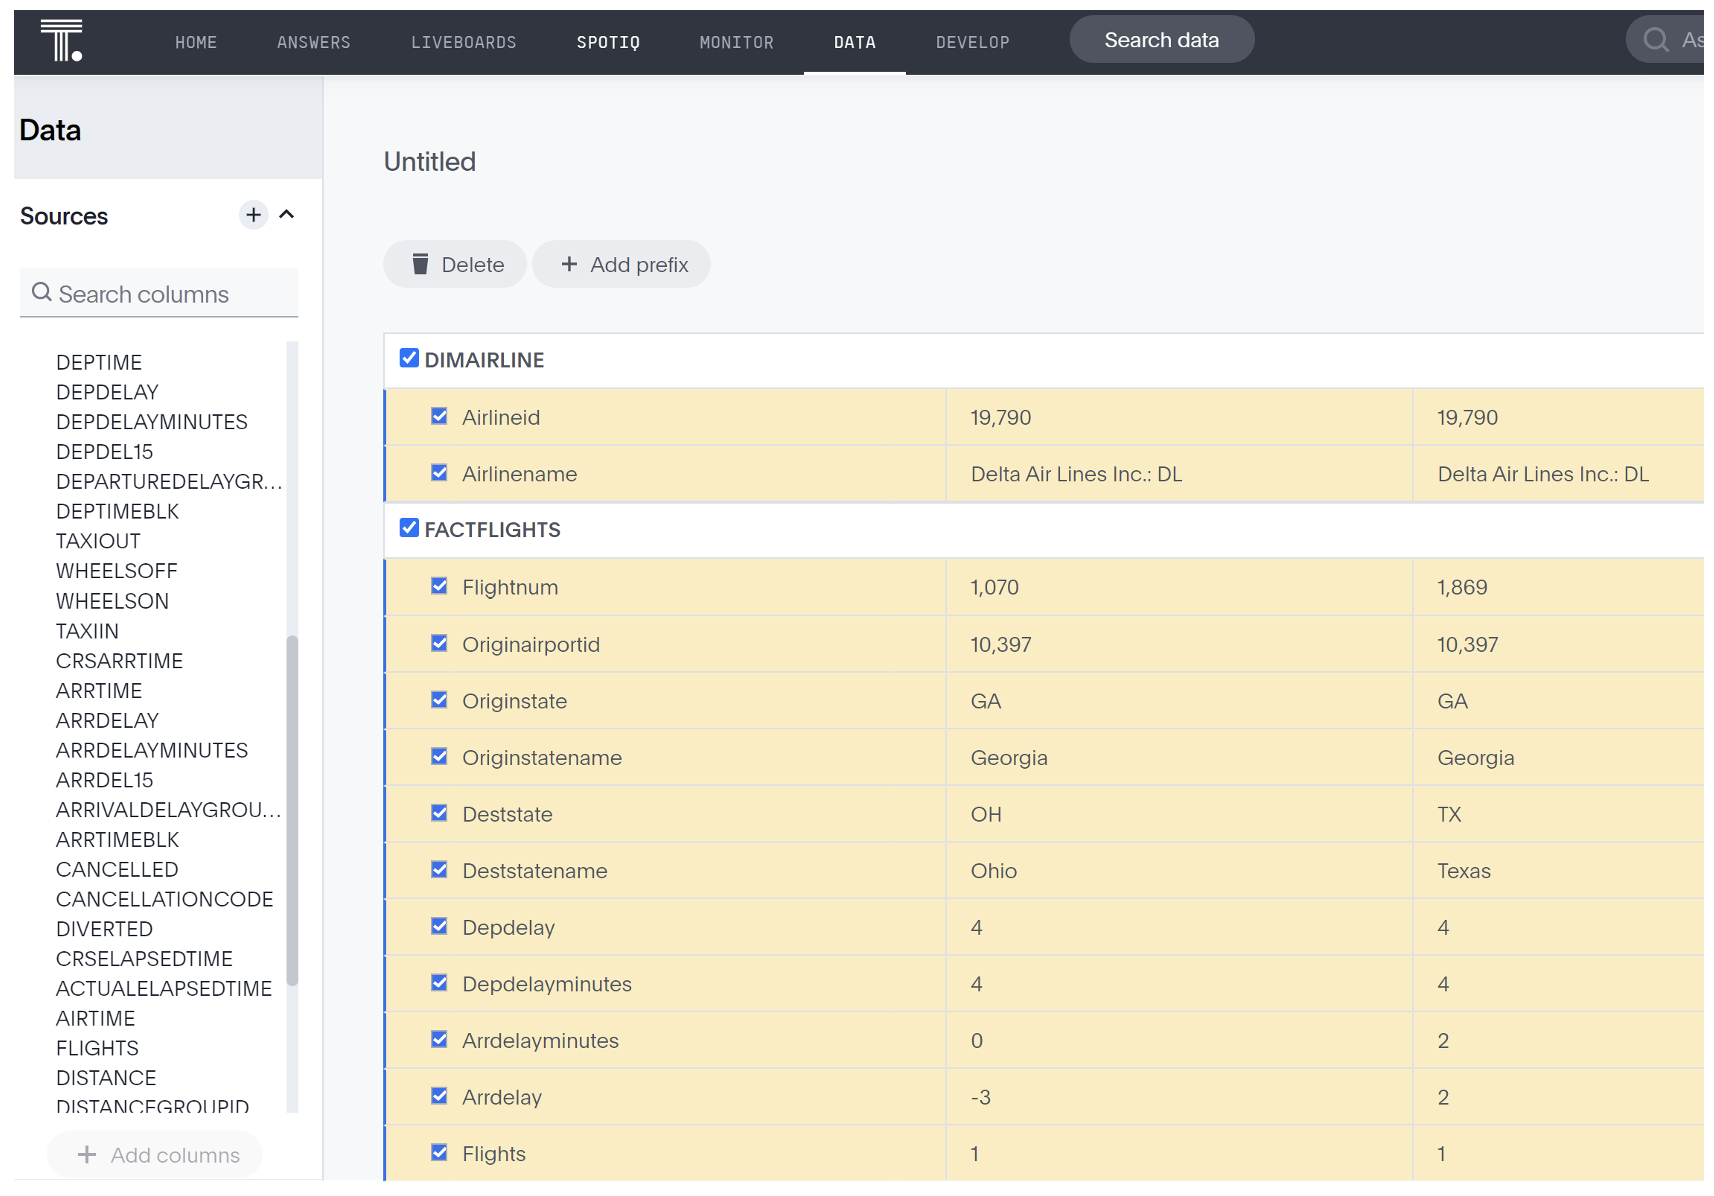
NOTE: If you are at this step and you have a table you want to access but it’s “grayed out,” this means you haven’t created the appropriate joins. Return to the earlier connection step to ensure all join relationships are inline with your needed data model.
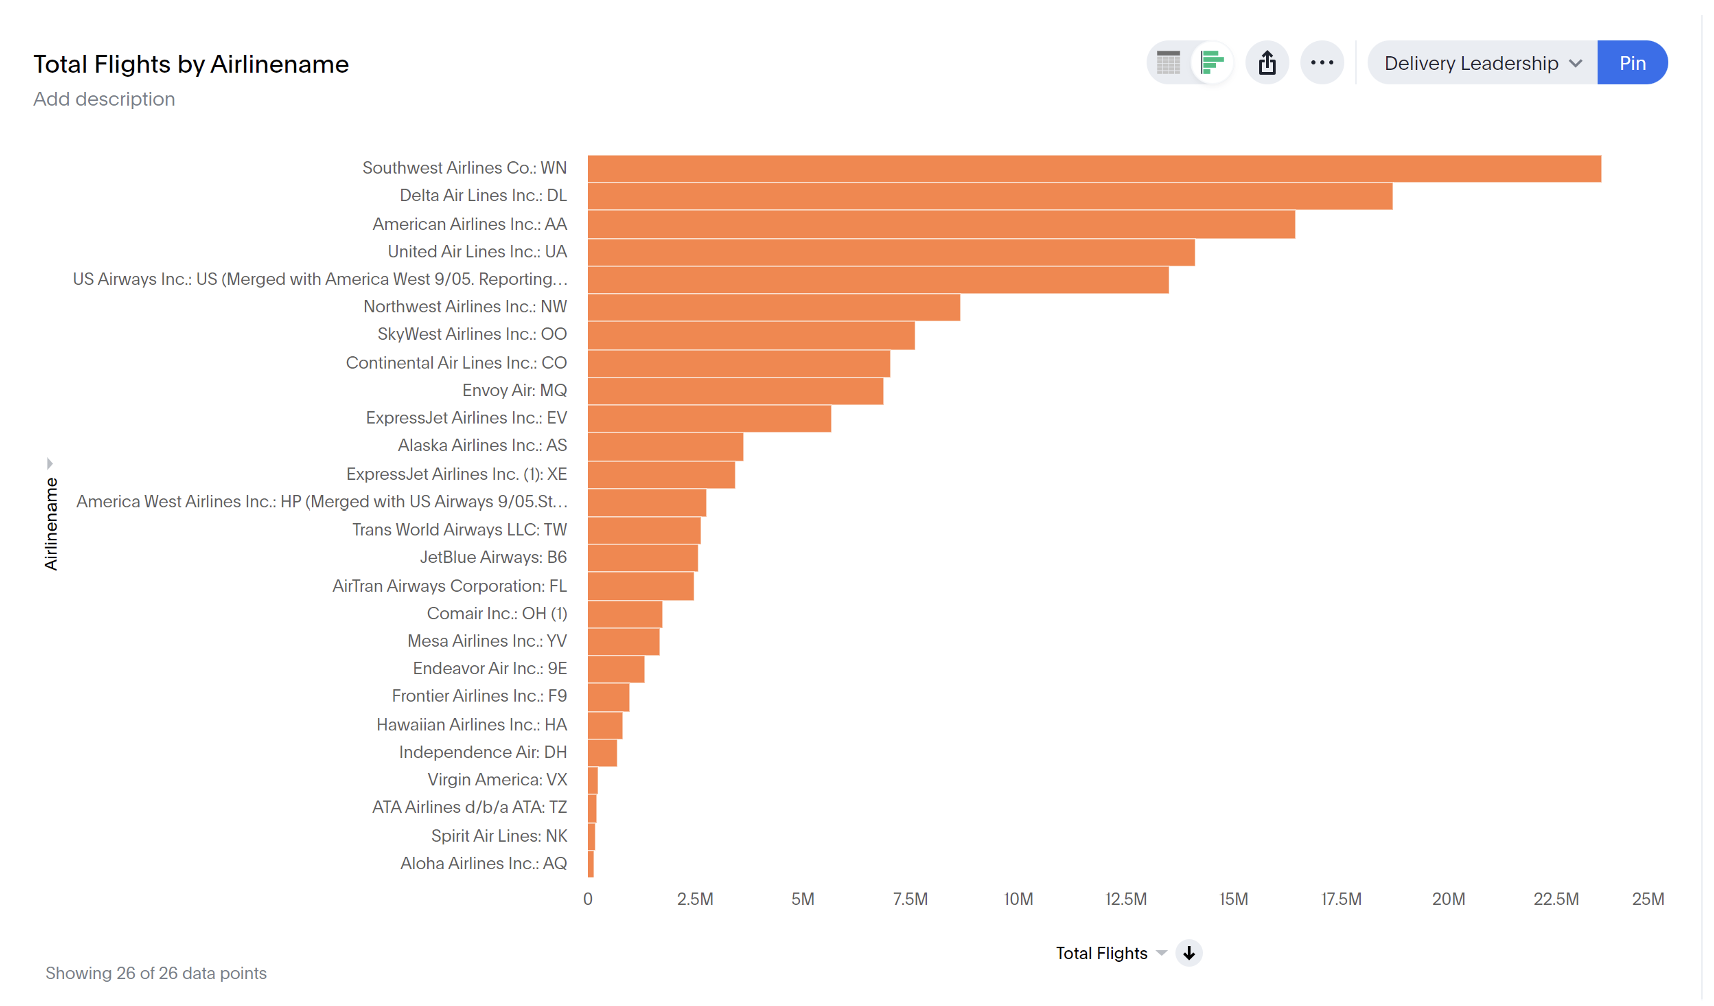
Here is an example of an answer I created based on flights per AirlineName:
Conditional Join With SQL
Conditional Joins are essential the common joins seen above, but are implemented in an SQL editor accompanied by conditional criteria that narrows the data in view. This can be helpful in unique and custom data needs. It also helps in reducing load time of your live board because it’s now only querying a smaller set of data. Here, we will implement an example in ThoughtSpot on our FAA data:
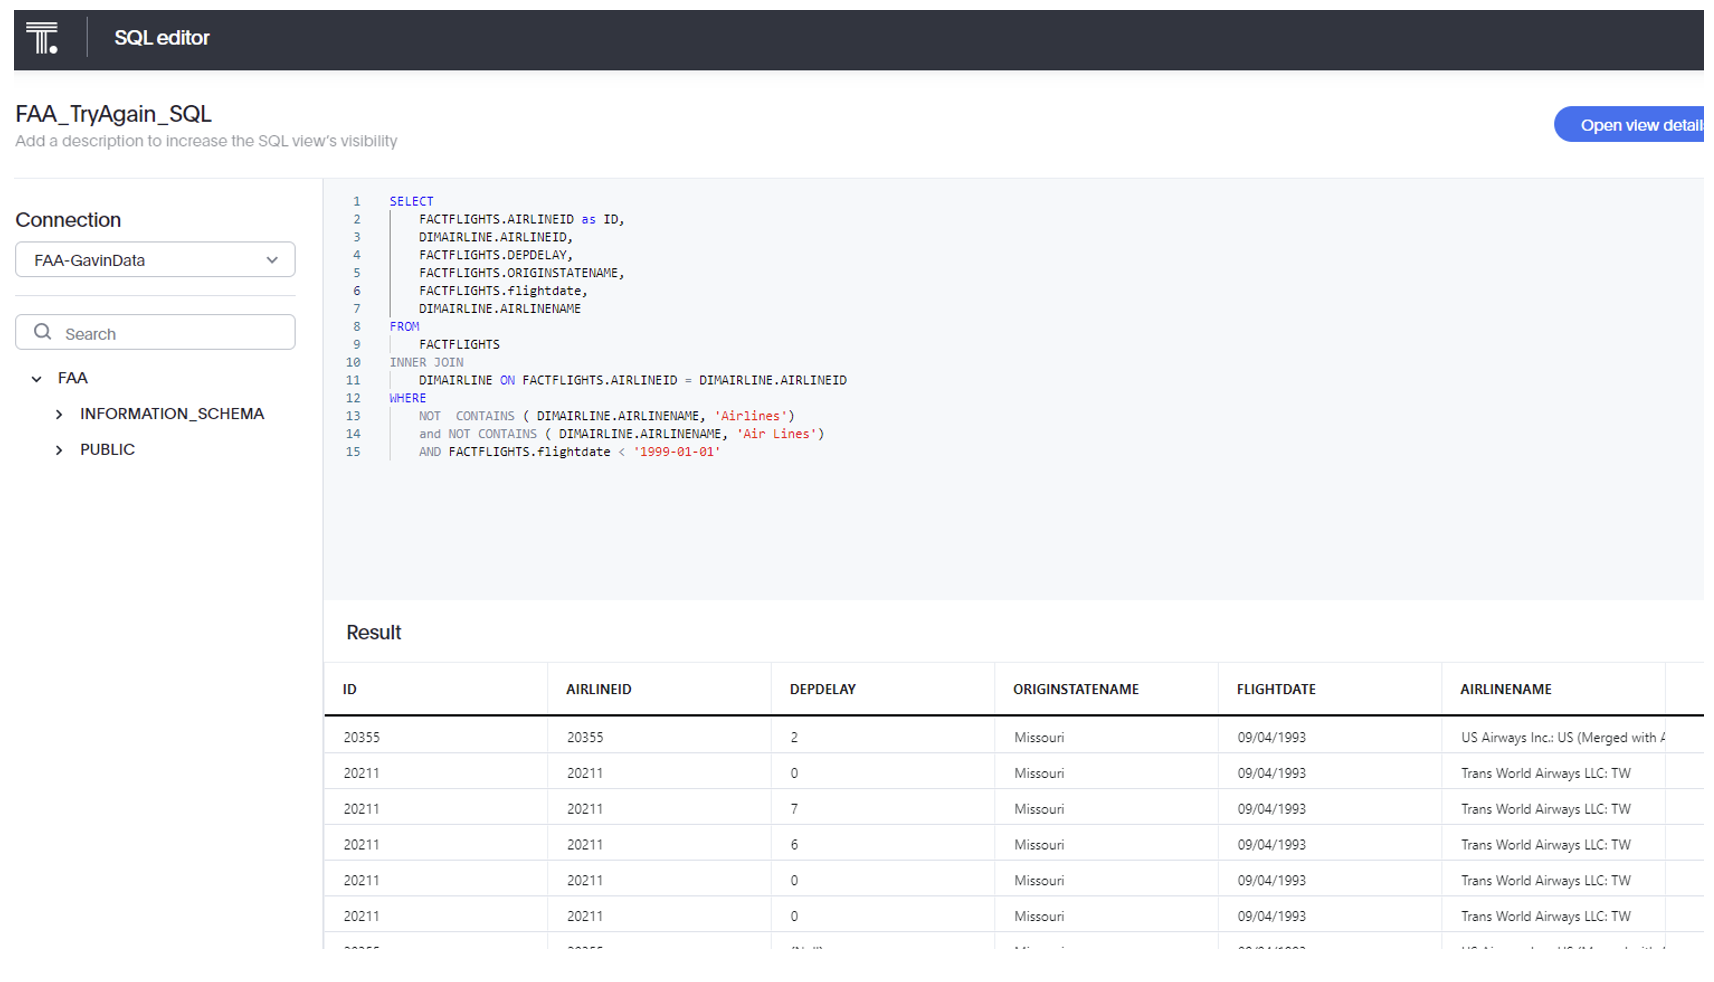
This SQL narrows the large data set to only show the applicable columns, including Airline names and the states at which their flights originate. For fun, I also excluded all airlines that contain the word “Airlines” in their corporate name. Additionally, I excluded all flight data after Jan-1999. These filtering criteria have little business benefits, but I wanted to demonstrate the capabilities and possibilities of data work within ThoughtSpot.
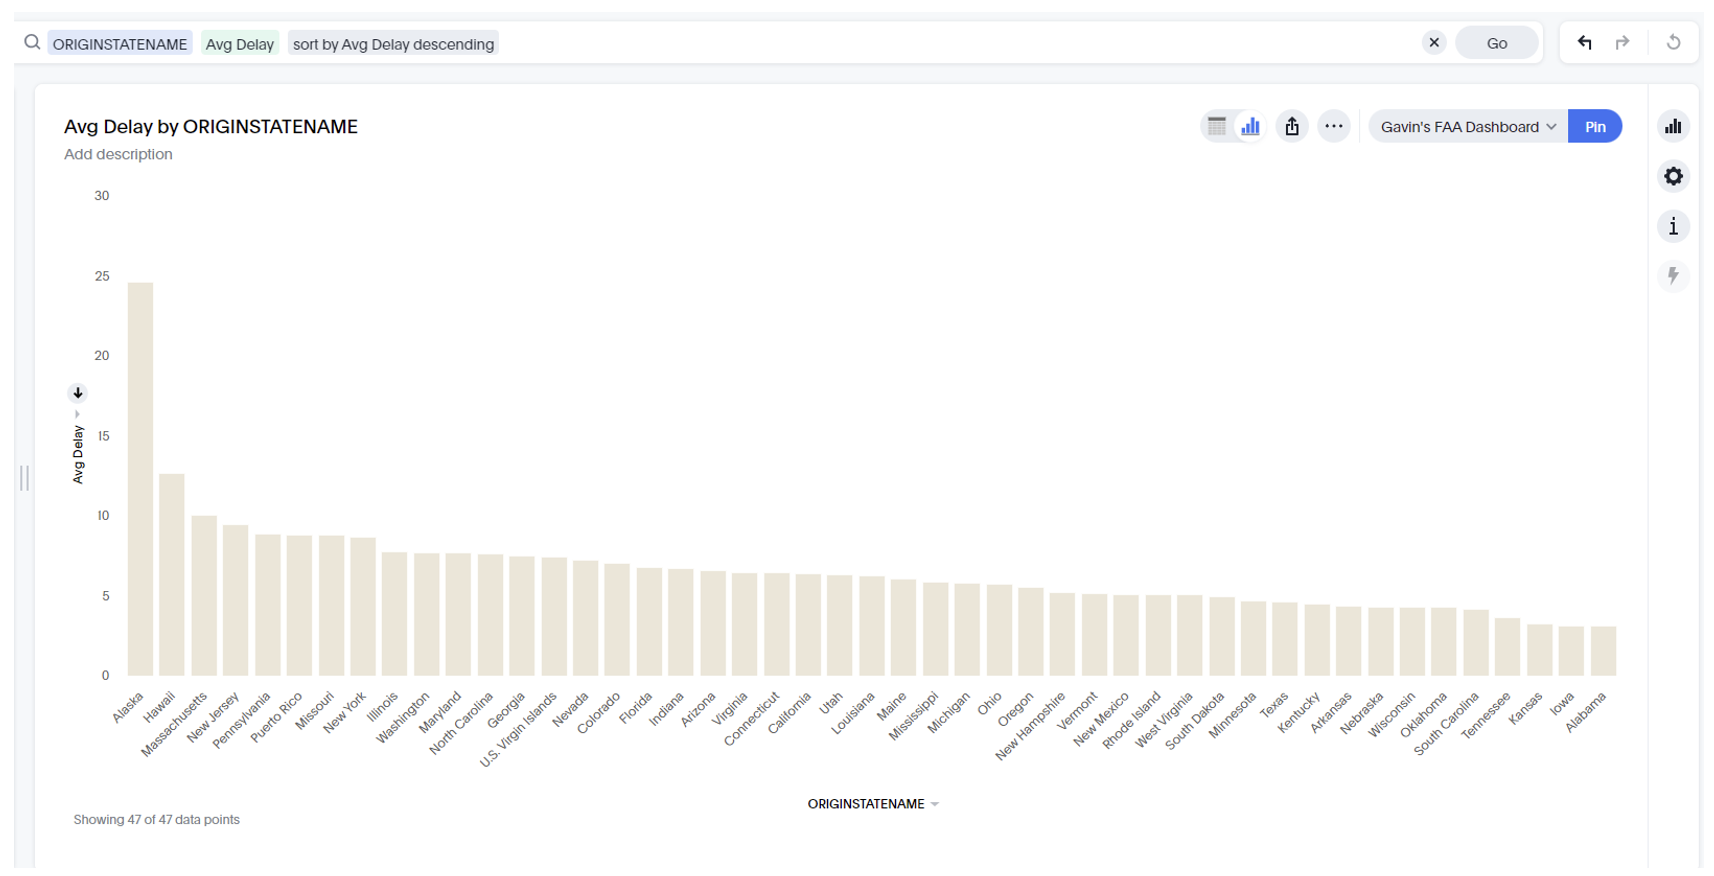
Using our data, we created an answer of the average departure delay by state of airlines that don’t have the “Airlines” in their name. The worst state for delays was Alaska and the best state for delays was Alabama:
We hope this blog finds great us for your organization. If your team is new to analytics design and/or ThoughtSpot, our data visualization and engineering experts can help you craft a ThoughtSpot strategy curated to your needs.