
Worksheets serve as the cornerstone of a curated, delightful search experience in ThoughtSpot. Worksheets allow ThoughtSpot developers to set contextual guardrails on your data model and create datasets that can be tailored to the needs of multiple audiences. As your ThoughtSpot user base grows, the number of worksheets you create will grow with it. Here are best practices and some common mistakes to avoid so your worksheet strategy can scale with your company-wide adoption of search analytics.

For those of you who are new to ThoughtSpot, we should first define a worksheet in less conceptual terms. A worksheet is a logical view that is built off of tables that are related in ThoughtSpot and uses a subset of the columns available in your data model to answer specific business questions that your users may have and make it presentable and friendly to business users.
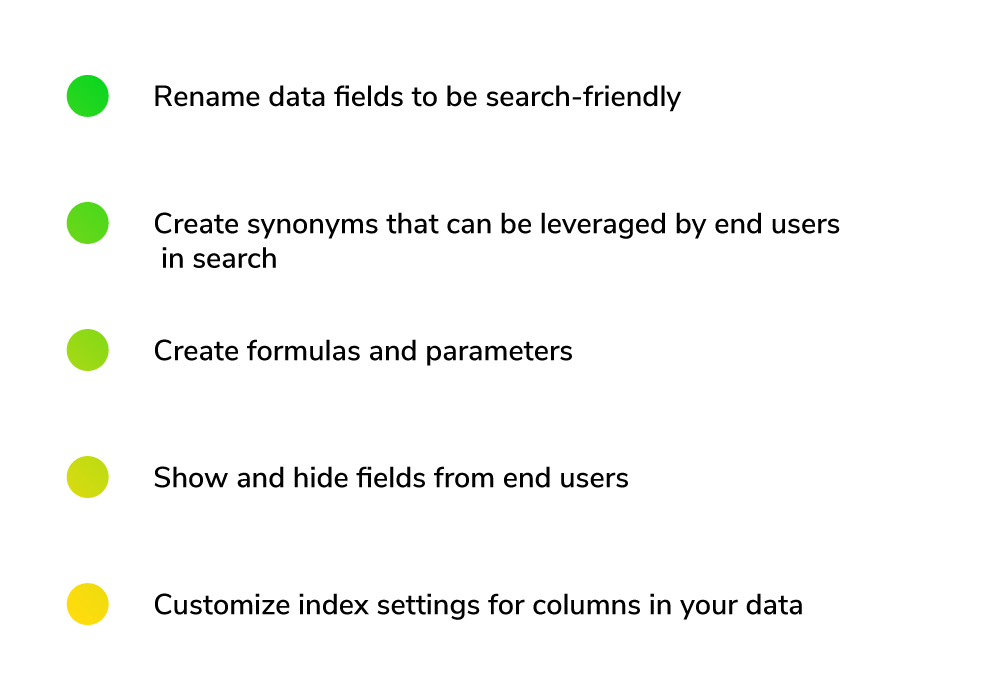
In worksheets you can do the following:


Even though ThoughtSpot makes it easy to roll up your sleeves and build powerful data products within seconds, you still need to first understand the “Why?” behind what you are building and what it will service.
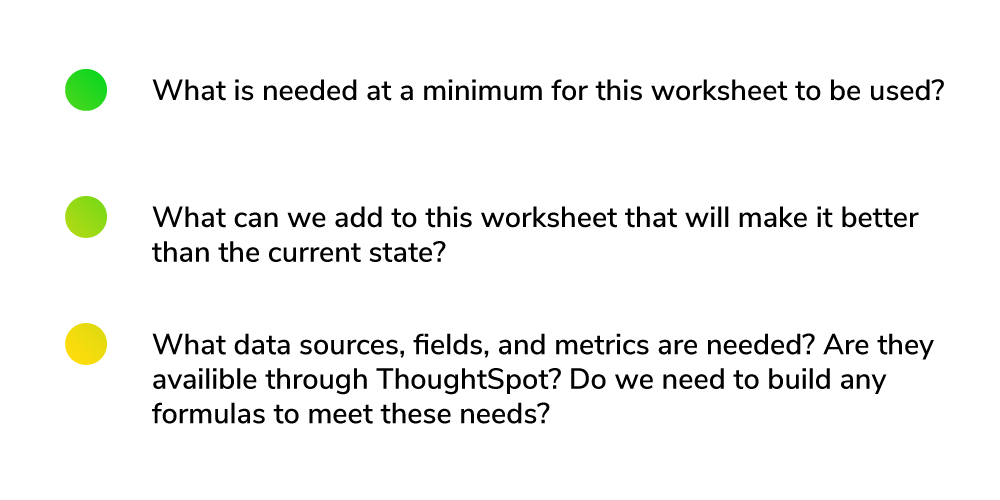
Worksheets should sit one-to-one with a group of users who are going to be consuming similar metrics and searching for different cuts, mixtures and flavors of those metrics. For a successful ThoughtSpot launch, you need to ask the following questions of your users:
By answering these questions, you can create a blueprint for your worksheet that will guide you through the initial design process.

Regardless of your user base, we recommend starting simple with your worksheet design by starting off with the fields that are required for minimum user acceptance and any additions that can be made to improve on the current status quo.
By limiting the fields to only those that are necessary to users, you can create speed to value by focusing on creating a frictionless, optimized search experience that users will trust and quickly comprehend. Once users become familiar with the first iteration, you can then begin to ask, “What next? What questions are you not able to answer?”
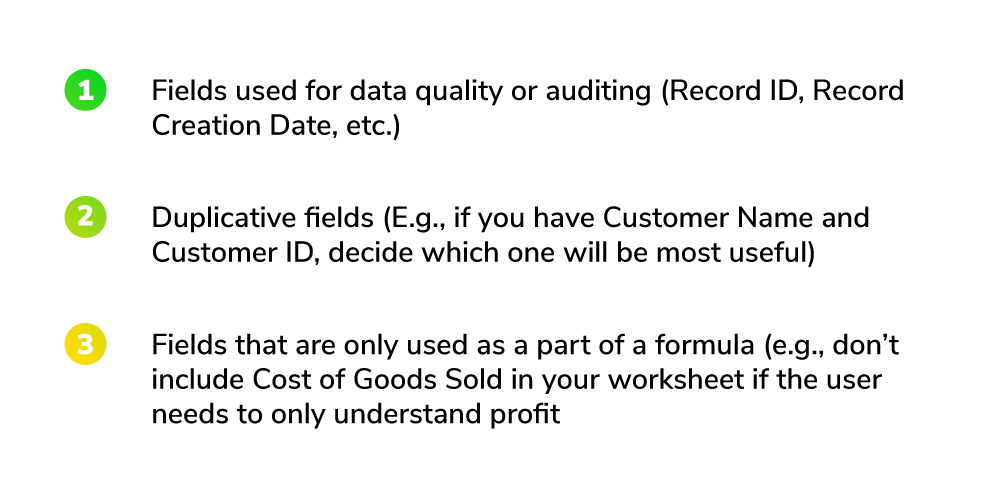
If you’re overwhelmed with the number of fields in your data model, we recommend starting by excluding any of the following field types:

Your worksheet drives the first experience users will have with ThoughtSpot, so it’s important to make sure the purpose, field names, formatting and use cases for your worksheet are clear and concise for users.
Field Naming
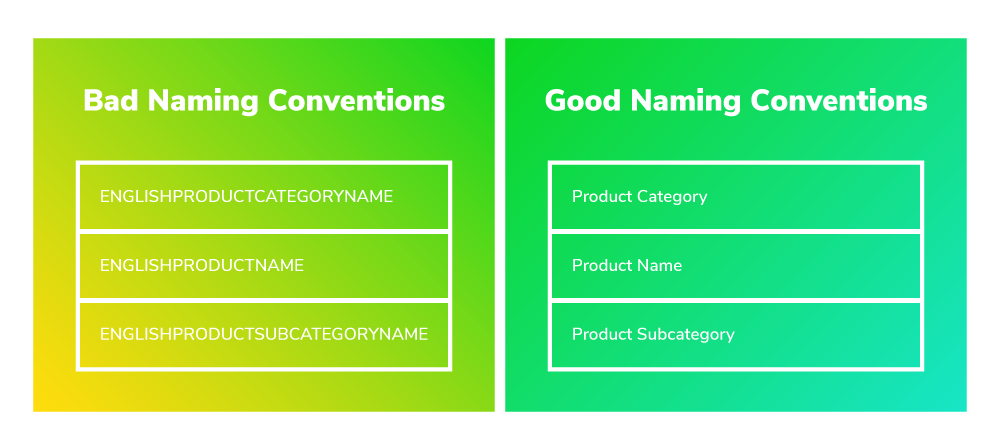
Trust starts with ensuring that data columns are correctly named and familiar to end users. In many cases, consumers will not be familiar with the name of their metric in a database and will be more familiar with a calculated field or alias for this field.
For example, if you had dimensions named PRODUCTCATEGORY, PRODUCTSUBCAT, PRODUCTMODELNAME in your Snowflake database, users would probably expect these to be named “Product Category,” “Product Subcategory” and “Model Name” respectively. Updating these field names in your worksheet will make it easier for end users to search.
Synonyms
Some data fields may go by multiple names in your organization. Sometimes, legacy data fields or metrics can be renamed over time and some folks will still default to the older or newer name of that field. ThoughtSpot synonyms can now be generated via GPT using ThoughtSpot Sage, or defined manually.
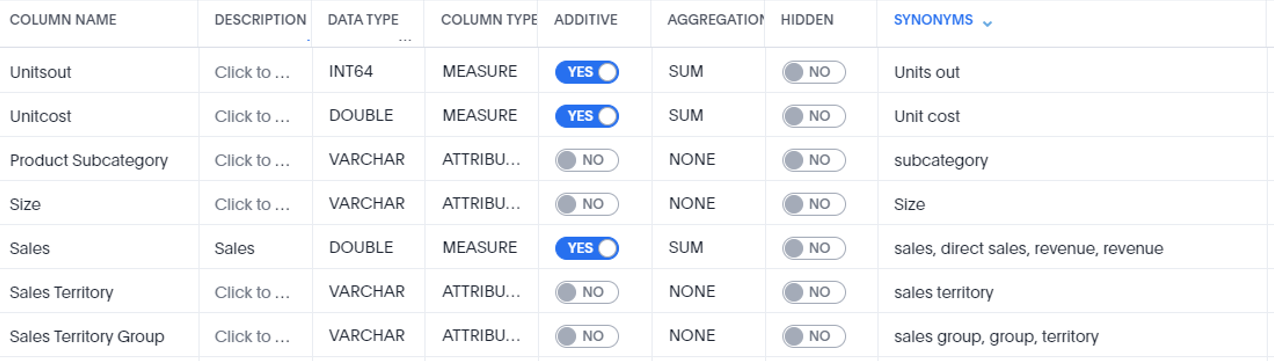
For instance, if you have a field that shows Profitability, some groups may refer to this field as “Profit,” though some folks who have access to this worksheet from the Finance team may refer to it colloquially as “Gross Profit” or “Gross Margin.” With synonyms, you can easily assign multiple keywords to the same data field so that users can consume the data using their preferred terminology.
Titles and Descriptions
Titles and descriptions should be aligned with the intent and use cases that put that worksheet into existence. For example, if you have a worksheet that contains revenue performance across customers and regions that is meant for merchandising teams, instead of “Revenue Worksheet,” consider using “Merchandising – Sales & Profitability by Product.” This title not only describes the data in the worksheet, but also provides context for how it can be used and the intended audience.
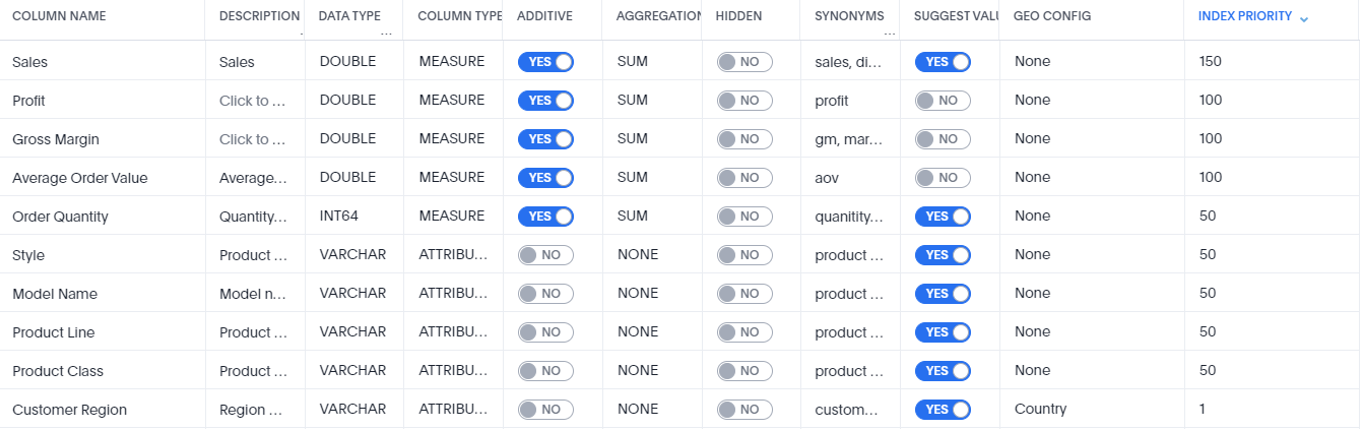
Indexing
In worksheets, you can set the index type and priority for each field. For your most popular and commonly used fields, set a higher index value. This will index the field and its values to make the search experience more seamless for users of this dimension in the search experience.

ThoughtSpot formulas can be created at the worksheet, view or answer level. When interviewing your users and understanding what formulas they will need to make the worksheet useful, place all of those formulas in the worksheet instead of individual answers on a liveboard. This will establish trust with your users and reduce the possibility of work duplication and inconsistency between metrics.
Parameters should also be kept close to the worksheet, as they are commonly used with formulas.

By starting small with your worksheet, you can then take some additional steps to understand your users, what data they are consuming most frequently and where you can make proactive improvements to create a delightful search experience.
By monitoring your usage statistics and performance tracking in ThoughtSpot, you can see exactly which users may be struggling in their search experience and which data tables are being queried most consistently.
Using the “Top Viewers” reports in ThoughtSpot and the “Detailed Stats” table in the Usage Statistics module, you can easily target user groups for interviews and see which worksheets and tables are seeing the most adoption and creating the most stickiness over time.
At InterWorks, we have a crew of ThoughtSpot experts who can design worksheets and data strategies for your organization for sticky, best-in-class consumer experiences. Drop us a line if you have questions about developing your Search Model for ThoughtSpot!