
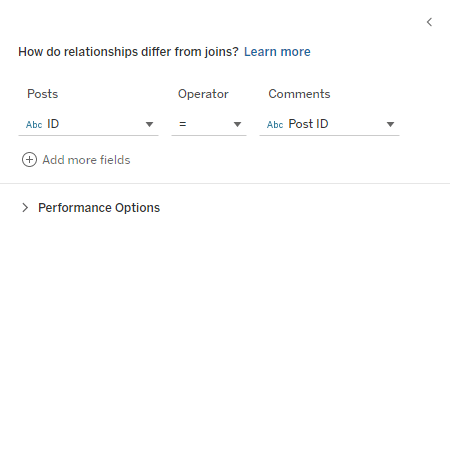
From here on out (at least for a few posts), we will have a look into the Performance Options of Relationships that are shown when we design a relation between two tables. If you have no idea what I am talking about, chances are that you have never expanded the options. You’ll find them in your data source as soon as you click the noodle right where you set up the relation:
Now you might ask, and rightly so, what the heck does Cardinality mean? What is a Referential Integrity? And what do the options mean that we find in there, like One and Many or Some and All?
Before we begin, I am obliged to give one very important disclaimer: Don’t change the Performance Options unless you know the structure of your tables and understand how these Performance Options work. Otherwise, you may either run into duplication of data, loss of data or other strange things.
But the good news is that it’s not as complicated as it sounds, or rather as Tableau makes it sound. Finding the right wording here is tricky, and Tableau probably did its best.
The Example
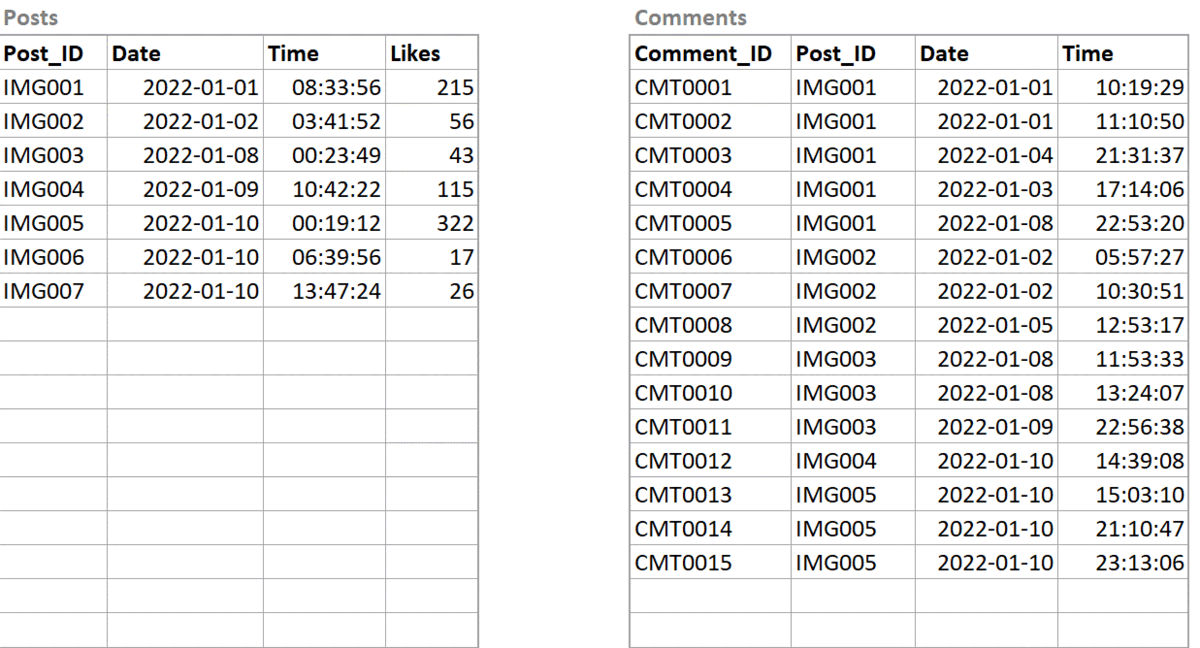
A dear friend of mine is on Instagram and posts the casual image every few days. She wants to track the likes and the comments that she or rather her posts get. We have two tables:
- One with her posts where each post gets its own row. There is an ID of course, each post has one, but also a time stamp and a column for the Like count per post. These Like counts are updated every day.
- The other table is a list of all the comments her posts got. One row for each comment, including a comment ID, a time stamp and, of course, the ID of the post that the comment belongs to. Like this:
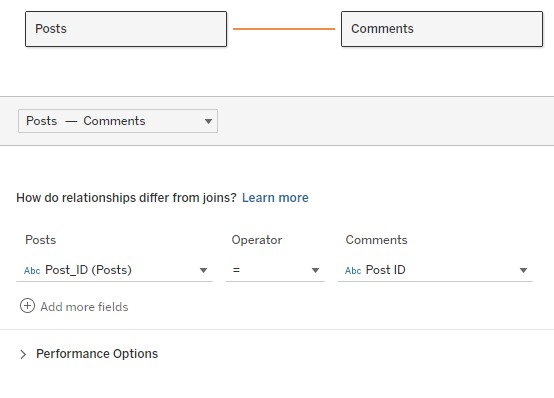
When we relate both tables in Tableau, we naturally connect them on the field Post_ID so every comment gets mapped to its respective post. In Tableau the whole thing looks like that:
Now we are all set for starting the analysis and building charts, but maybe we want to tweak the performance. Here we have to do one final excurse and talk about Tableau’s language, at least for a minute.
Tableau is a querying tool. This is a bit counter intuitive as Tableau is usually named as the top visual analytics tool. Of course it is, but to be a more visual tool, it has to translate data into visuals. We help it by designing our views and dashboard, dragging the fields we need onto our shelves, then Tableau puts the data where it belongs.
Background: Tableau’s Language
But how? I mean, Tableau is not a natural language processing tool (NLP); it does not actually communicate with us, and we don’t even speak the same languages. Tableau’s own language is called VizQL, a derivative and at the same time vast extension of SQL that is capable of building visualizations. The moment we drag a field into our view, we trigger a VizQL statement that consists of a database query and the instructions to build a bar chart, for example.
While the actual VizQL statements are not visible or analyzable, as they are proprietary and the essential engine behind everything that Tableau does, we can still see the SQL queries it produces either via Tableau’s log files or by using the Performance Recorder (via Help -> Settings and Performance).
These queries are what generates the data in our view. So, as I said, when we drag a field into the view, part of what is happening is a SQL query to the database to fetch all the data for that field. From there the data is transported to what Tableau calls the Temporary Tables. These tables are automatically created when the workbook is opened, and they are automatically deleted when the workbook is closed. On this TempTable, Tableau performs everything that has to do with table calculations, but it also plans how to render the visualizations and then sends this data as a visualization onto our canvas.
In the upcoming post “Deep Dive: Breaking the Cardinality,” we will see a lot of those SQL statements, all of which also include the word TableauTemp. And before you get exited (as I was): No, these are not the kind of tables I talked about before, although they have the same or a similar name. The temporary tables from before are invisible and not accessible to us. TableauTemp here is also a table (or several of them actually), but it works more like a cache for data and recent query results.
You don’t necessarily need to remember that. But what you do need to remember is that Tableau generates SQL statements to fetch the data from your database.
With Tableau’s Performance Options, we tweak these SQL statements, which changes the query time. So, let’s have a look at how in the following article of this series:
“Speed and Cardinality.”