
Until Tableau version 2020.1, whenever we had two or more tables that we wanted to connect with each other, we had to either join them or blend them. If you aren’t sure about joins, please take a minute and get yourself up to speed. We will need them later on, or rather we need to know what they are as Relationships use them all the time.
- With traditional joins, we could and can merge two tables on one or more key fields (so we are adding columns from one table to another).
- With blends, we could and can merge two tables from two different data sources. They work very differently compared to joins and have their merit when both tables have different granularities. This is something that joins usually struggle with.
With Tableau’s version 2020.2, joins and blends are still possible, but another mechanic was introduced: the Relationships, often known as the New Data Model or The Noodle within the Tableau community.
Relationships have one thing in common with joins and blends though: If you don’t understand them, they feel like magic when they work and dark magic when they don’t. I like magic, but when it comes to data, what I like even more is knowing what I am doing. As such, it took me quite a bit to learn, but in the end, and with a bit of help and digging into the topic, I have defined a few ground rules that support me. I hope they work for you, as well.
Rule #1
Joins happen in the sheet, not in the data source tab.
As soon as we relate two tables – like with joins, we need at least one field to relate them on – Tableau is all set up to build joins by itself. It does so whenever we drag fields from more than one table into our visualization. To cut it short: In our data source tab, no data is joined at all. Technically, that isn’t different from before. With traditional joins, the queries happened in our view; although, the join type was fixed in the data source tab. Well, there is a slight change: The traditional joins also materialized in the preview window in our data source. This does not happen with Relationships.
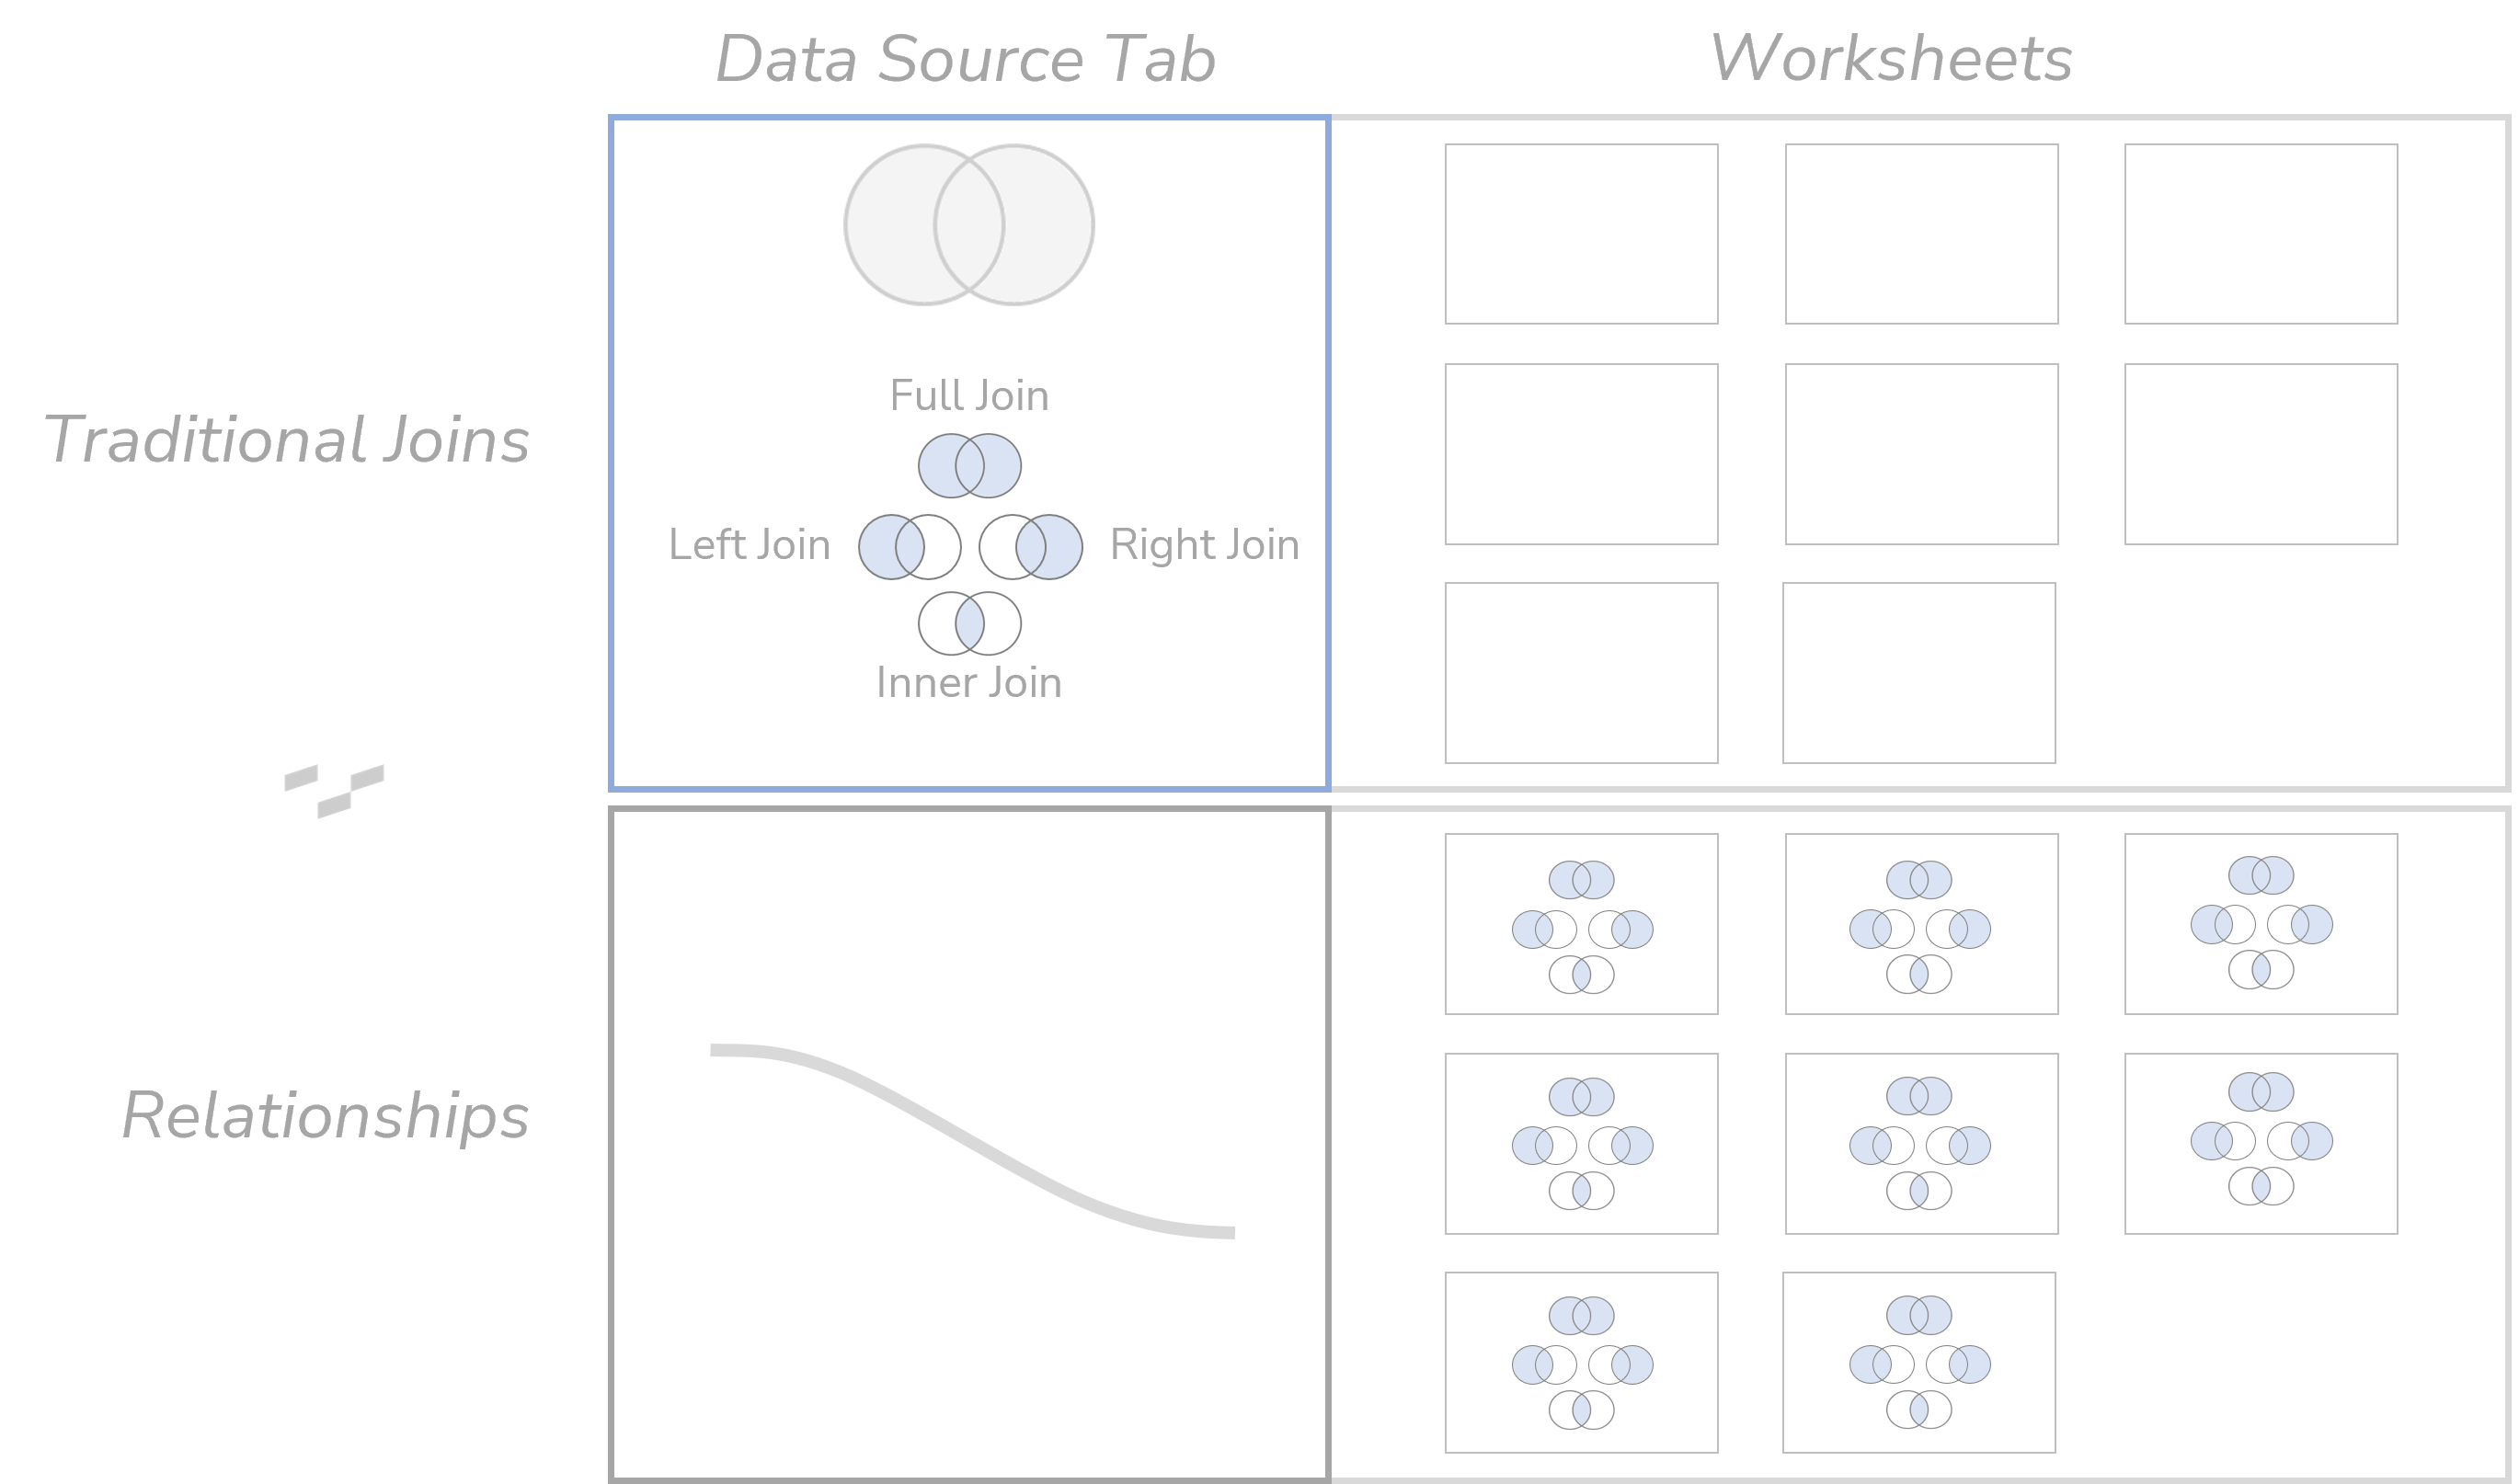
When we jump into our view, the data is still not joined. But the data is available and related. Both separate tables are in there, and we can drag fields from both tables into our view. We drag one field from the first table into the view: still no join. This is the biggest difference to the world before Relationships: Tableau had always joined all tables when only one field was dragged in because it worked with one big, joined table only. Then, we drag a field from the second table into the view, and this is the moment when the Relationship is enforced and the Join finally happens without us seeing it happen. We just see that the data comes in correctly.
That means we are a lot more flexible in terms of joining and not limited to the one Join we defined beforehand like we did in previous times. This drives performance as we don’t have to build complicated calculations to emulate the specific Join we need in a view or – perish the thought! – build a whole bunch of new data sources, each with a different join.
Rule #2
The golden rule, that is: measures retain values.
When we drag dimensions into our view (one from table #1, one from table #2), Tableau will perform an Inner Join so only those values are in our view are those that have a match in both tables. Measures, on the other hand, are more dominant. As soon as we have a measure of a table in the view, all values of that table will be part of the view, no matter if they have a match in the other table or not. For the unmatched dimension elements, we get NULLs.
With a measure from the left table, we get a Left Join. With a measure from the right table, we get a Right Join. With measures from both tables, we get a Full Join. So, what feels like magic is actually something that we have full control over once we know about that rule.
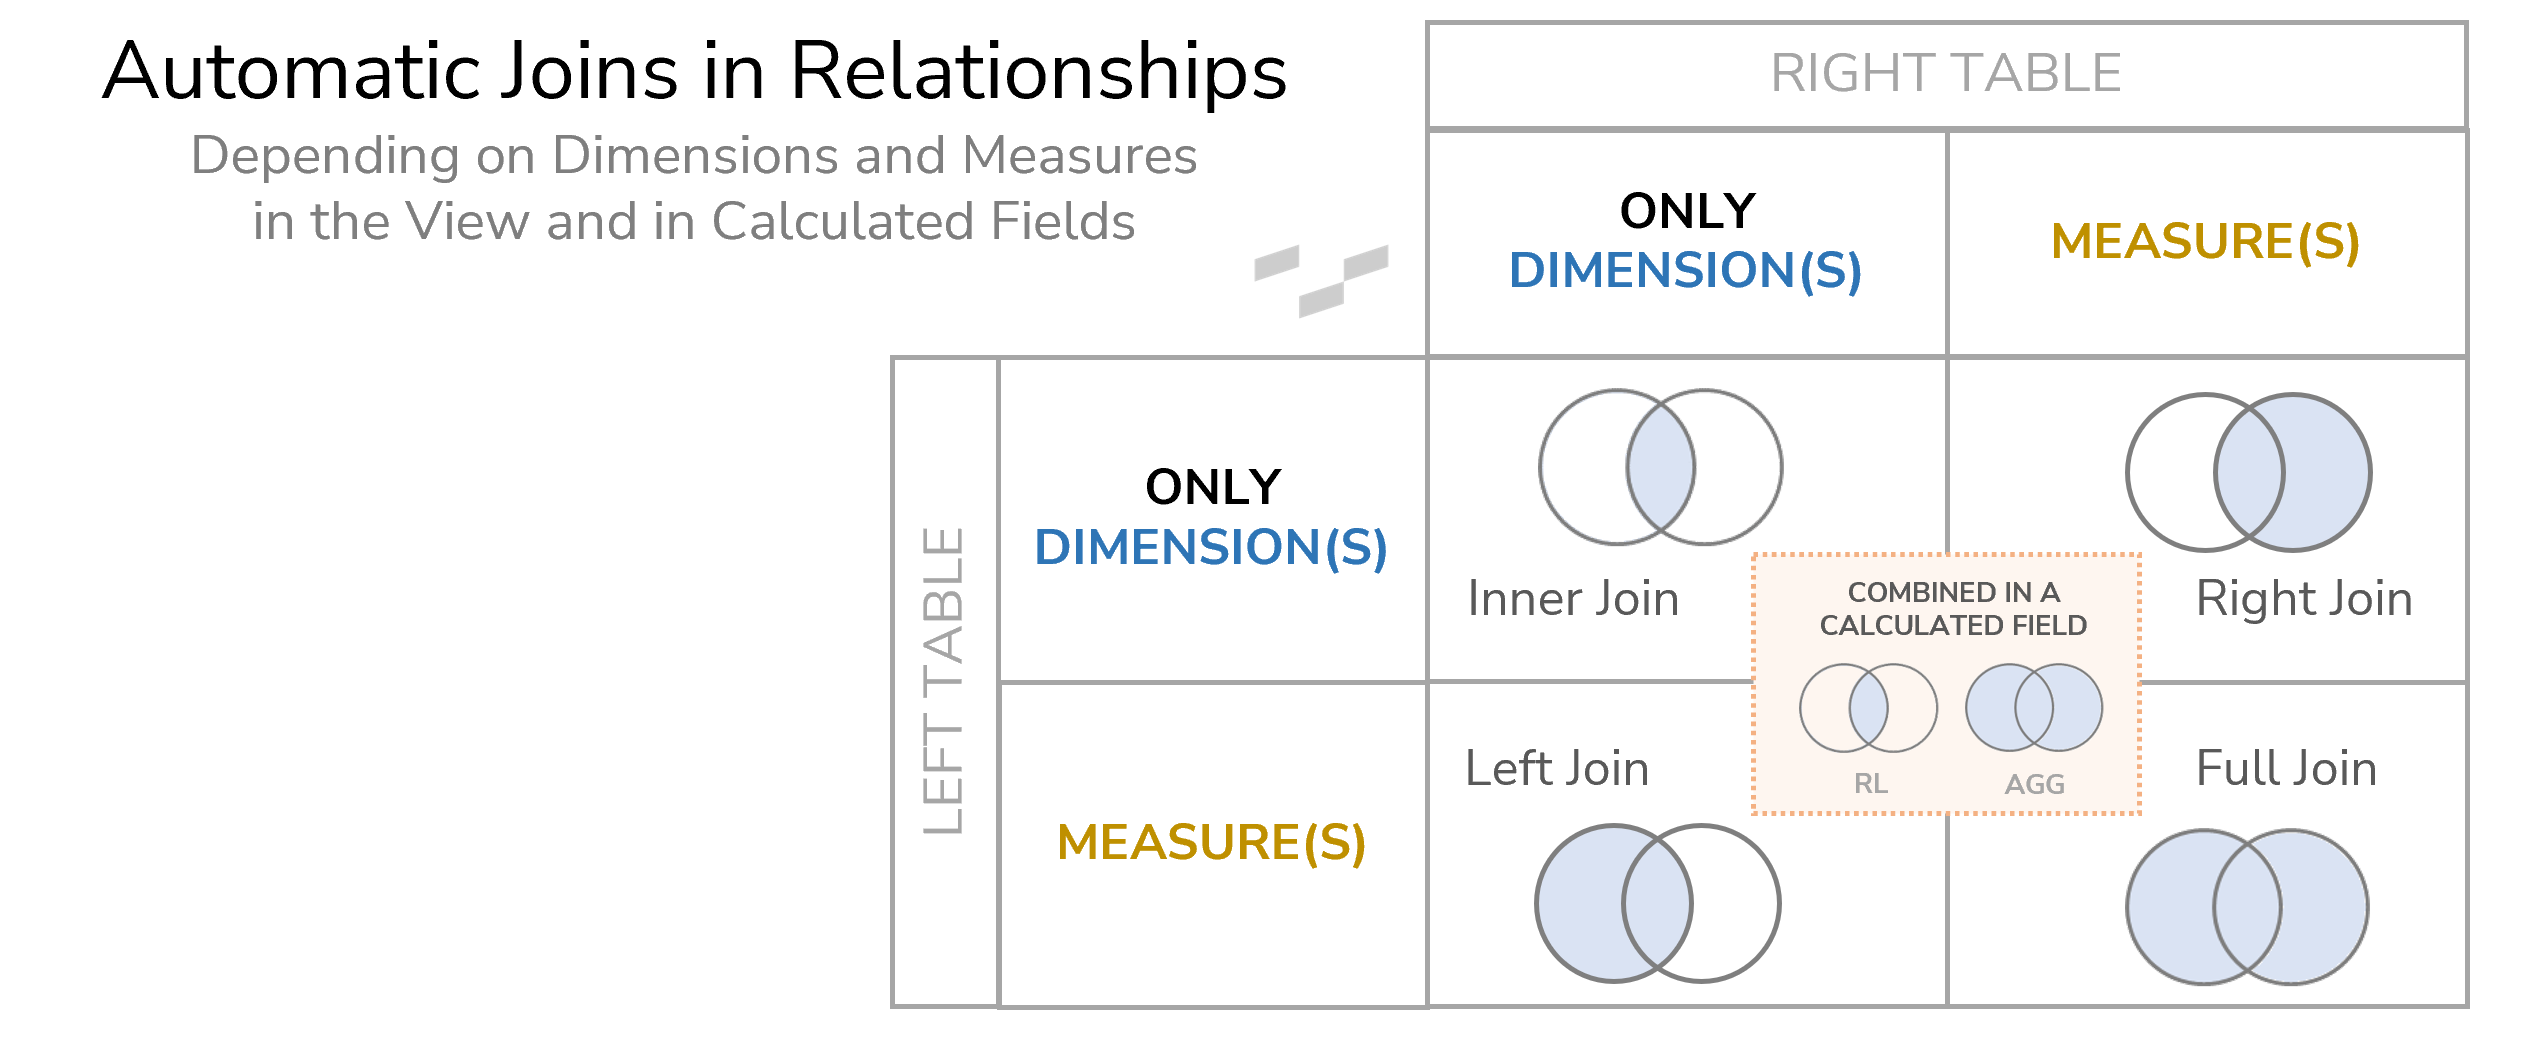
Please know that this is a simplified graph. There is actually more going on here, which we’ll cover further down after Rule #3.
Of course, there is one exception that has to do with calculations (see orange rectangle in the image above). If we combine row-level fields from two tables in a calculated field, we will always get an Inner Join, no matter if they are dimensions or measures. This exception is tricky to understand, especially as it’s getting even more complicated. If we combine aggregated fields from two tables in a calculated field, we will always get a Full Join. Calculated fields usually behave like the view itself when it comes to join types/ This is not so when they combine fields across tables. Let me show you what I mean:
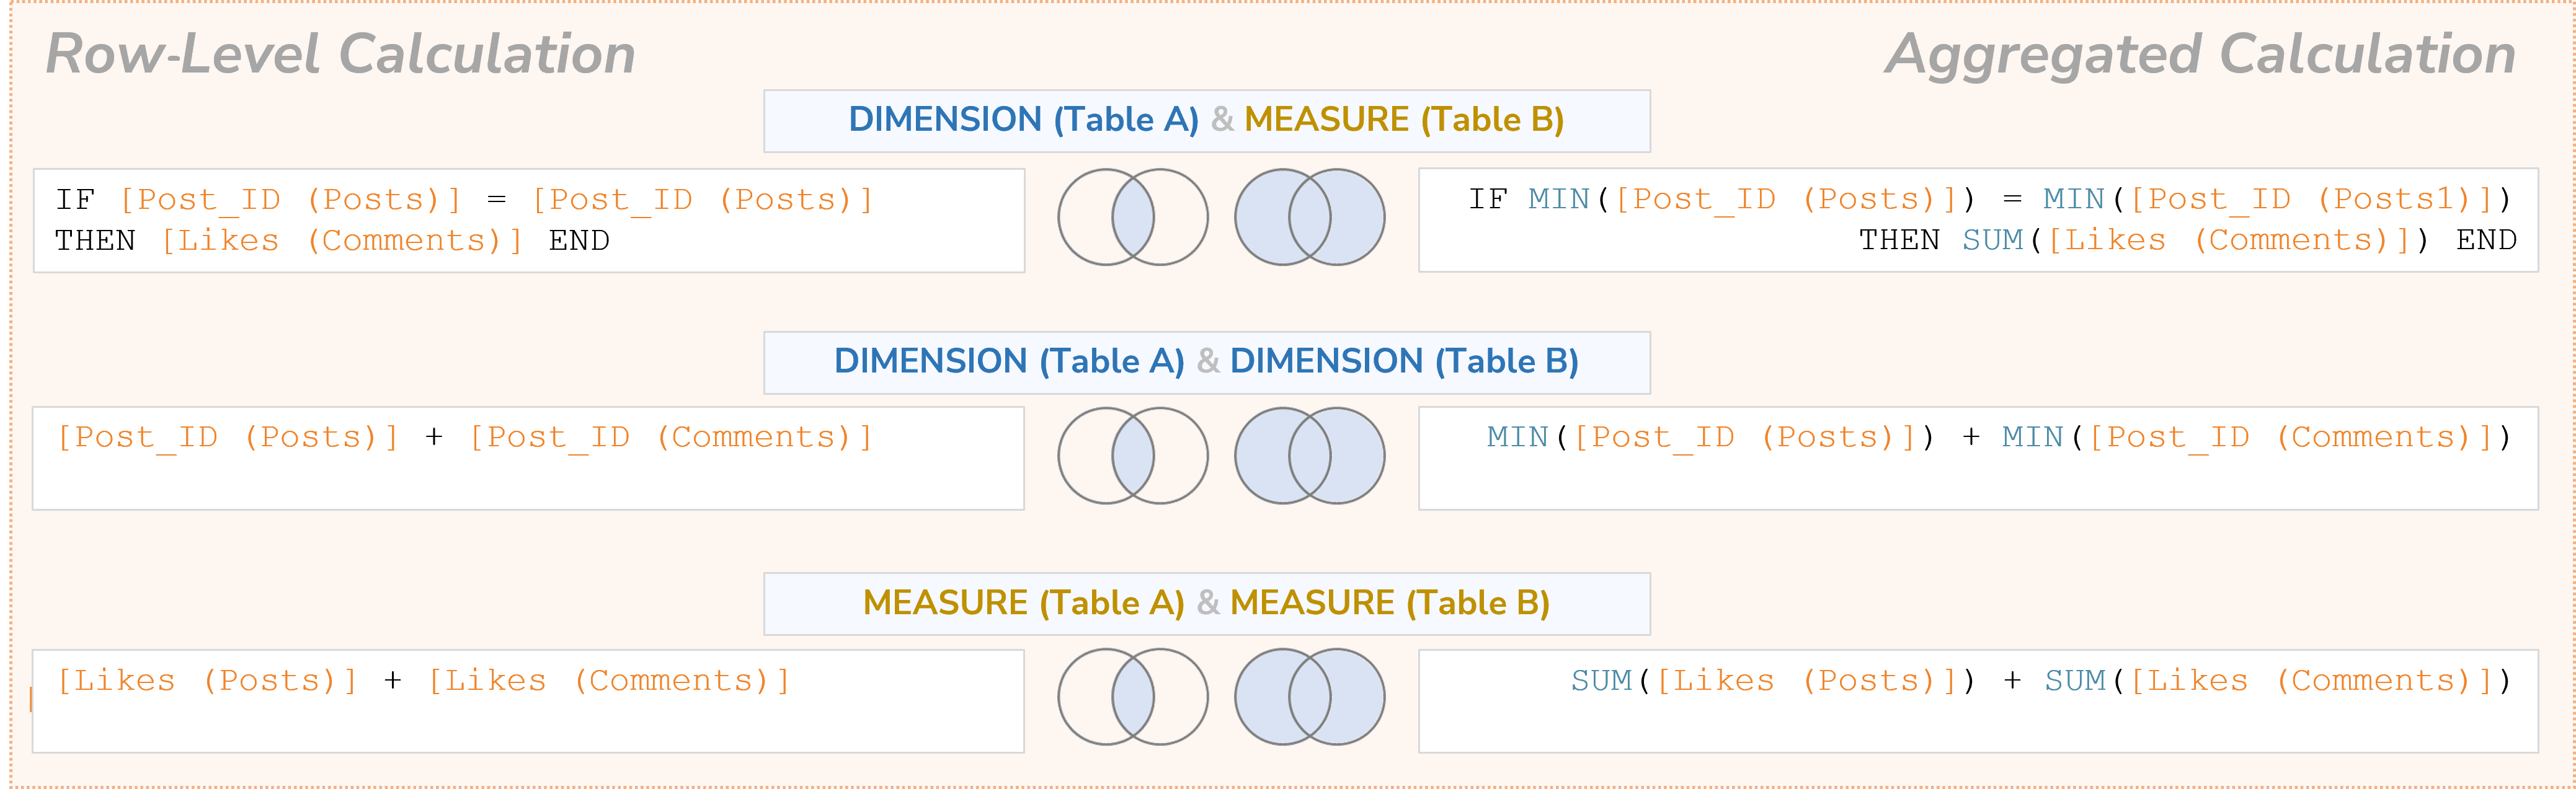
As you can see, there is no way to force a Left Join or a Right Join through a calculated field alone. To work around that, use your row-level calculation and add a measure from the table, of which you need all the values, or use your aggregated calculation and filter the data.
Rule #3
Tables keep their granularity, unless they are both part of a calculated field.
Meaning: When we have two tables with different granularities and want to show measures from both tables, in the old world with usual joins, data from the less granular table gets duplicated. This is not so with Relationships: Tableau retains the granularity when it aggregates the values. We can have aggregations for one granularity right next to aggregations for another granularity in the very same visualization or table, making blends obsolete in many cases.
For me, understanding these three rules was essential to understanding Relationships, and everything else basically fell into place after that. With that in mind, I would encourage you to try them out. Test these rules and use the rest of this blog series as a kind of knowledge base.
The next section of this very article deals with the query behavior of Tableau’s Relationships. It is included below as it shows and hopefully explains why Rules #2 and #3 are happening.
Going Deeper: Dragging Is Querying
I won’t call this a rule, as it really is more of a process that we cannot control. It tackles the question: When exactly do joins happen? There is a very simple way of showing why we need to go deeper because in a very common scenario, our Rule #2 does not seem to apply. Emphasis on the word seem.
Let’s say, we are connected to our Birthday database, with the two tables Birthdays and Hobbies. For each of our friends or colleagues, we have a table with their birthday, and we have a table with their hobby. So, if we are looking for a birthday present, we are going to use these tables as inspiration.
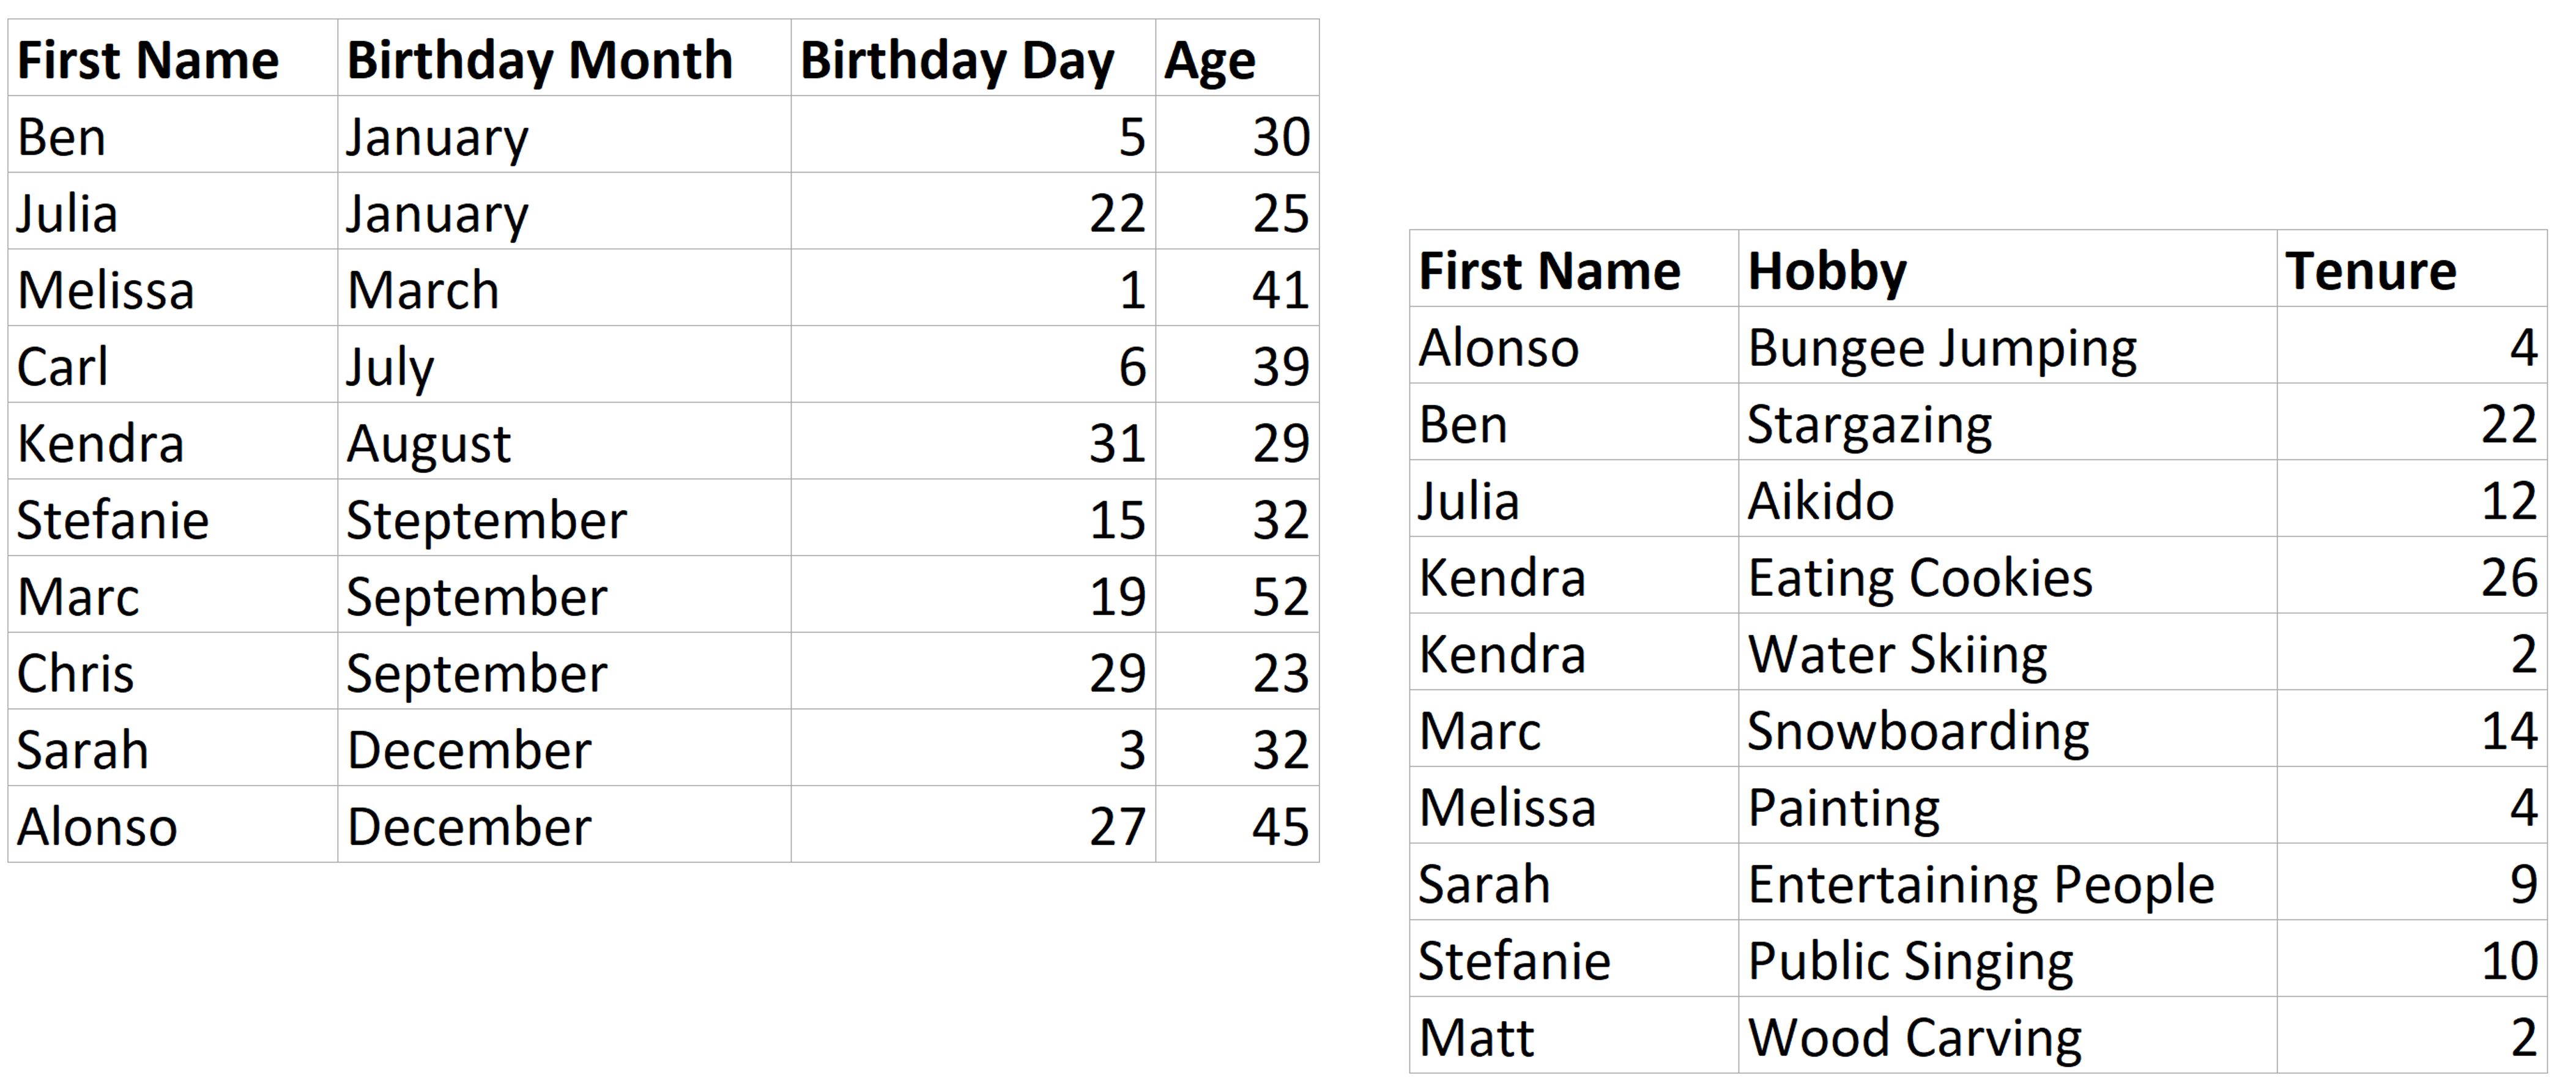
Both tables don’t have referential integrity (more on that in chapter Joins & Referential Integrity of this series). So, for two guys in our birthdays table, we don’t know their hobbies (Carl and Chris). Equally, for Matt, we know his hobby, but we haven’t found out his birthday.
Building a relationship with this data is easy. We start by dragging the Birthdays table into our pane. Then, we grab the Hobbies table and see what happens when we introduce this table into our pane: Tableau connects the Birthdays table to the Hobbies table with an orange noodle. By clicking on the noodle, we can see that Tableau has made a correct assumption to relate the tables on their shared field: [First Name]. Now, let’s get to working in our data!
Let’s imagine that we drag the First Name from the left Birthday table into our sheet as well as the Tenure measure from our right Hobbies table, which tells us for how many years our friends have been pursuing their hobbies. We have learned (Rule #2) that measures retain values. This means that Tableau will build a Right Join for us, including all records from the right table and only the matching records from the left table. Now, Carl and Chris don’t have a match in the Hobbies table. We would expect that we don’t see them in our sheet, right? But when we do that in Tableau, we get this result:
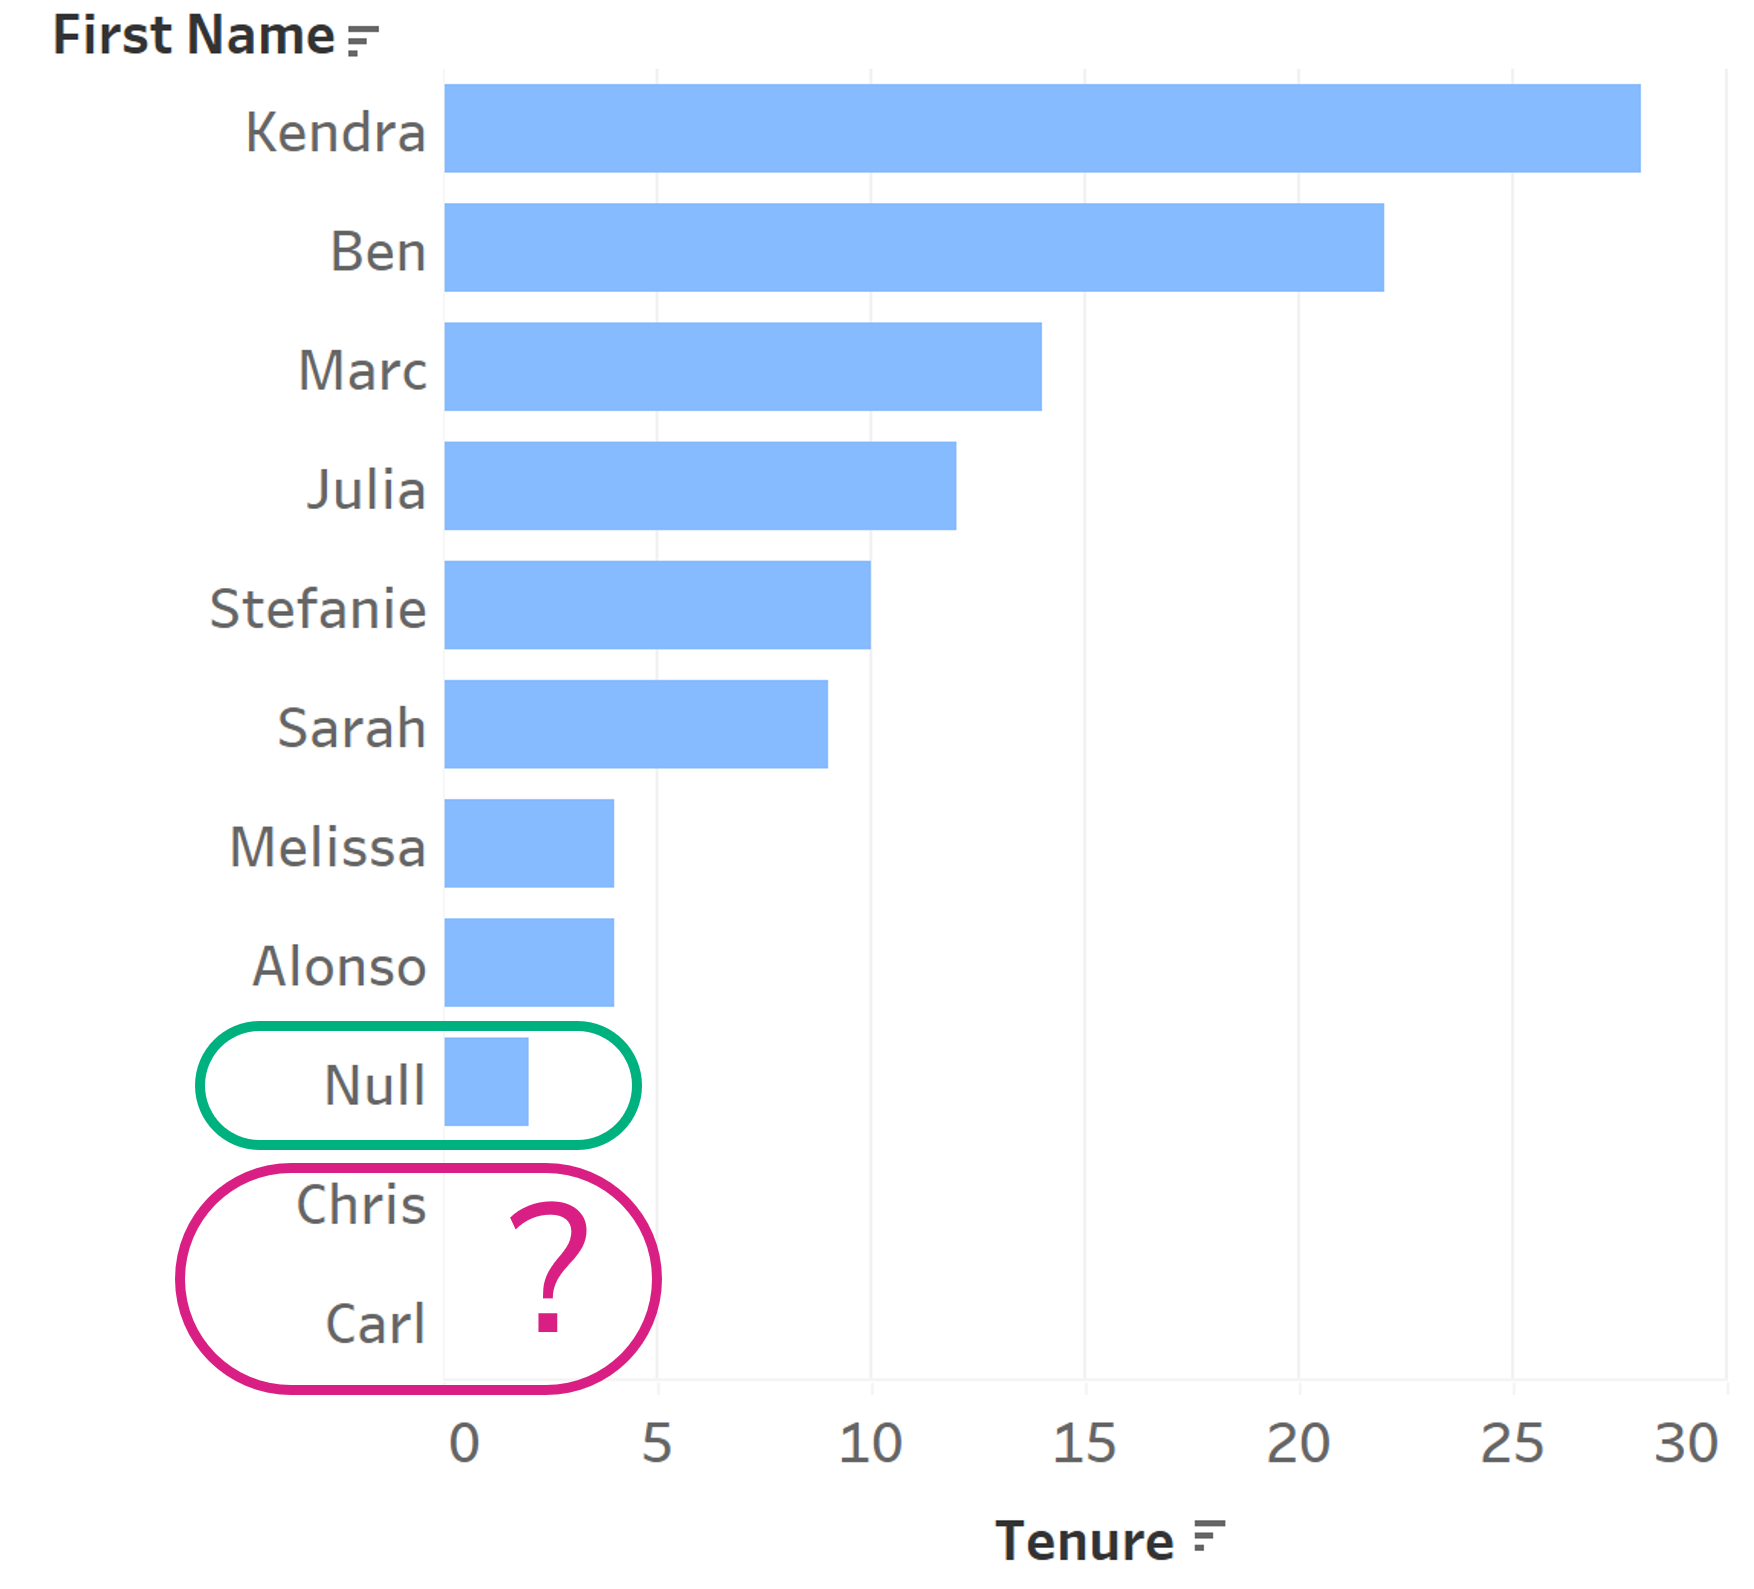
In green, we see a null member for the names from our Birthday table. This is Matt. He doesn’t have a match in the left table, so we don’t get his name, but his records are still retained. This is what we would expect from a Right Join, but we also see Chris and Carl here. The whole chart looks more like the result of a Full Join! What is going on here?
Well, first, our Rule #2 still applies: Tableau did in fact perform a Right Join here. We are not dealing with an exception here or something like that. The bars we are seeing are still the result of a Right Join.
Tableau left the dimension in the view, just as it is without any join, showing all members. Then the numbers (here our bars) from the Right Join are plotted. Chris and Carl don’t get any numbers, thus they get NULLs or missing bars, but Tableau won’t drop them.
Long story short: Whenever we drag a field into the view, we create a query to our database. If that query contains a join that also means that the joining of our data can change in our view. A part of that has always been this way, as well as with traditional joins. Every time we drag a field, Tableau fetches the relevant data from the database by querying it accordingly. This means that Tableau does not load the complete database into the view and builds from there. If so, we might have gigabytes in every view that needed to be processed.
Now, when building a chart like ours, Tableau fires a query for the First Name field and another one for the Tenure field that joins both tables and calculates the Tenure accordingly. After that, Tableau’s process for computing layouts begins. It takes these query results and decides how they should be combined with each other. In our case, both queries remain intact: The full list of names from the left table and all the results from our Right Join for the measure from our right table.
In the end, that basically equals a Full Join, and that is what we are seeing in our view. Let me give you another extended matrix. The single circles stand for queries that happen on a single table only and remain intact. The colorful version shows the query results. The white and blue version shows what we are working with in our sheet: